An empire once, twice around the world
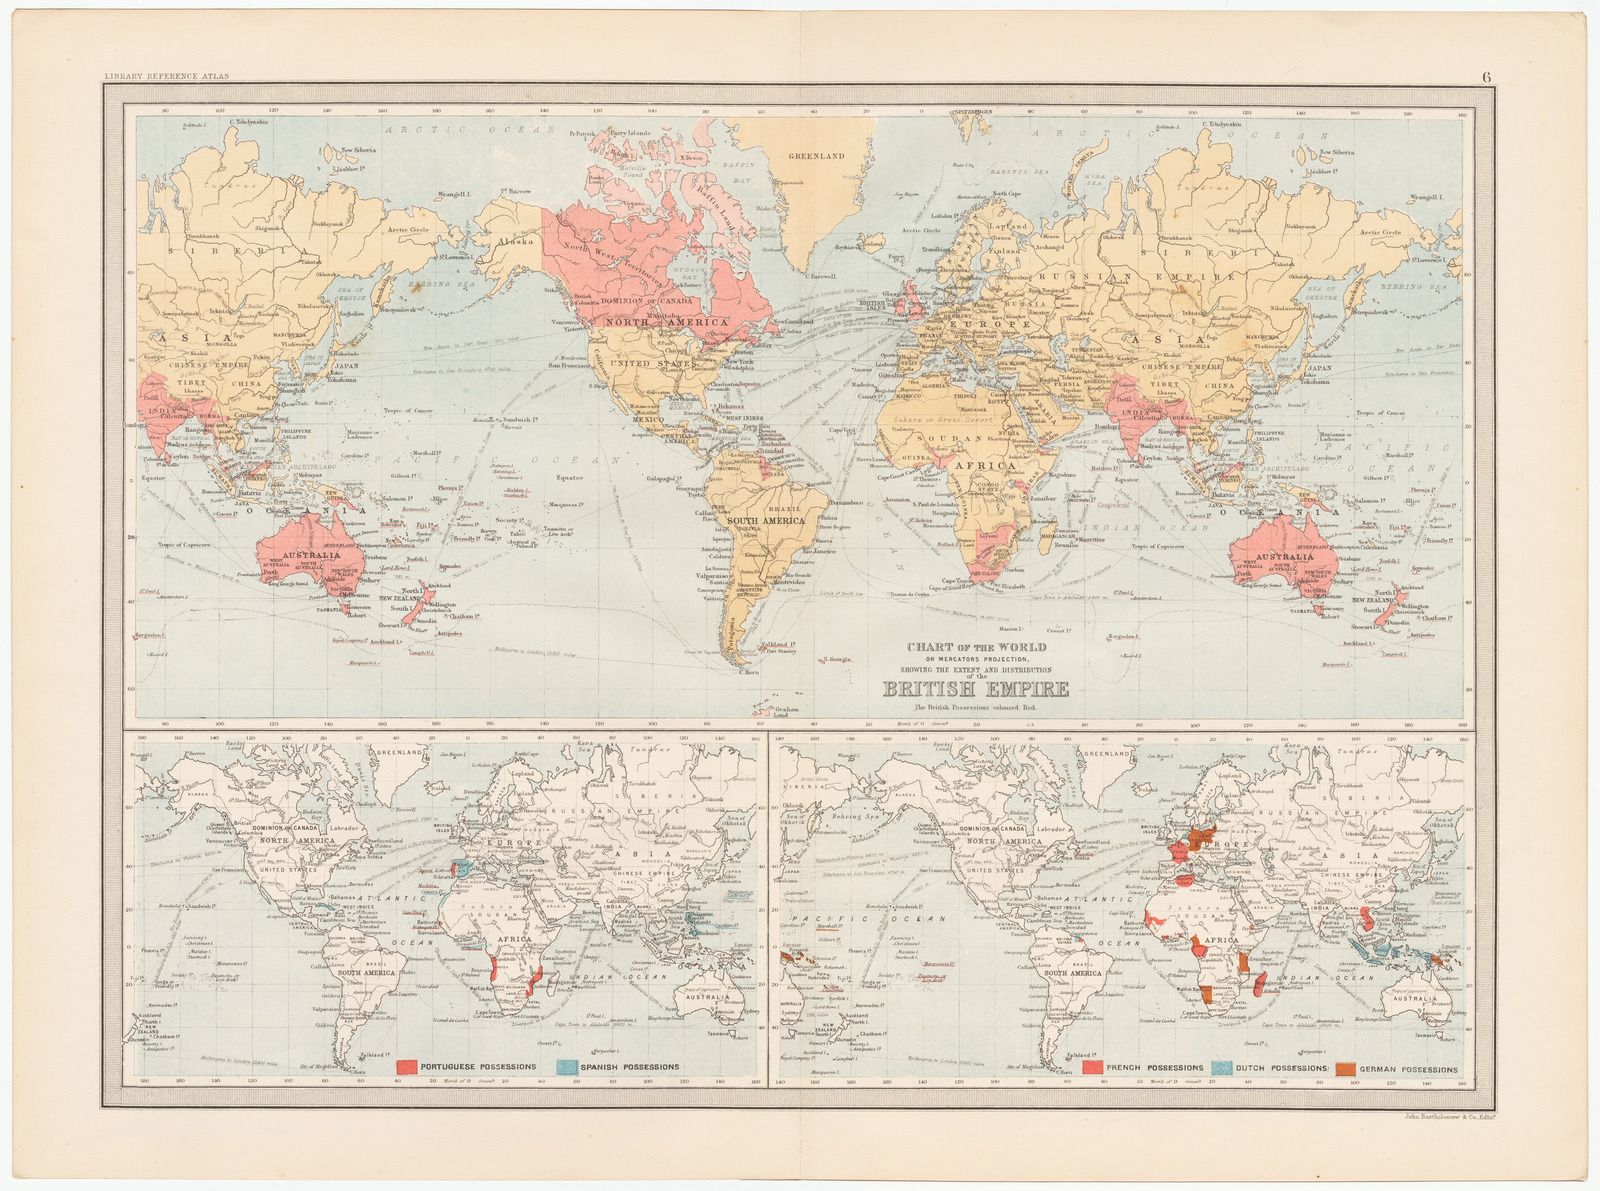
| Title | Chart of the World On Mercators Projection, Showing the Extent and Distribution of the British Empire |
| Creator | John Bartholomew (1831-1893) |
| Year | 1890 |
| Dimensions | 29 × 42 cm |
| Location | P.J. Mode Collection, Cornell University Library |
On a Mercator or any other rectangular projection, the cartographer has to make a choice about where the edges will be. Most often, the seam where the globe is unwrapped and stretched out from end to end is a line of longitude in the Pacific Ocean. This means that Alaska and the eastern parts of Russia look like they're on completely separate sides of the map, even though in reality they're only a few kilometers away from each other at their closest point.
If you start from the top right (northeastern) side of this map, you'll see that familiar edge, with a little bit of Alaska peeking out towards Russia. As you move left (westwards) across the map you'll pass by Siberia, Scandinavia, the North Atlantic, Canada, Alaska, and then—Russia again? This map has unrolled the globe more than once, so that all of the space between longitudes 70° E and 180° E appear twice, on both the left and right sides of the map. Therefore, this map has two Siberias, two Chinas, two Japans, two Indias, and two Australias.
Why would someone have wanted to produce a duplicative map like this? This map was created by the Scottish mapmaker John Bartholomew (1831–1893) and printed in 1890 in The Library Reference Atlas of the World, along with 84 other maps. (Bartholomew was one of several people named John Bartholomew in a family of noteworthy cartographers—there's another map by his son in this exhibition.) The atlas's place and time of publication give a clue: it was published in London, and 1890 was near the height of the Victorian Era, when British popular culture was closely linked to the nation's identity as a global empire. As a reference text schools and educated households, this atlas would have documented the dominant British view of the world at the time.
Wander across the exhibition →
Because this double-wrapped projection meant that India, Burma, Australia, and New Zealand would appear twice, this map had the effect of duplicating some of the British Empire's largest territorial possessions. This wraparound view doesn't provide any additional geographic information—if you look at the two Australias, for example, you'll see that the same cities and provinces are shown on both copies. But this map does allow the British Empire to look like a far larger percentage of the world's land area than it really was. The two smaller maps in the lower half of the page, which show the possessions of other European empires, don't follow the same double-wrapping pattern.
Seeing the world awash in red, the typical color used for showing British possessions, was a source of pride for British imperialists. It also gave Britain a literally outsized role in cartographic representations of the world, one which made it easy to forget that the British Isles themselves are tiny. As the historian Linda Colley puts it, in maps like these, “the world-wide expanse of the empire was foregrounded, while the physical limits of the islands at its core were adroitly obscured in the overall design.” ()
You can flip through the pages of our copy of The Library Reference Atlas of the World below. (You'll notice that the “British Empire” map, plate 6, is missing its left half—something which a librarian noted in the margins of that page in 1917. The large scan of this page is from the P. J. Mode Collection at Cornell University.)
Double Vision
Read the title of this map made by a Scottish mapmaker in 1890. Even though it is a world map, the size of the words in the title tells us what it's really about: the places in the world controlled by the British government, colored in red, at the time the map was made.
What do you notice about the red areas of the map? Do you see anything strange? This mapmaker put in two Indias, two Australias, two New Zealands. Why might a British mapmaker repeat some parts of the world that his government rules over? And why would he choose not to do it on the two smaller maps at the bottom that show the parts of the world ruled over by other European governments?
In addition to how words, color and symbols are used to send messages through maps, careful map viewers need to look closely at what is being represented.
Can you think of other ways nations might use maps to convince people that they are powerful?
Bibliography
- Colley 2003
- Linda Colley, “‘This Small Island’: Britain, Size and Empire,” Proceedings of the British Academy 121 (2003): 171–190.