Land Speculation
People trying to sell land have always had an interest in puffing up an area’s most appealing qualities, and downplaying its liabilities and limitations. Sometimes, a map is the only thing that a buyer will see before deciding to put down money or begin making plans to move. Because of this, carefully-edited maps have long been important tools for marketing land. These maps were all created in order to excite prospective settlers, developers, and homebuyers about the resources and investment potential of different places.
Mapping Boston Foundation
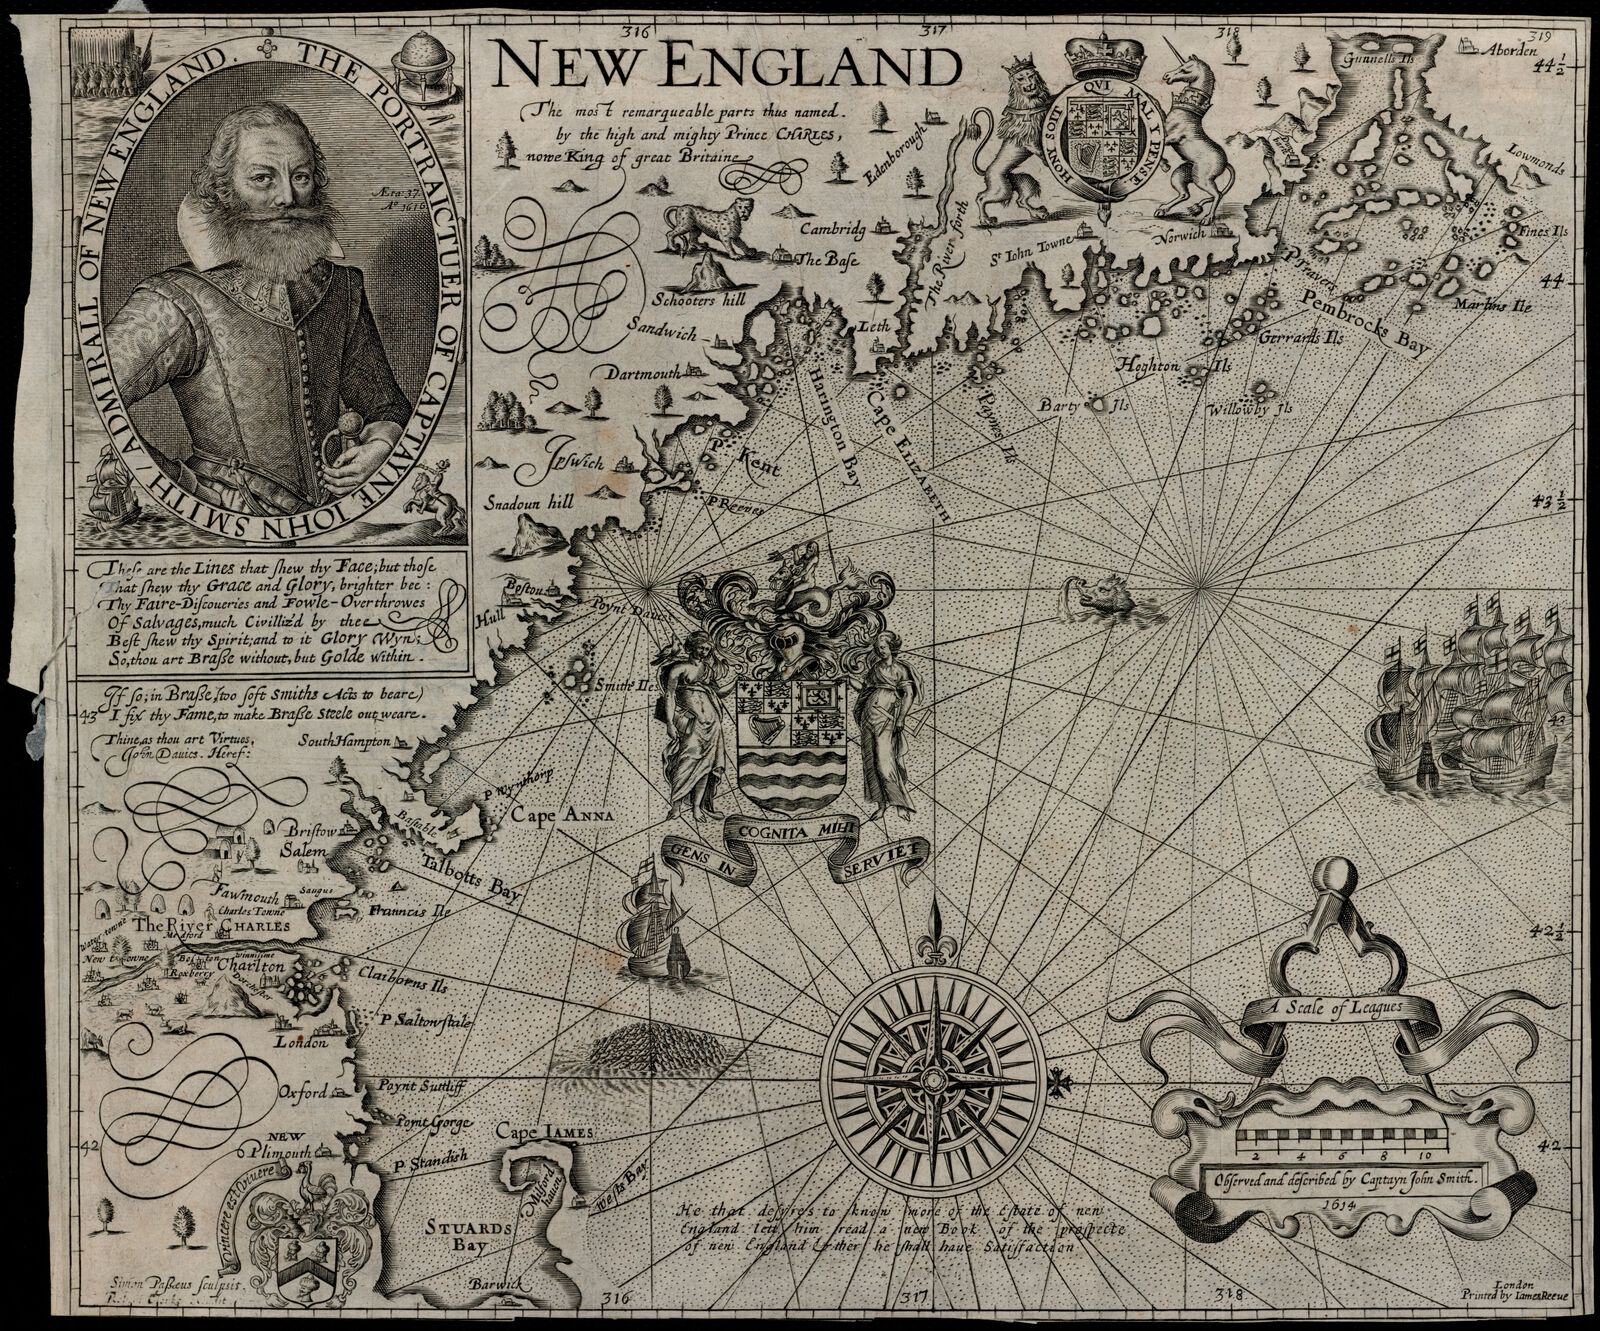
Every map reflects the desires of its era. The royally-chartered corporations of the colonial period needed to convince potential settlers that the land on the other side of the Atlantic was bountiful and healthy enough to risk placing all one's bets on an uncertain ocean voyage. Based on the 1614 exploratory voyage of John Smith, this 1635 map of New England's “most remarqueable parts” features an optimistic portrayal of a European-like landscape of harbors, towns, and livestock—the sort of place that might seem like an attractive place to begin a new life. A caption on the map recommends the 1634 book New Englands Prospect, one of the first descriptive guides of the area for English settlers. Like most other colonial maps, it almost totally erases the presence of Native people who had already lived in North America for millennia. It also offers a more amusing example of selective editing: compared to the earlier 1614 edition of the same map, John Smith himself boasts a more extravagant beard in this map's illustration.
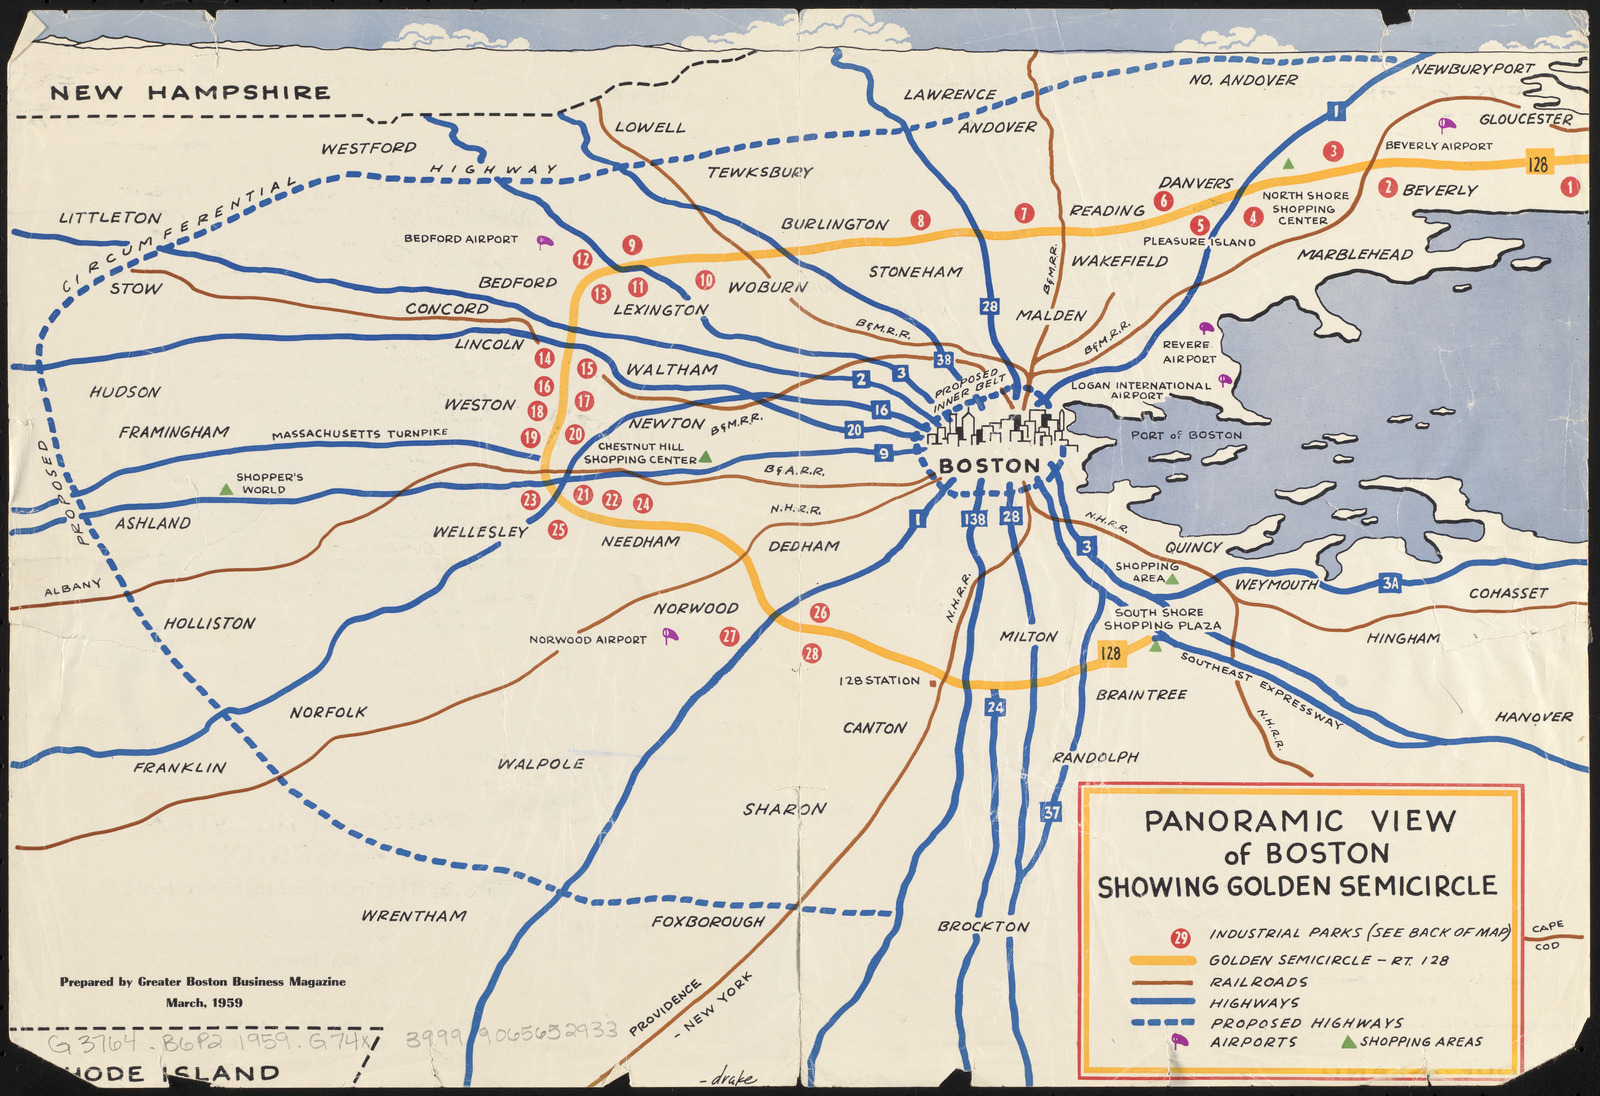
More than 300 years later, this 1959 map of the Route 128 corridor in suburban Boston shows off very different resources. The “golden semicircle” traced out by the highway's route around the periphery of the city is dotted with the locations of industrial parks, with the color gold connoting the potential riches to be found in a new automobile-centric ring around the city. When the Greater Boston Business Magazine published this map, developers were scrambling to buy up land in the suburbs as the Massachusetts economy shifted. By showing the city proper as both relatively unimportant and also easily reachable by new highway infrastructure, views like these helped to speed forward a new economic geography for the postwar era.
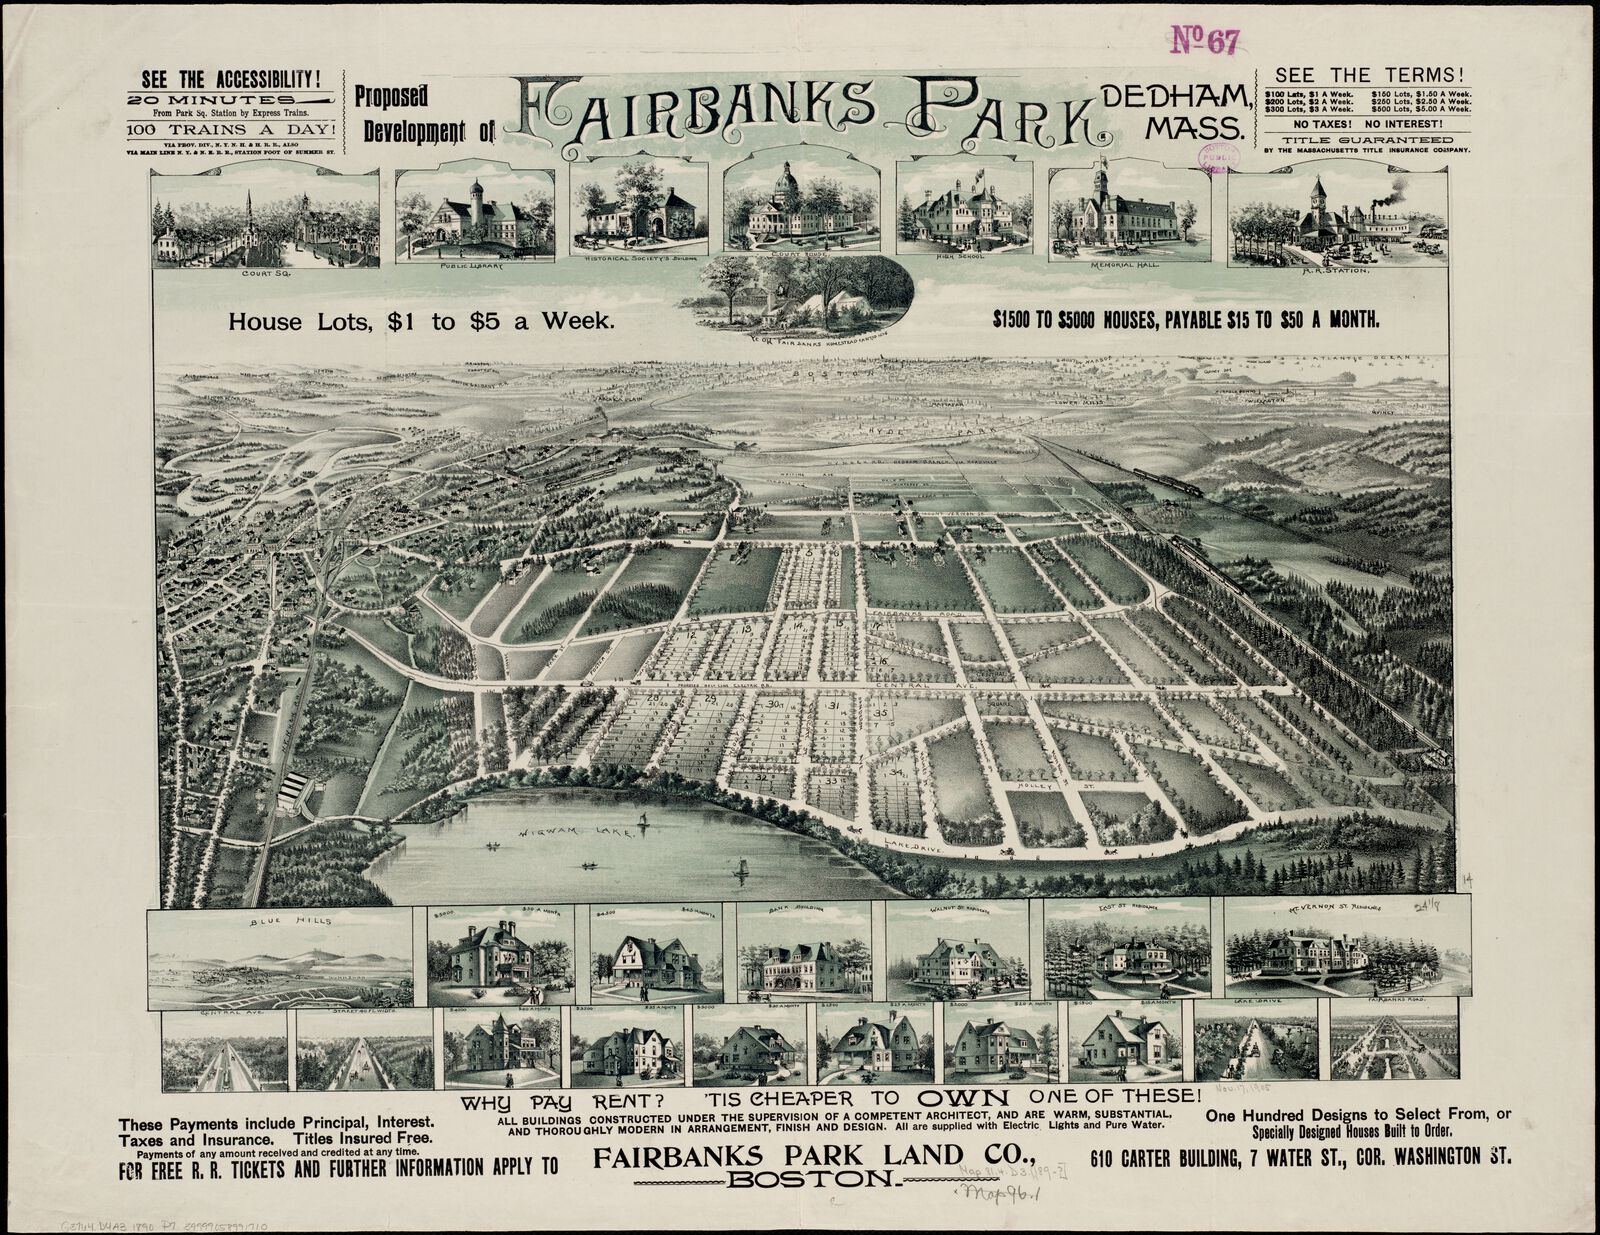
Even before the automobile, however, developers already were using maps to promote the advantages of living on the edge of the city. This promotional map of Fairbanks Park, a 1890s streetcar suburb, can hardly contain its enthusiasm. The Fairbanks developers lined this map with boastful claims: “See the accessibility! See the terms! No taxes! No interest!” The bird's-eye view of the proposed neighborhood, accompanied by illustrations of model homes, depicts a leafy residential life connected by trains and streetcars to downtown Boston, which appears on the horizon. The lucrative financial combination of home financing and land development, which exploded in the late nineteenth century, relied on suggestive maps like this one to convince members of the emerging middle classes to sink their earnings into speculative residential developments.
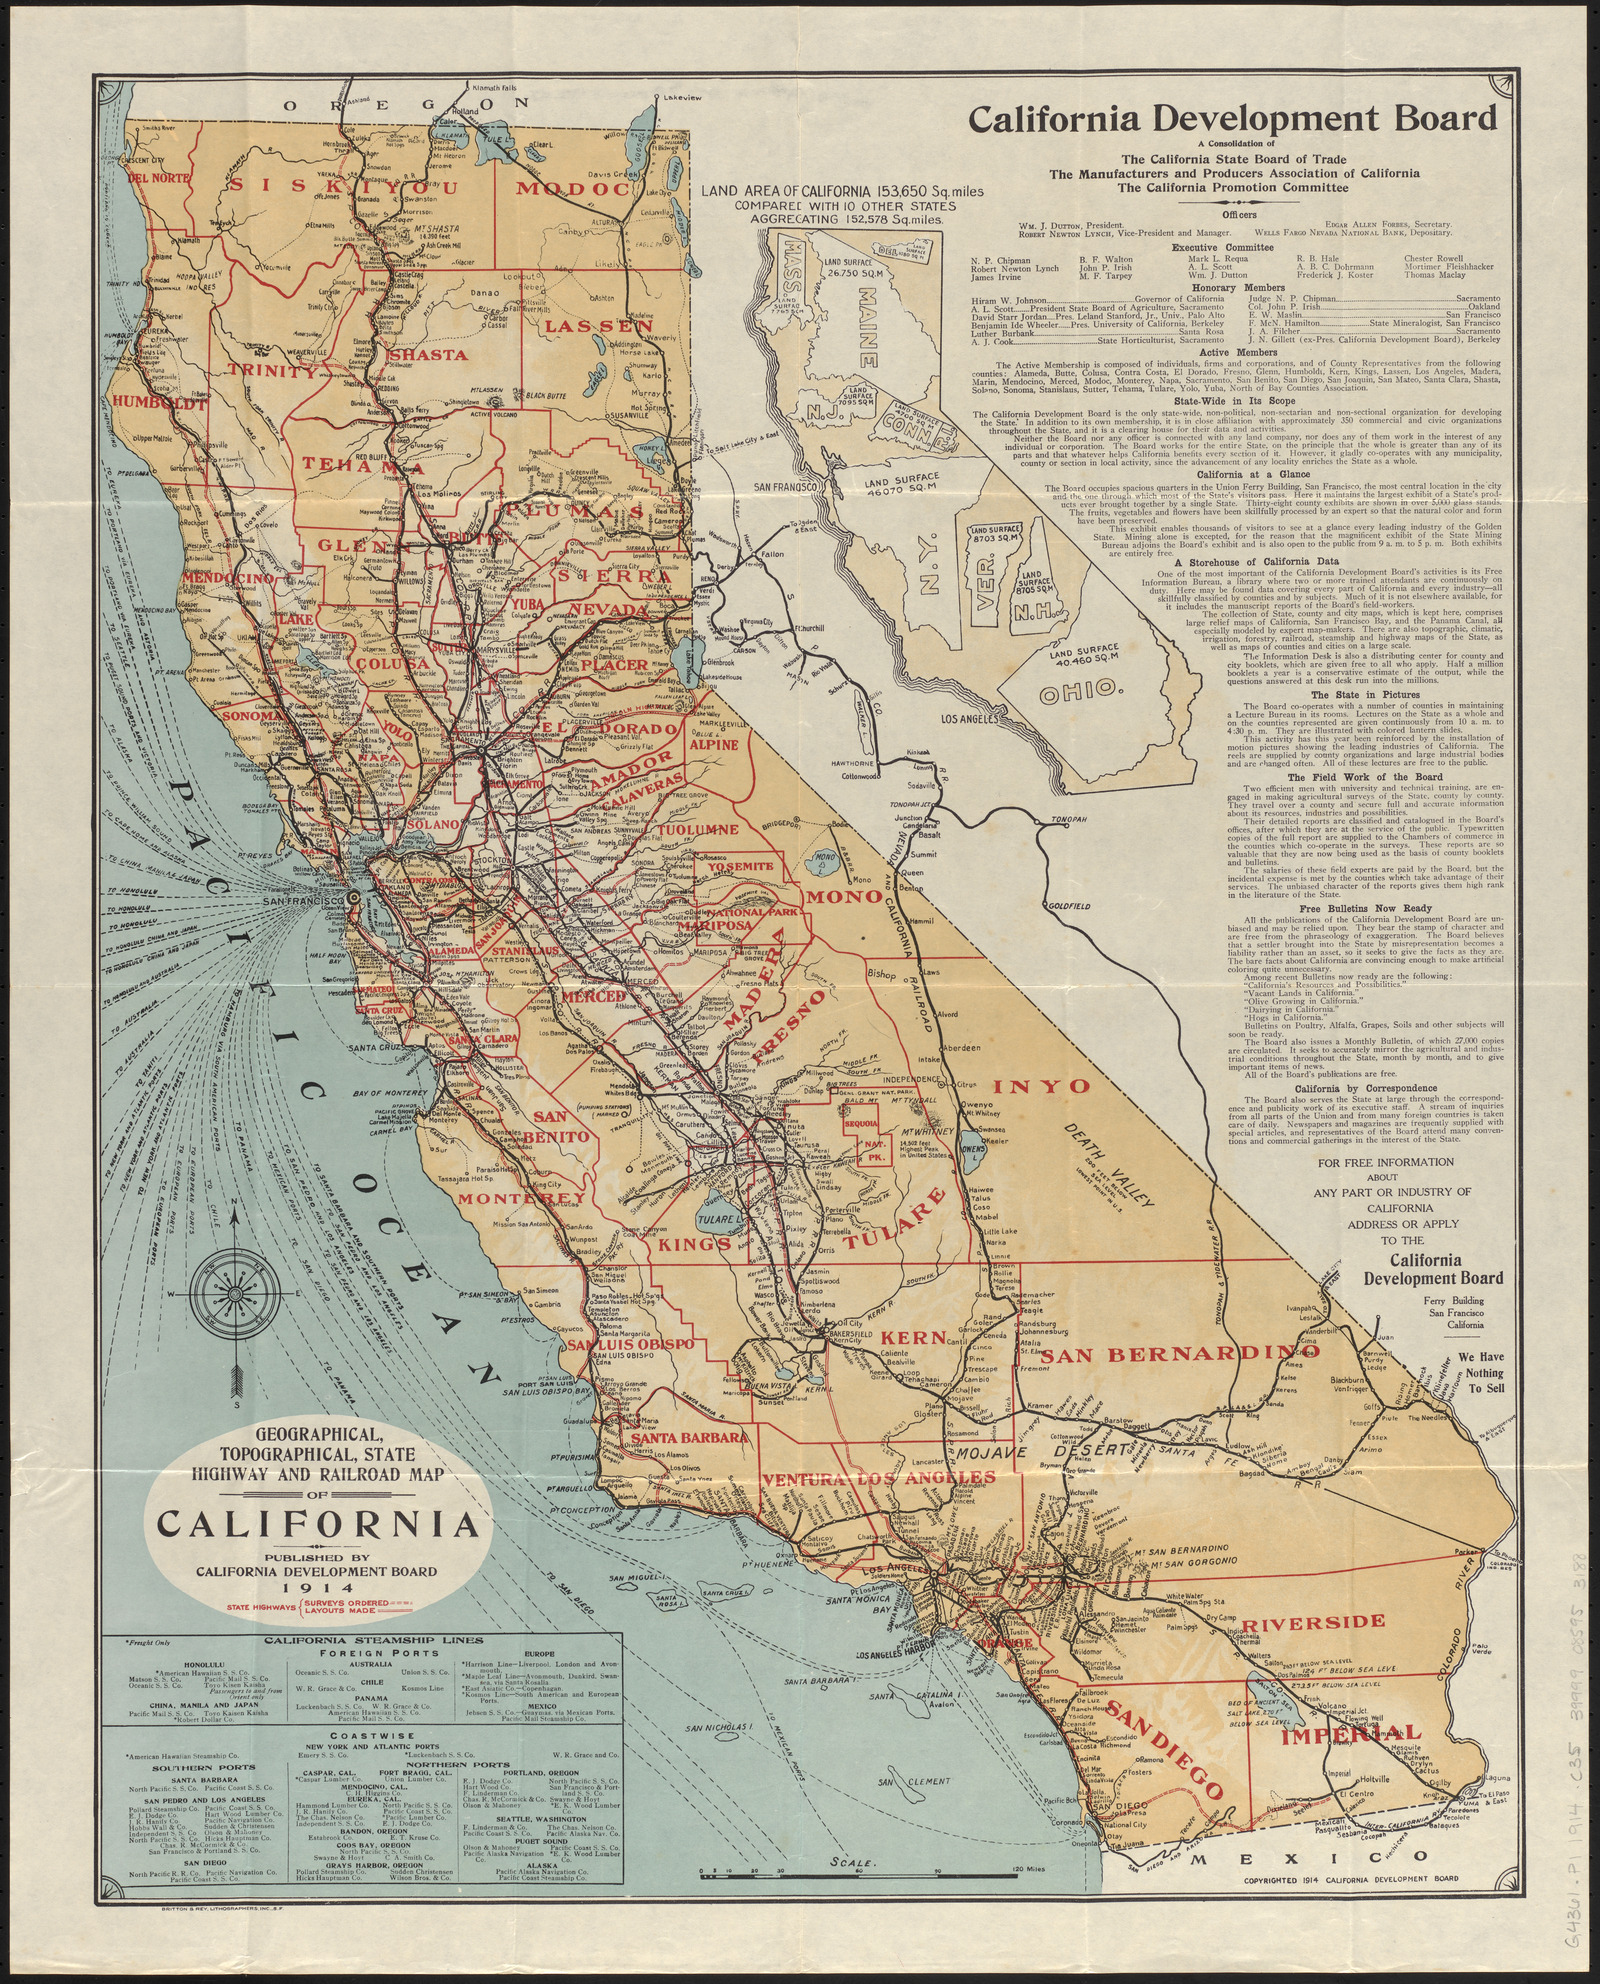
In contrast to the Fairbanks developers, the California Development Board swore by this 1914 map's objectivity. “We have nothing to sell,” the text insists. Yet the Board was created to market the state as a promising location for investment. The organization was keen to appear as a trustworthy arbiter of information, emphasizing its “non-political, non-sectarian, and non-sectional” constitution, and describing the “Information Bureau” it had create to provide “data covering every part of California.” But this information and data all had a single purpose in mind: to drive people and money to the Golden State. Emphasizing infrastructure, natural resources, and the state's gigantic size, this map promotes California as a land of opportunity.