Demystifying Data
There are plenty of opportunities for data to be misrepresented, miscommunicated, or distorted through the visual methods in which it's displayed. But there are also reasons we should always remain careful about data itself. It might be tempting to believe that a good cartographer could make a map of “pure” data, without introducing any kind of visual errors. Data, however, is created through human processes, and it is always structured and categorized according to the ways that people understand the world. It requires people to distribute surveys, ask questions, take measurements, tabulate results, winnow out errors, encode fields, and provide access. At every step along the way, people make evaluative and interpretive choices, and this means that even “raw” data has a perspective.
The anthropology of race
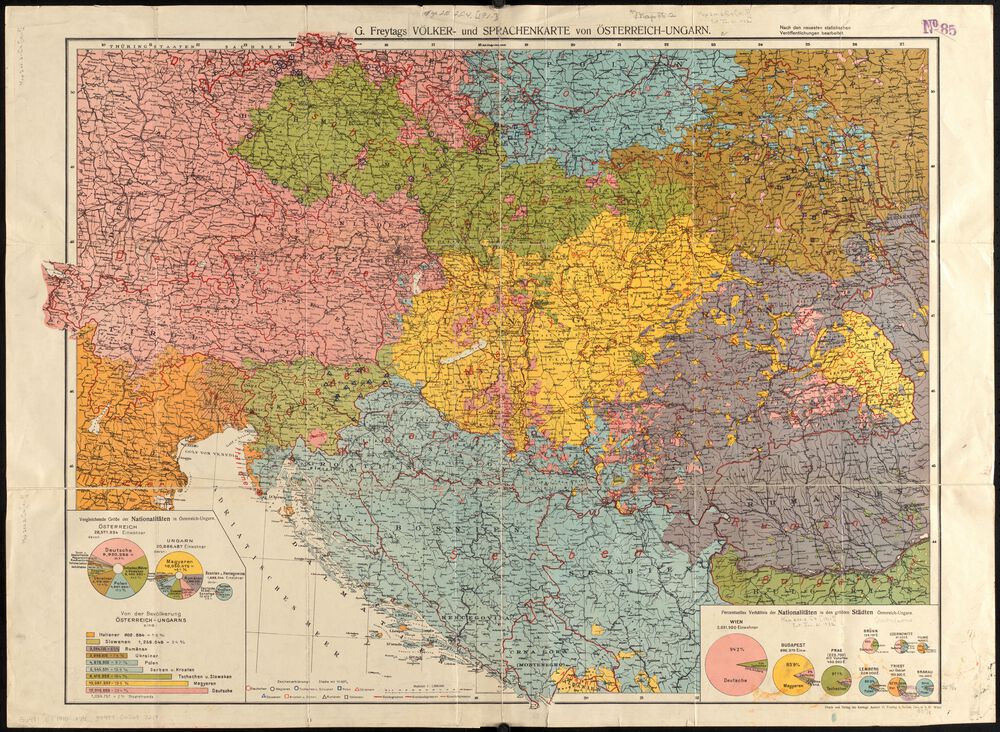
The categories of race and ethnicity are amongst the types of data which have historically been most constructed and contested. This ethnolinguistic map of Austria-Hungary from the 1910s demonstrates an obsession with ethnic classification that boomed in Europe around the turn of the century. It uses the technique of a choropleth map to show distinct areas which each enclose a specific group of people. Here, the visual language follows an assumption which is slipped into the data itself: the idea that people can be classified as German, or Hungarian, or Croatian ethnic types.
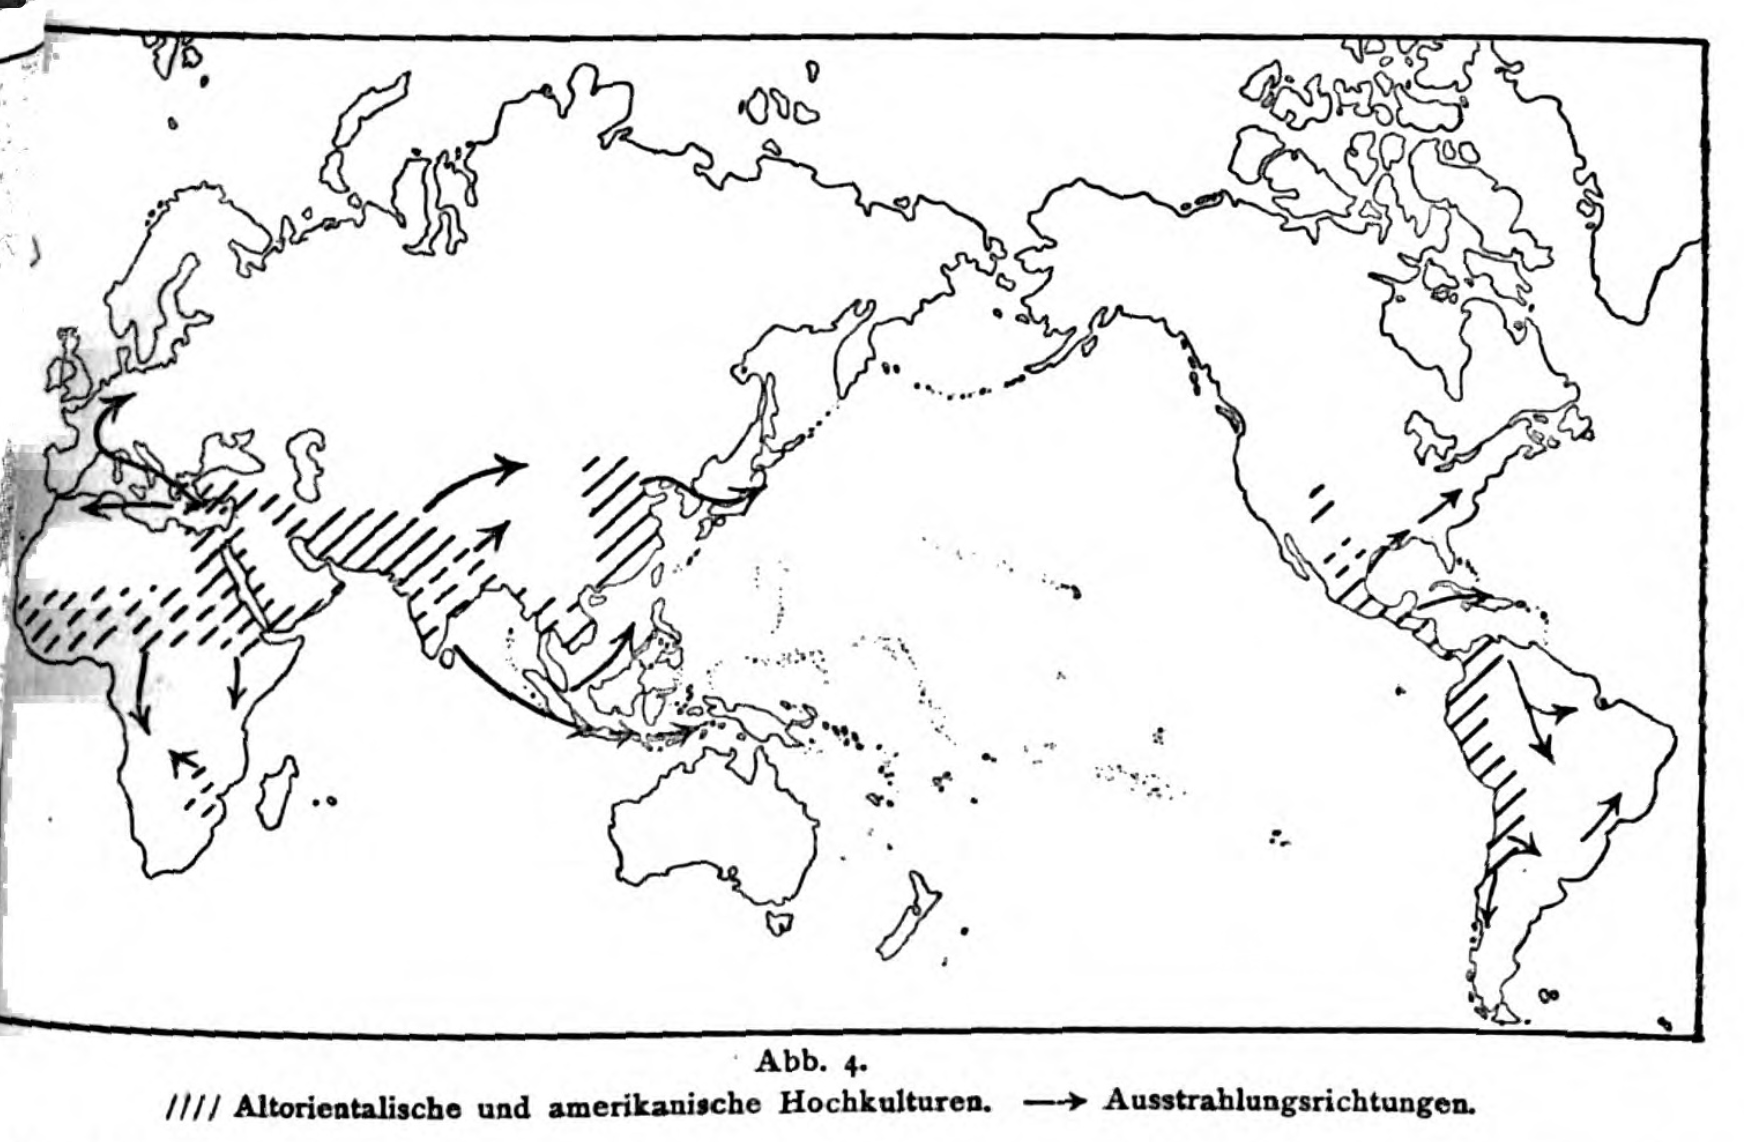
By contrast, the German anthropologist Fritz Graebner created these maps in a 1923 textbook in order to portray a more fluid understanding of human variation. These maps are more similar to cline maps, a type of map which shows gradual variation across space, which leads to different conclusions about categorization than the sharp edges of a choropleth map. Graebner believed not only that ethnologic groups blurred into one another, but also that they were historically mobile, branching outward from a single human family.
Census classifications
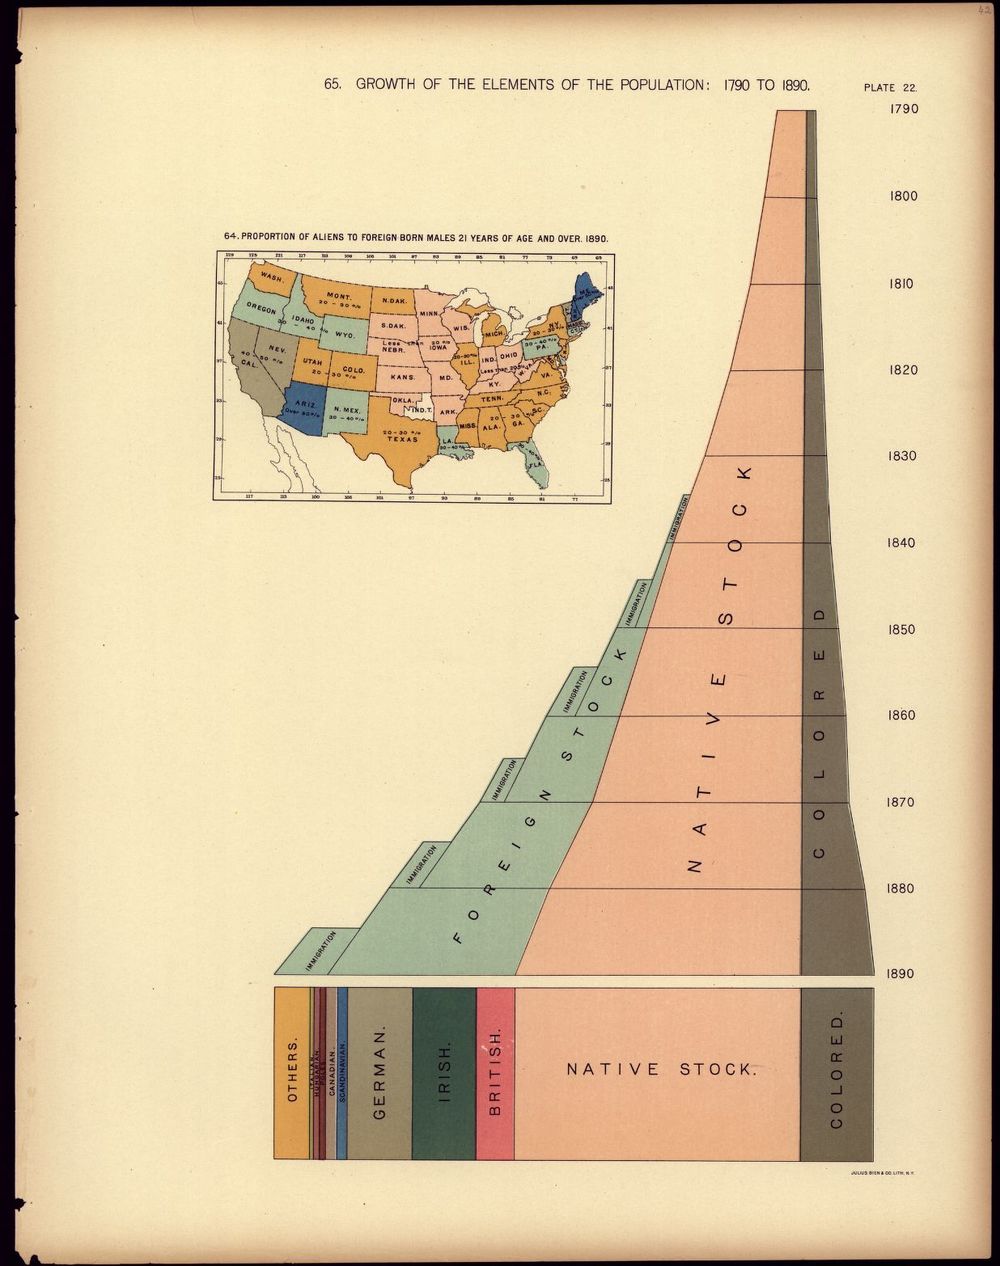
If you looked at the Census to compare how many Asians lived in the United States in 1990 and 2000, you'd get a deceiving answer, because during that time, the classifications were changed: Pacific Islanders and Hawaiians were counted as Asians in 1990 but not in 2000. That's just one example of how the data can change even as the people stay the same, and the Census is one of the most influential examples of racial classifications shifting through time to reflect new assumptions about human difference. This graph from the statistical atlas of the 1890 census shows the use of the term “stock”—literally derived from animal husbandry—to classify the population into “native” and “foreign” categories. Meanwhile, the “colored” population counted as neither foreign nor native, but as an entirely different category of its own. Because race isn't a real biological marker, but instead a social invention that matches systems of prejudice and power, those categories have shifted and changed over time, following each era's predominant attitudes about race and human categorization, as this timeline from the Pew Research Center documents.
People make data
Even when categories and classifications stay stable, it's still up to people to examine the world and resolve it into the specifications of a data set. Census taking, for example, involves thousands of workers visiting people's houses and making determinations about race, occupation, income, and other variables. If the answer doesn't fit into a given category, then the tabulator has to make it fit. Some people provide incorrect information, and sometimes an answer is just a wild guess. But it's hard to tell that kind of uncertainty from a line in a database, which makes it deceptively easy to treat data sets—especially large ones—as if they were just true all along.
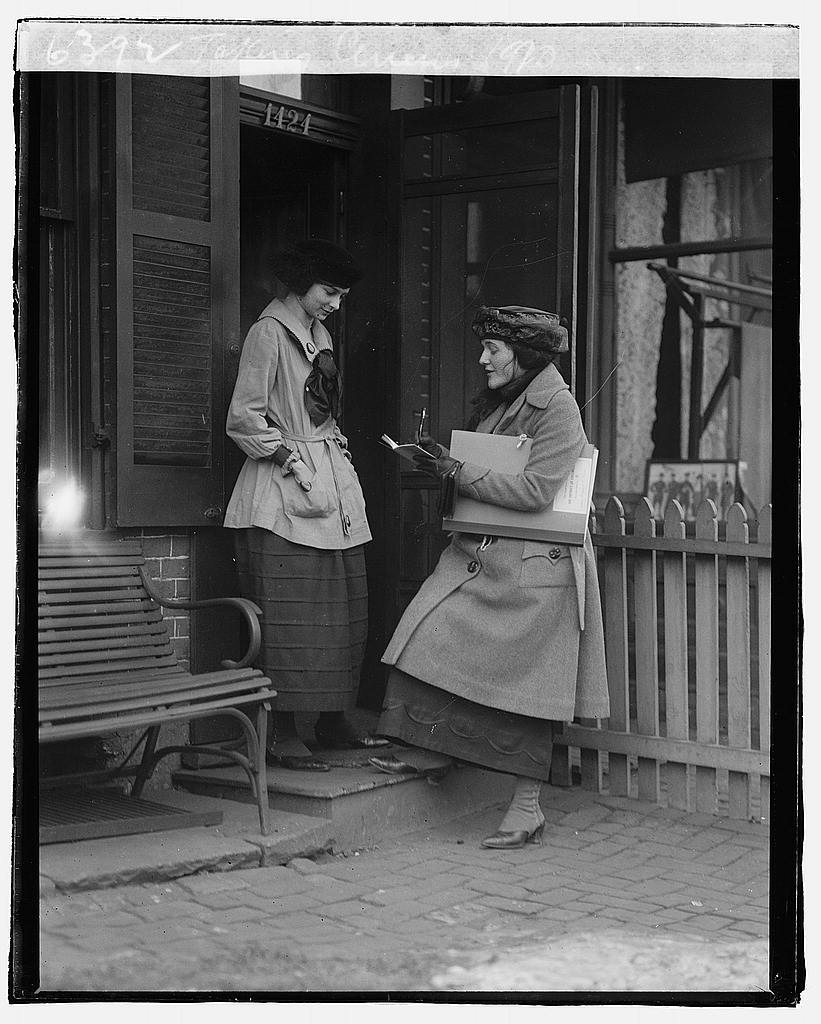
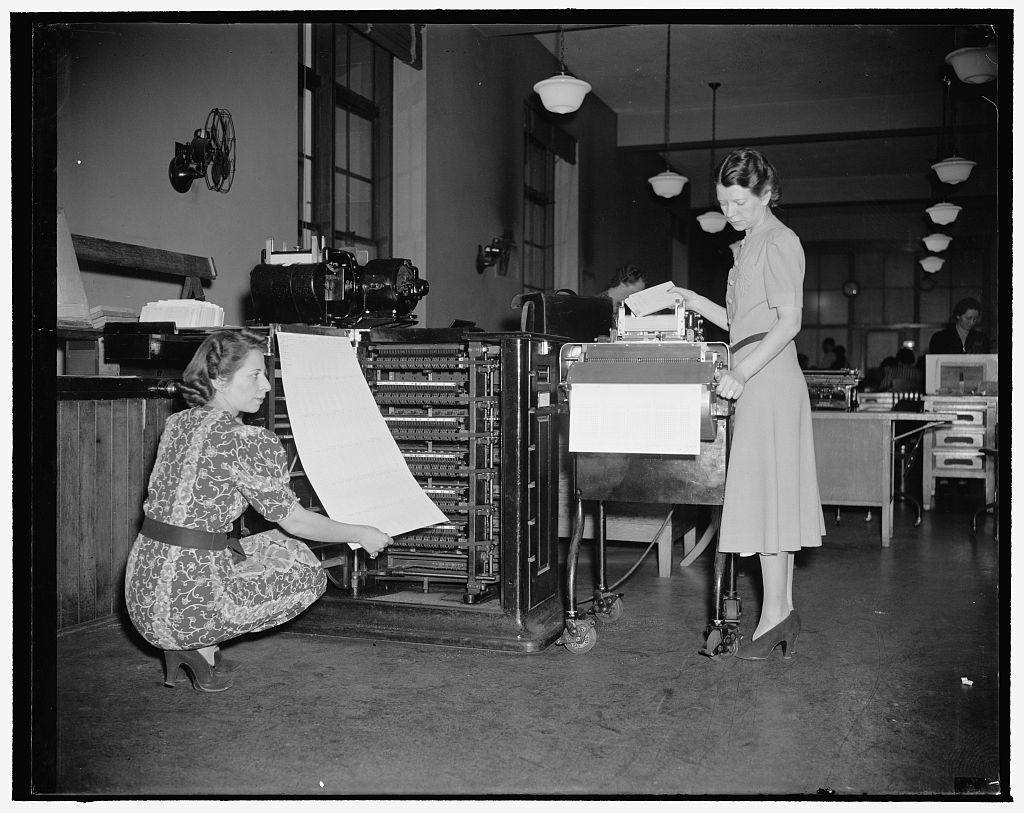
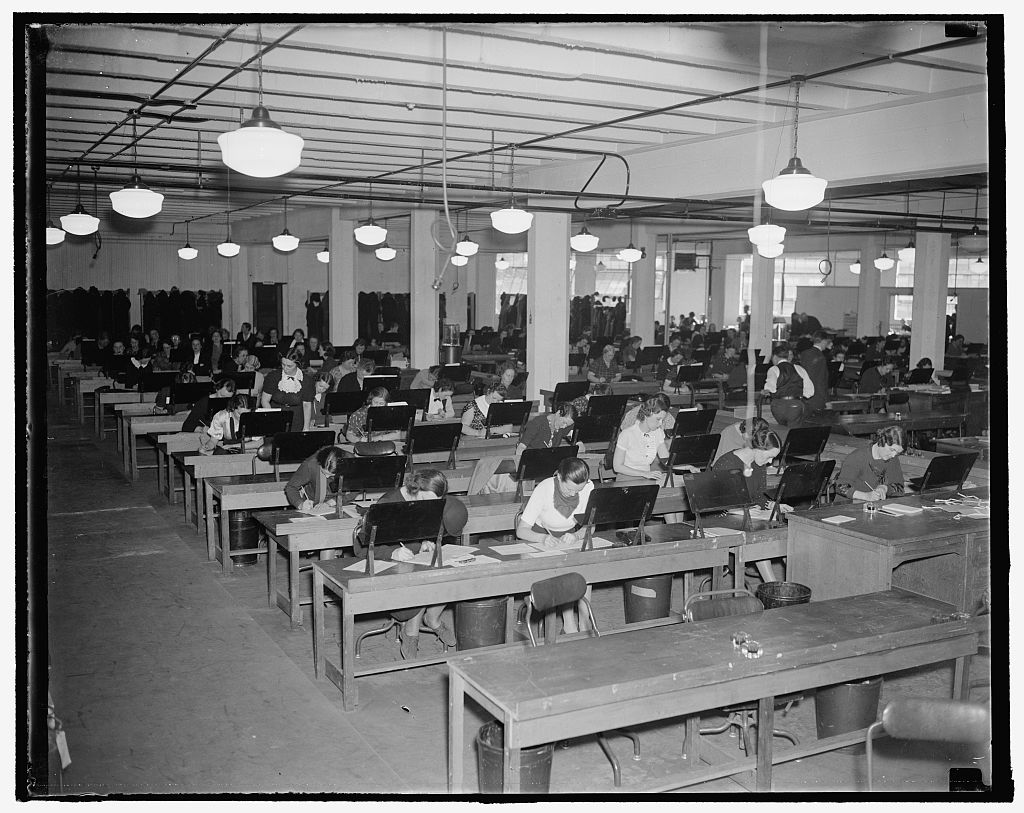
These photographs show Census workers collecting, tabulating, and sorting data. Much of this work is now done by electronic computers, but the original term “computer” referred to somebody's job—and most of the computers were women, who manually added up and cross-checked huge tables of information.