Glossary for Students
Map Terms to Know
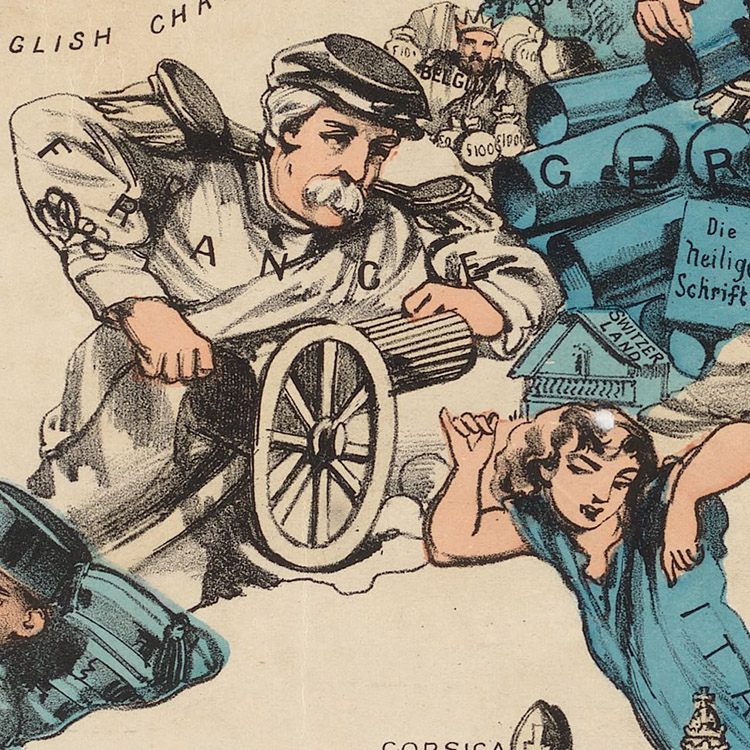
caricature or serio-comic maps: These maps use exaggerated illustrations, turning geographic areas into pictures, to send a particular message or create an intended feeling in the viewer. Caricature maps have often been used to make a statement on international relations.
cartographer: A cartographer is a mapmaker.
census: A census is a count of a population. The Constitution of the United States requires that all the people in the country are counted every ten years, and it’s been happening since 1790.
Census Bureau: This is the branch of the United States government responsible for counting the population of the country every ten years and making that information available to the public and other governmental agencies.
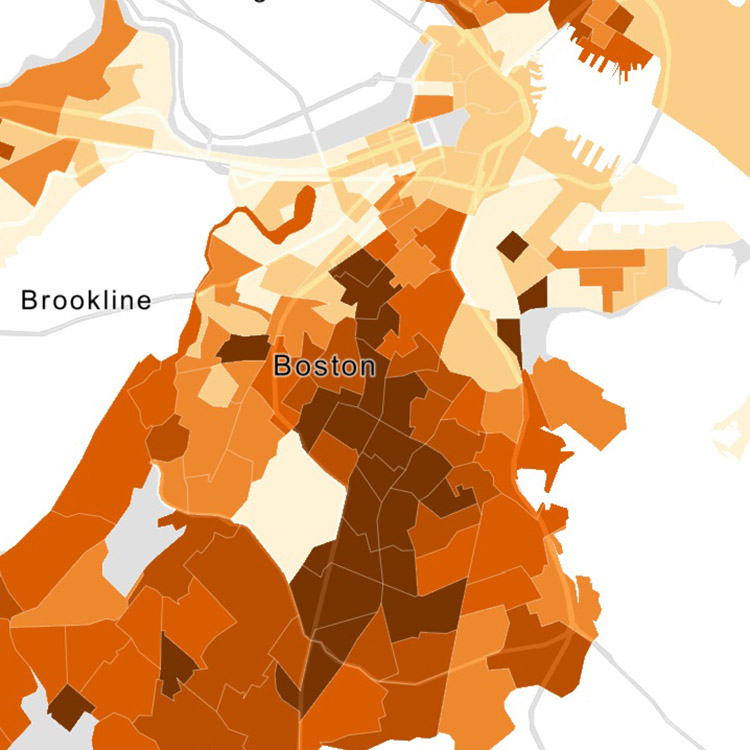
choropleth map: This kind of map shows information about where there is more or less of something by using a range of colors in different areas.
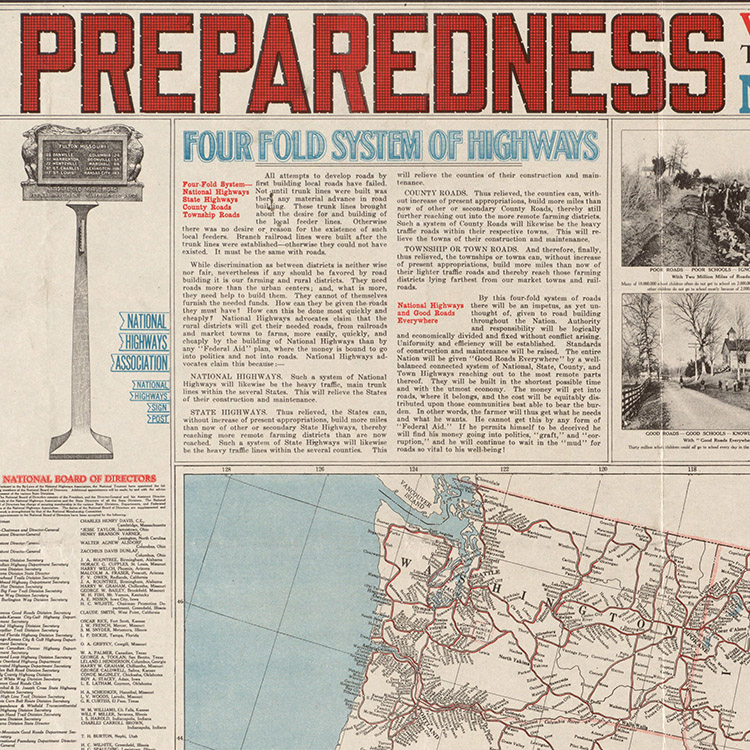
color: Color is very important to mapmakers, and they are very intentional about it. The choice of color to show locations, amounts, and in a map’s overall design has a lot to do with how we understand a map’s story. Some colors feel very dramatic while others feel very subtle because colors convey emotions.
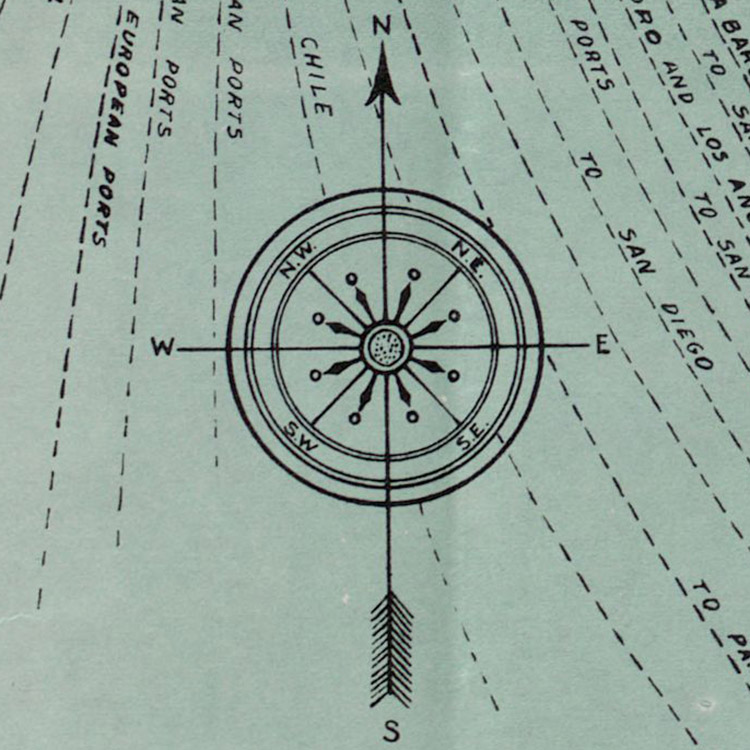
compass: A compass on a map, sometimes called a compass rose, is a symbol that helps us figure out which way the map is pointing, or what direction is at the top and bottom of the map, etc. Often the only direction labeled or indicated is north, and we have to figure out the rest ourselves. North is NOT always at the top!
date: Knowing when a map was made and when the information used to make it was collected is key to understanding what it is telling the viewer and how reliable it is.
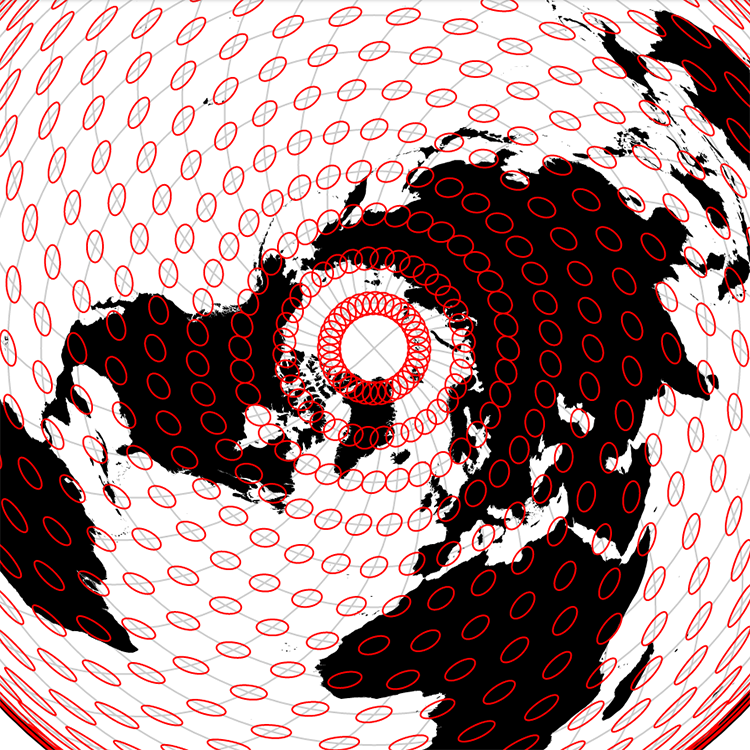
distortion: Because there is no way to take the fullness of the world and capture everything about it in a map, there is no map that is completely accurate. All maps are distorted, showing a twist on reality instead of what the world is really like.
generalization: A map that shows every detail of the physical world would have to be as big as the earth itself! So maps generalize—they shrink and stretch the world or parts of the world to different sizes, focusing on different things. They leave some things out and emphasize others. This is called the process of generalization.
geographic information systems (GIS): GIS mapping is any kind of mapmaking that takes information and turns it into a map using a computer program or application. The information (data) is most often collected into a spreadsheet, and then the computer application creates a map-based visualization (a picture) out of it so we can see the information linked to places.
geospatial data: To make maps that show information, we need information about where things are, not just what things there are or how many there are. Geospatial data is information linked to location.
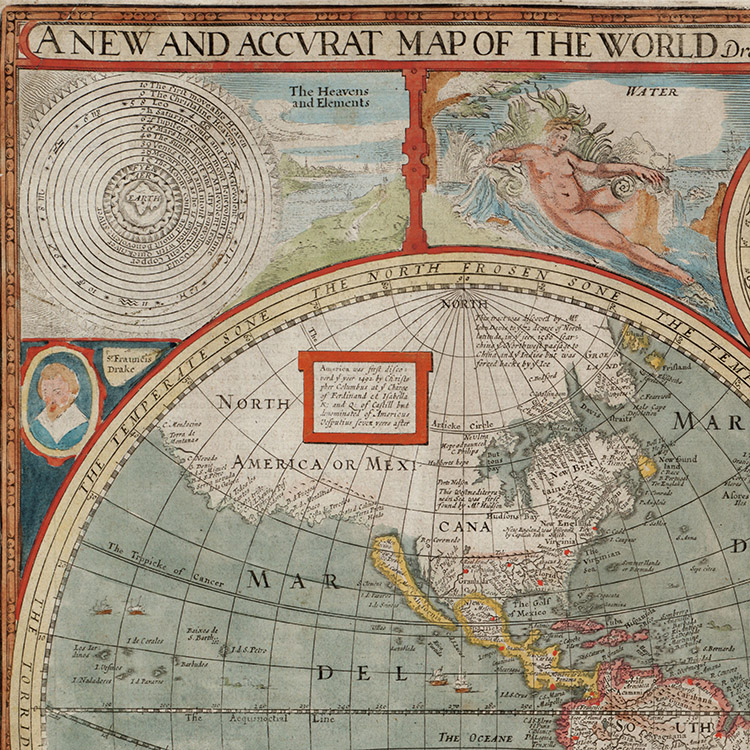
illustrations: Mapmakers sometimes put pictures on their maps to help tell their stories. Sometimes the illustrations help us figure out what the map is about, and sometimes they help us see something about the values of the mapmaker. Some maps are considered to be works of art because of their illustrations.
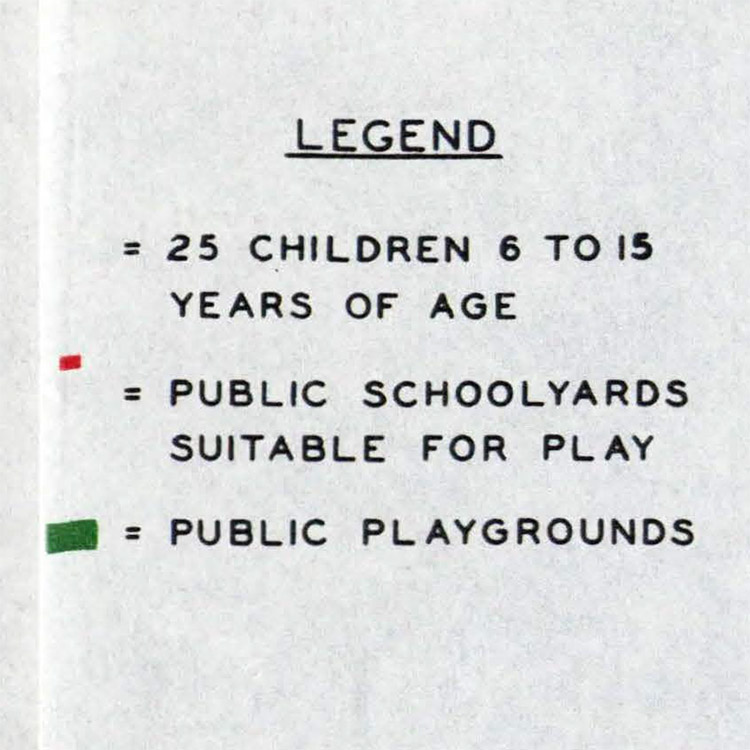
key or legend: A map key, also called a legend, is the part of a map that explains what the symbols, colors or codes on a map mean. It helps us make sense of the map. On older maps the key or legend may be called the explanation or reference.
projection: The process of showing the round globe on a flat surface is called a projection. It is impossible to show round, three-dimensional Earth on a flat map without some kind of distortion. Some areas might get stretched or squished. There might be some gaps. Some distances might seem off. But that doesn’t mean a map is wrong. It’s just the nature of projections, and there are many different kinds.
purpose: A map viewer trying to understand a map needs to try and identify the map’s purpose. How did the mapmaker think the map would be used? Is the purpose of the map to entertain a wealthy map collector? Is the purpose of the map to correct historical maps that leave out evidence of where Native people lived? Is the purpose of the map to inform school officials about what school bus routes are too long? Even maps that seem to be straightforward without much of a story behind them have an intended purpose. To be able to evaluate a map for ourselves, we have to consider what we think its purpose is.
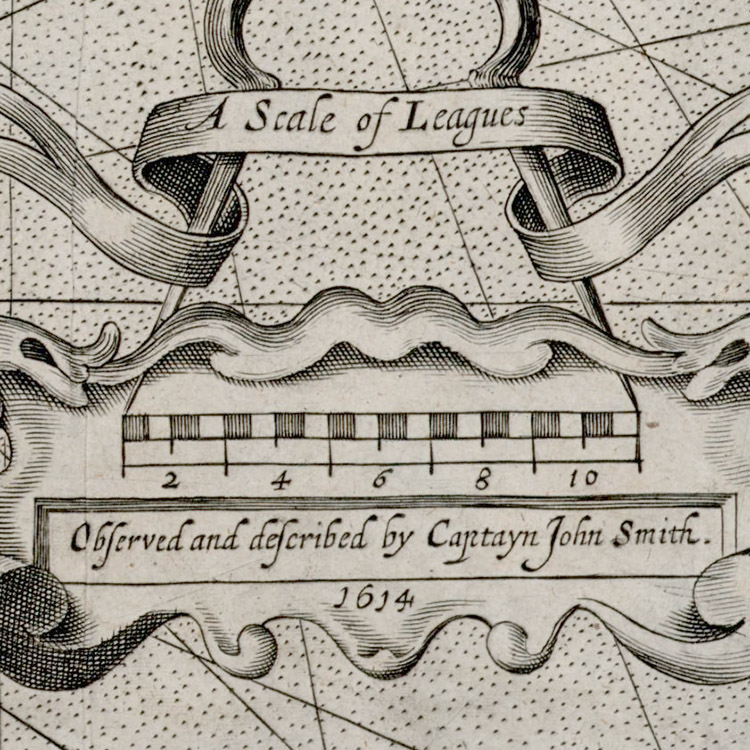
scale/size: Sometimes a cartographer will put a scale on a map to help us understand how big the area is that we’re looking at. It might look like a ruler or a ratio. But the idea of scale in mapping is more than just a helpful tool on a map. Scale is the size of the area on a map in comparison to the real world. World maps that fit on a table or a computer screen have to be very small compared to the original thing, so we call them small-scale maps. They show very large areas. The map of a city block is called a large-scale map, and it shows a smaller area with greater detail (even though it’s still smaller than in real life!). Mapmakers also adjust the sizes of symbols and words to emphasize certain things and hide others. Paying attention to the sizes of things on a map can tell you a lot about its purpose and what the mapmakers wants you to think about.
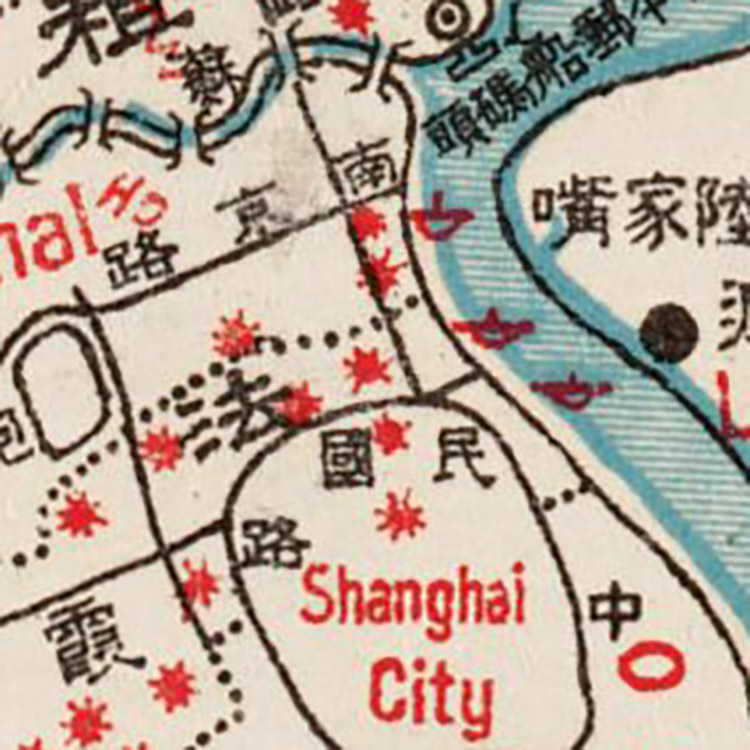
symbol: Mapmakers use symbols on maps to stand in for all kinds of information. Physical features might be shown with lines standing in for roads and dots for cities. The way land is used might be marked with little pictures of pine trees or tents to show national parks. A map about current events might use arrows to show the paths of human migration from place to place. Often there will be a key or legend to explain the symbols, but not always.
symbology: The way cartographers choose to show the information on their maps is called symbology. It includes what symbols they use and what size they are. It also includes their choices of color for different purposes.
text/words: Maps have words on them. We see them in titles and legends, but they are often used to add additional explanations or to tell us more about the map's message. Words are as important as symbols, so don’t forget to read them.
title: Like the headline on a news article, a map’s title tells you what the mapmaker wants you to think the map is about. It may tell you the area a map covers, like a map titled “Massachusetts.” Or it may tell you more about the map’s story, like a map titled “Children and Playgrounds in Boston.” Always check the title to see what the intention of the mapmaker is.
visualization: A map is a kind of visualization (a picture) of a real thing, our world. But because our world is so many different things to so many different people, there are infinite ways to visualize it. Like graphs and diagrams, maps are a way to take some information and present it visually—though there are maps made of sound and maps made for people who understand things by touch instead of sight.