A digital map of demographics
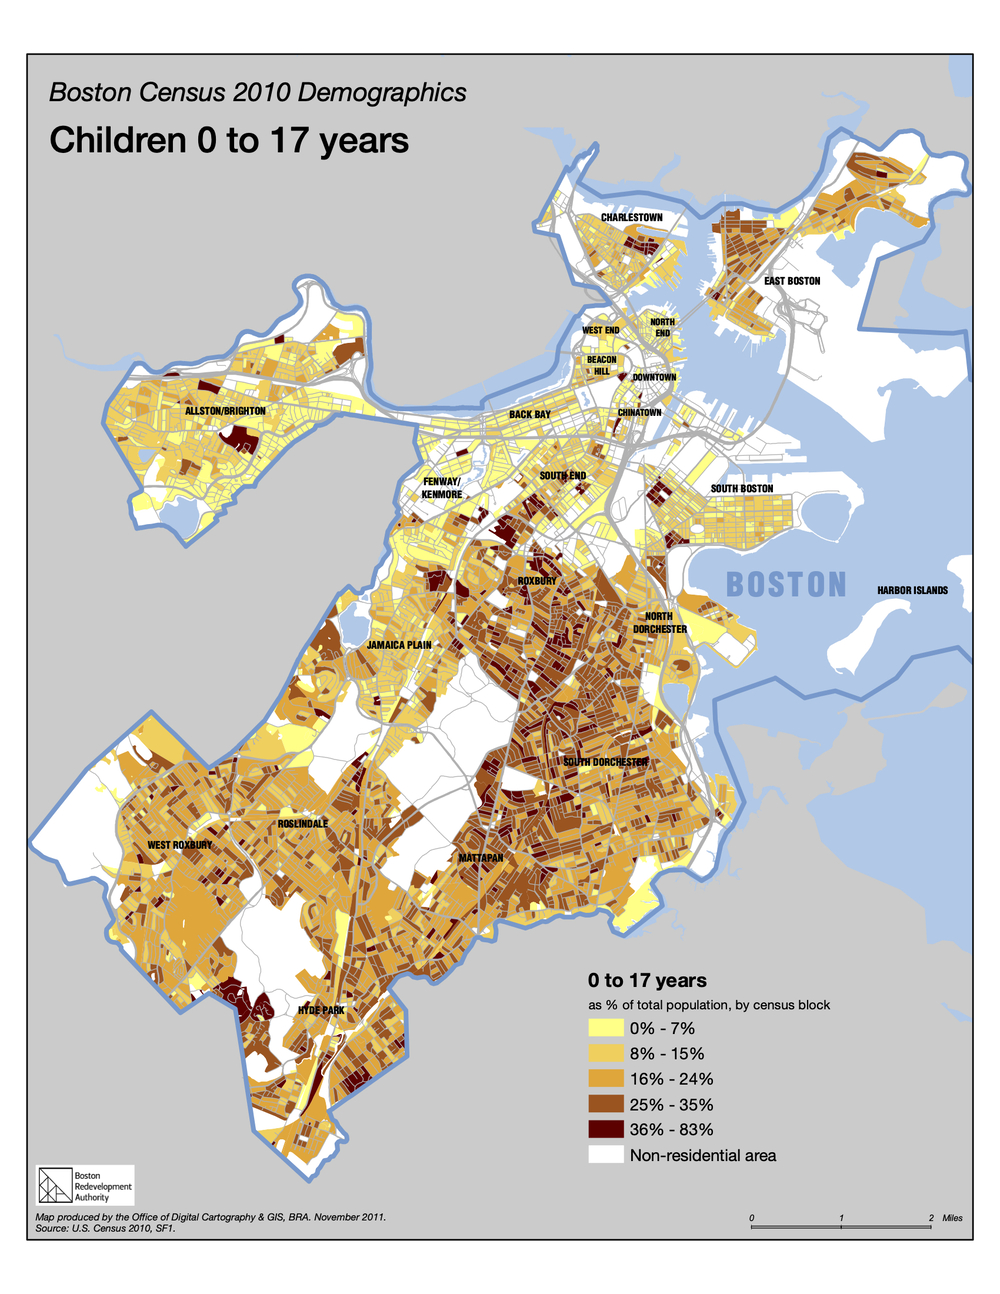
| Title | Boston Census 2010 Demographics: Children 0 to 17 Years |
| Creator | Boston Redevelopment Authority |
| Year | 2011 |
This map was made with a computer, as most maps are today. Mapmakers who use geospatial data to make maps with computers are using GIS: geographic information systems—digital methods that can turn information about amounts of things into maps.
This map from the Boston Planning and Development Agency is called a choropleth map. It shows information about where there is more or less of something by using a range of colors in different areas. The choice of what colors to use is one aspect of a map’s symbology. In this case the little areas colored in on the map are census tracts, boundaries drawn by the Census Bureau to try and identify areas with similar amounts of people in them in order to compare.
Look closely at the map’s title and legend. The word “demographics” (literally drawing or writing the population) means information about people.
What group of people is being explored on this map?
What do the darkest and lightest areas show us? What do you think the white areas might be?
When was this map made? In what way might the map have been useful when it was made? What might its purpose have been? In what ways is the information on the map useful for us today?
All map makers have to decide what to show and what to leave out. For example, this mapmaker decided to include a scale that helps us measure distances, but not a compass to help us figure out directions.
What else doesn’t this map tell us? How might it not tell the whole story about kids in Boston