This Cartography Challenge has closed. Charles Lyu's winning map will soon be published in LMEC's digital collections. In the meantime, read our article about both winning maps, including one from young cartographer Alessandro Navarro Gatti. Check back soon for more information about LMEC's next Cartography Challenge.
Topic: Transportation Dreams
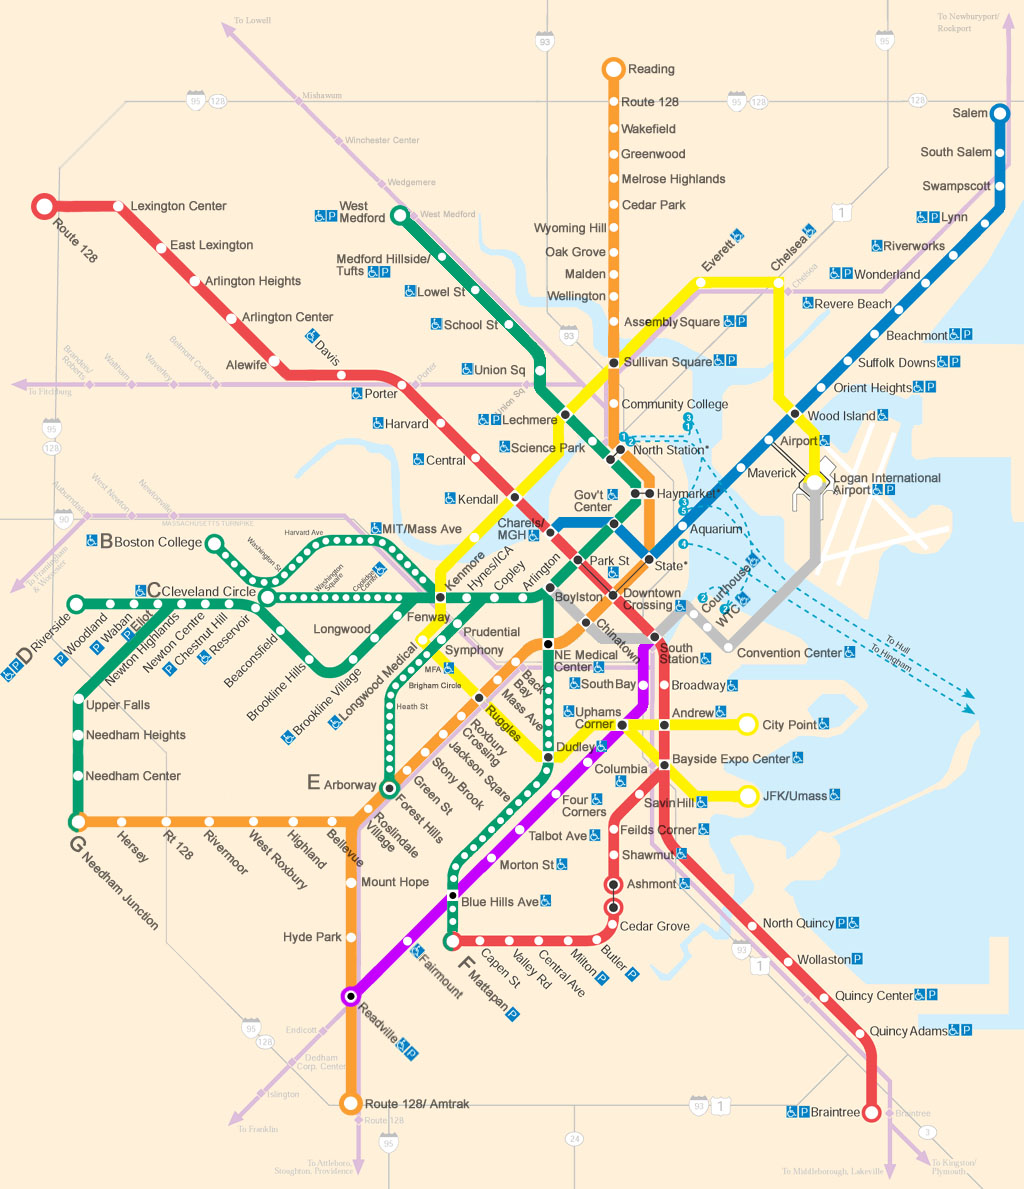
A speculative MBTA map by Andrew Lynch.
Do you ever dream of a better public transit system here in the U.S.? If so, you're not alone: over the past few years, imaginary maps of public transit systems have appeared all over the internet, garnering coverage in national magazines like Wired and Vox.
This speculative map of the MBTA, for example, imagines a system of transit in Boston where every line stretches to Route 128. At r/imaginarysubwaymaps, users share fictional rail networks for their own cities and towns, while the community at r/TransitDiagrams discusses the pros and cons of rapid transit networks across the world (many of their posts focus specifically on the Boston metro area). Elsewhere, an imaginary U.S. high-speed rail network map from 2013 routinely circulates in viral social media posts.
Even if these maps are not always practical---indeed, it's unclear how the red line of the U.S. high-speed rail map would carve through the mighty Rocky Mountains---they reflect a growing effort among people and cities to imagine more environmentally friendly, climate conscious, and accessible systems of getting around.
Challenge: Speculative Maps of Transit in Boston
At the Leventhal Center, we've been thinking a lot about public transit lately. Our current exhibition, Getting Around Town, explores the 400-year history of Boston's public transit systems. We believe that by documenting how the urban system of public transit has transformed over the last four centuries, we can better understand some of the challenges that it faces today.
In this Cartography Challenge, we're looking for speculative maps of transit in Boston. From the unreal to the unrealized, we want to see what you can dream up.
Will you create a public transit system perfectly tailored to your personal everyday geographies? What about a reimagined rail network that uses Climate Ready Boston data to account for varying levels of storm surge and sea level rise? Perhaps you'll show us an MBTA diagram that's all ferries and canals, or a bird's eye view of Boston's regional transit network in 2123. Maybe you want to use the LMEC's historic Boston shoreline dataset to imagine what Boston's transit system would look like if no new land had ever been created across the city.
Anything is on the table---all of these, and more---so long as whatever you map doesn't exist right now!
Data: Anything Boston-focused!
To participate in this challenge, your map must depict a speculative or imaginary transit system of the greater Boston area. You are free to interpret this however you like, but your spatial data should land roughly within the bounds of the MBTA's commuter rail system.
In order to really respond to the prompt, we imagine that you'll need to create some kind of dataset yourself. We would love to accession and host any data created for the winning map on our Public Data Portal.
Evaluation
Submissions will be evaluated according to these five criteria:
Topicality: Does the submission creatively engage with the topic?
Data integrity: Does the submission use the correct dataset and include other appropriate information? Has the data been appropriately represented within the confines of the story that the map is telling?
Challenge creativity: How has the submission responded to the Challenge prompt?
Cartographic design: Does the submission follow reasonable design principles, or perhaps break with them in generative, exciting ways? Does the submission follow best practices in accessible design (e.g., colorblind readability)?
Educational capacity: Is the submission visually engaging for a wide range of learners from grade-school children to adults? Can it be effectively used in teaching and public education, especially for K-12 students?
An application consists of the following material submitted by Tuesday, December 19, 2023 at 10pm ET:
One still (static) map that appropriately responds to the present submission cycle's topic, data, and challenge themes
The work should have a resolution of at least 300 dpi, and its print dimensions should be no smaller than 11 inches on the shorter side, and no larger than 30 inches on the longer side (uploads or URLs in TIFF format)
If not already present in the map, a short technical statement of not more than 300 words describing the workflow used to create the map and a data bibliography
An indication of whether you would like your submission to be considered for accession into the LMEC's Digital Collections and licensed under a Creative Commons CC-0 or CC-BY 4.0 copyright (the LMEC reserves the right to request changes to submissions before they are accessioned into collections)
Don't hesitate to reach out to us if you have any questions about the submission process. Applicants will be notified with results by January 19, 2024.