We’re excited to introduce our newest staff members, Alex Ferguson and Shaolong (Carlos) Yin, both of whom are working this spring as Northeastern Co-ops. Alex joins us as Gallery & Visitor Services Assistant, while Carlos works as Geohumanities & GIS Assistant. We sat down with them to learn more about their interests and what they've been getting up to this spring at the Leventhal Center.
Tell us a little bit about yourselves. What are you studying at Northeastern, and what made you interested in working at LMEC?
Alex Ferguson: I was partially raised in the MetroWest suburbs of Boston, but I’ve been living in Cambridge and Boston since I can remember. I was fortunate to grow up with two librarians in my life, who instilled in me an early love of reading and motivation toward knowledge. After a brief stint at the University of Vermont, I started studying International Affairs and Data Science at Northeastern. My concentration is in Southwest Asia and North Africa, specifically the Arab world, and I’ve been lucky enough to go on trips to Morocco and Egypt to practice Arabic.
Carlos Yin: I am currently a graduate student in World History at Northeastern University, working at the intersection of historical research and digital humanities, with a focus on spatial history and historical geography. My work explores how large-scale processes such as migration, empire, and urban transformation are experienced and represented through specific places. My connection to the Leventhal Map & Education Center began in spring 2025, when I took a course here. That experience encouraged me to think of maps as forms of argument that shape how we understand history. LMEC stood out as a place where these ideas are both studied and shared with the public, which is why I wanted to be part of it.
What's a map—or other cartographic object in LMEC's collections—that has really piqued your interest so far?
![The unique map of California [1885?]](https://iiif.digitalcommonwealth.org/iiif/2/commonwealth:4m90fc26z/full/1200,/0/default.jpg)
The unique map of California, published around 1885
AF: It’s hard for me to pick a single favorite, but the accurately-titled “Unique Map of California” is pretty special. Created at a time when the state had fewer than a million residents, it’s a good example of a "promotional map" created to encourage migration and economic investment. It shows a combination of counties and their exports; characteristics like elevation, average temperature and rainfall, soil types; and even a size comparison to other states including Massachusetts. Not only is all this information packed into a single page, but the cartographer also includes several beautiful etchings of the natural scenery to further encourage viewers to move to California.
As a typography and calligraphy enthusiast, I’m also enamored by the font variety and hand-lettering on display here.
CY: One object that has stayed with me is the Honan (Henan) sheet from the Atlas of Chinese Empire (1908), published by Edward Stanford. Although the atlas was originally produced to mark Protestant mission stations, it also preserves, almost incidentally, a remarkably complete picture of the empire on the eve of the Qing dynasty’s collapse.

“Honan,” from the Atlas of the Chinese Empire
The Honan section was compiled by G. Whitfield Guinness, a missionary of the China Inland Mission and the son of Henry Grattan Guinness. It captures a regional structure before the political ruptures of the twentieth century, before revolution, war, and repeated cycles of reconstruction reshaped both the landscape and its administrative logic. Along the Yellow River corridor, older administrative centers begin to lose relative centrality as transport networks and resource extraction reshape the region. If one follows the railway lines linking Kaifeng, Chengchow (Zhengzhou) and Sinsiang (Xinxiang), a shift in regional hierarchy becomes visible. At the same time, Hwaiking Fu (Huaiqing Prefecture) and the coal-producing area around Jiaozuo are drawn into this emerging system, where new nodes formed around rail and mining start to challenge long-established centers.
What makes this encounter more complex for me is that this is also where I am from. Now in Boston, working at LMEC, I find myself looking at my home as it existed more than a century ago, just before it entered the Republican era. There is something quietly striking about that recognition. It reshapes how I think about “home.” It is not simply where one is, but something one sometimes finds only after traveling a long distance, across space and across time. Here, in a map, I found my way back to it.
Do you have a favorite map from somewhere else in your life, perhaps one that highlights your personal relationship to geography and cartography?
AF: I’ve been interested in maps, flags, and the world at large since I was young. Whenever my family would go on road trips, we’d order the free AAA road maps of all the states we’d travel through on the way. I remember spending hours in the backseat slowly tracking our progress in pencil and learning the names of the towns we passed on the highway.
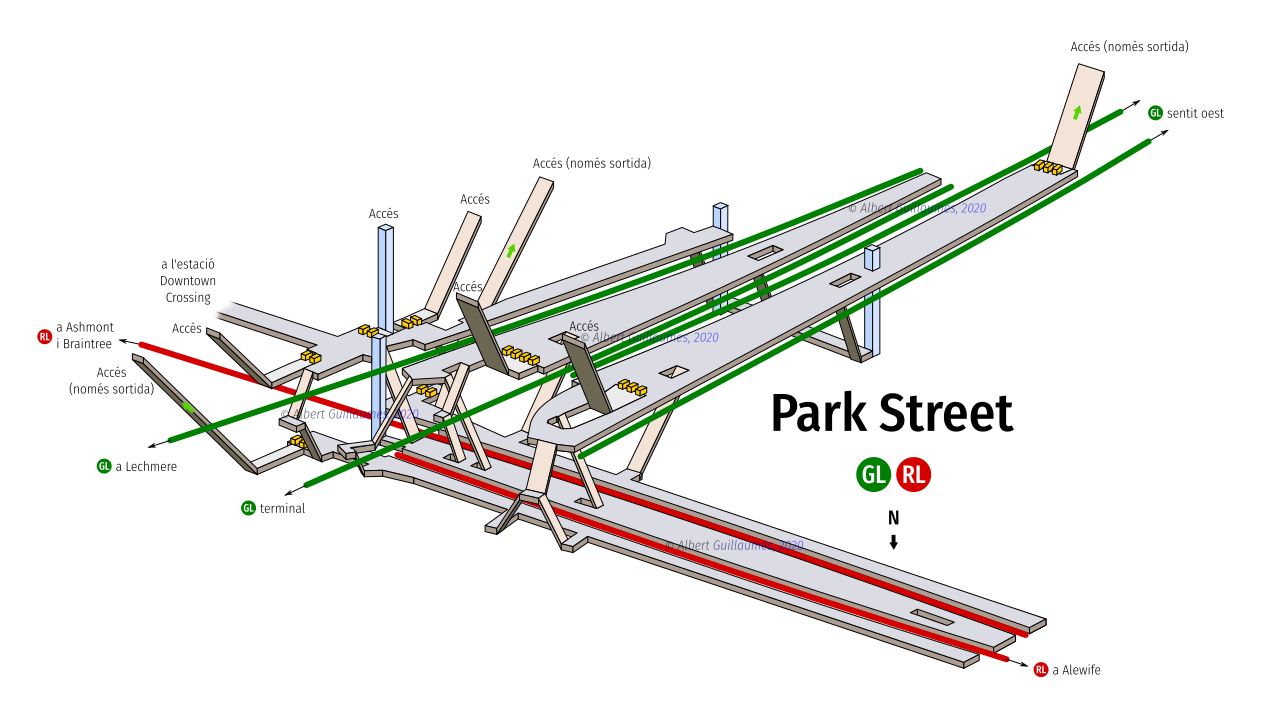
Marcer's diagram of Park Street Station
I’m also a big fan of Albert Guillaumes Marcer’s maps, which show the layouts of subway stations in Boston and many other cities. Not only have they helped me discover shortcuts I had never known about, but they also do a good job of visualizing how Boston’s transit history has resulted in lots of weird stations and convoluted transfers. My favorite ones to look at are the huge labyrinthine layouts of larger stations like Nation in Paris or Sol / Gran Vía in Madrid.
CY: One of my favorite maps comes from much earlier in my studies. When I first began studying history as an undergraduate, one of my professors emphasized that we should always read history alongside maps, especially when working on regions we were not familiar with. As part of that training, I needed to hand-draw maps based on a Atlas of the Medieval World by Rosamond McKitterick. I traced the development of the Frankish world, from the Merovingian kingdoms, to the expansion of the Carolingians under Charlemagne, and finally to the division of empire after the Treaty of Verdun.
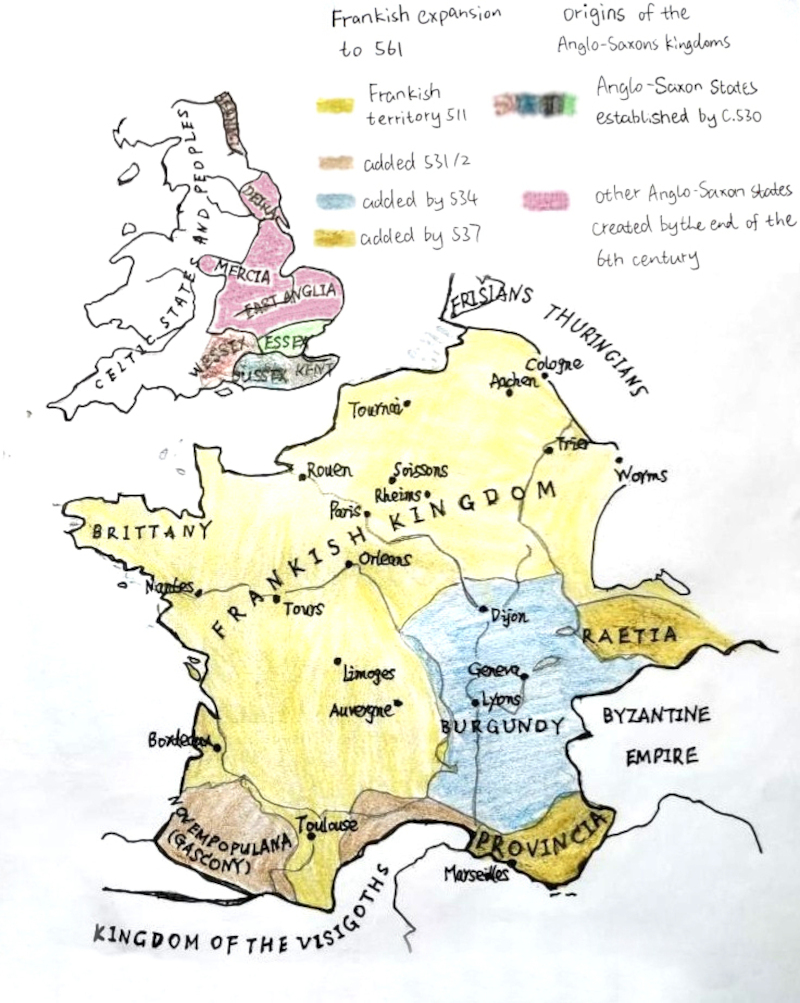
"The Frankish Kingdoms under the Merovingians," from Rosamond McKitterick's Atlas of the Medieval World (2005, 26), redrawn by Shaolong Yin
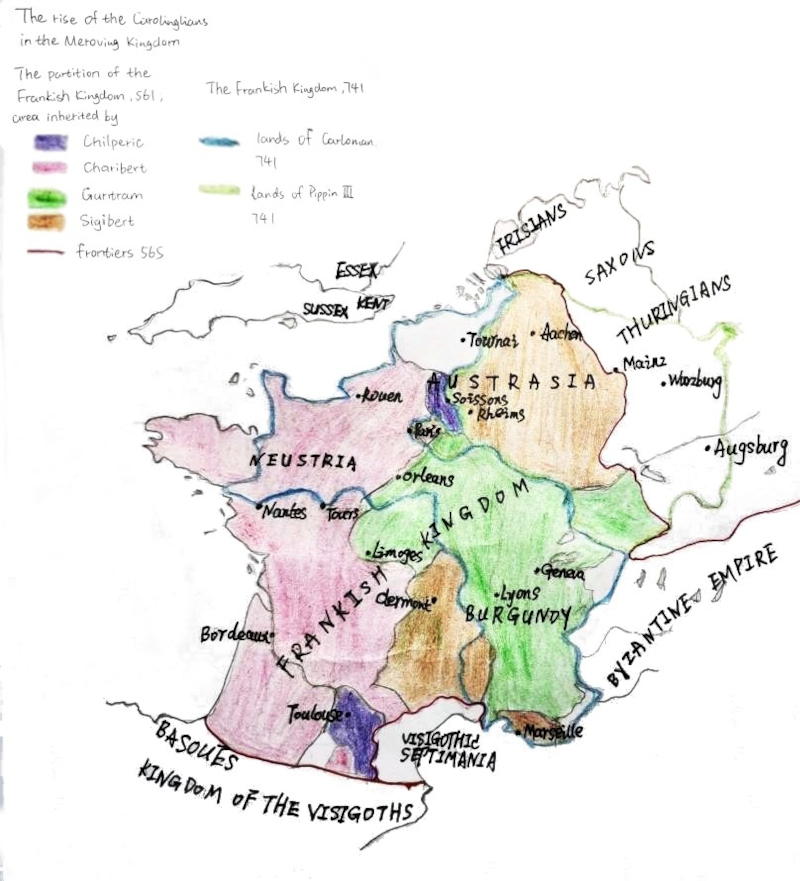
"The Rise of the Carolingians in the Merovingian Kingdom," from Rosamond McKitterick's Atlas of the Medieval World (2005, 33), redrawn by Shaolong Yin
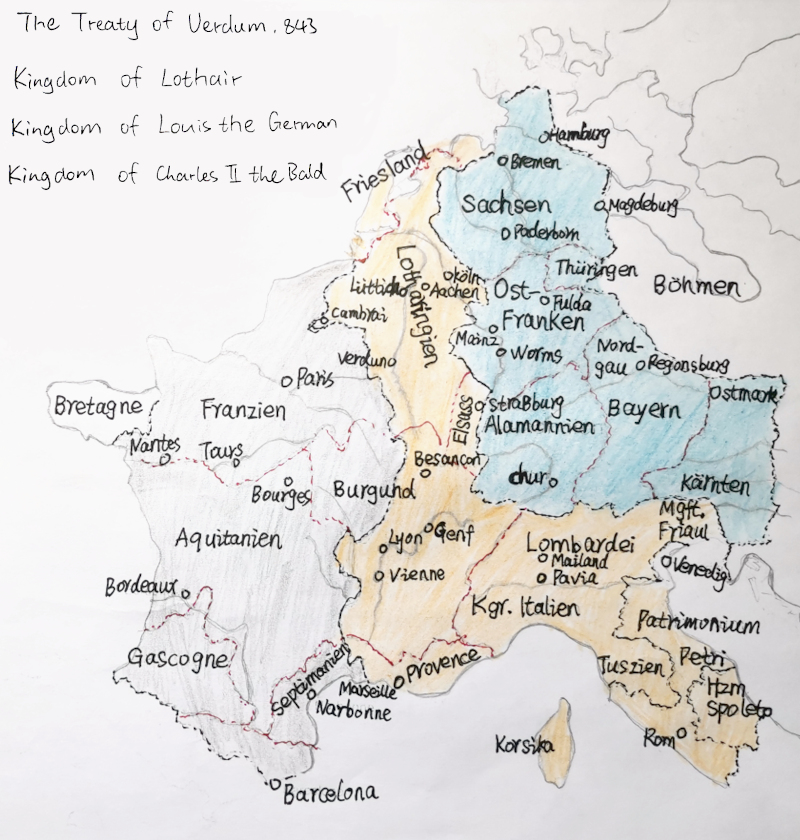
"The Treaty of Verdun, 843," from Rosamond McKitterick's Atlas of the Medieval World (2005, 41), redrawn by Shaolong Yin
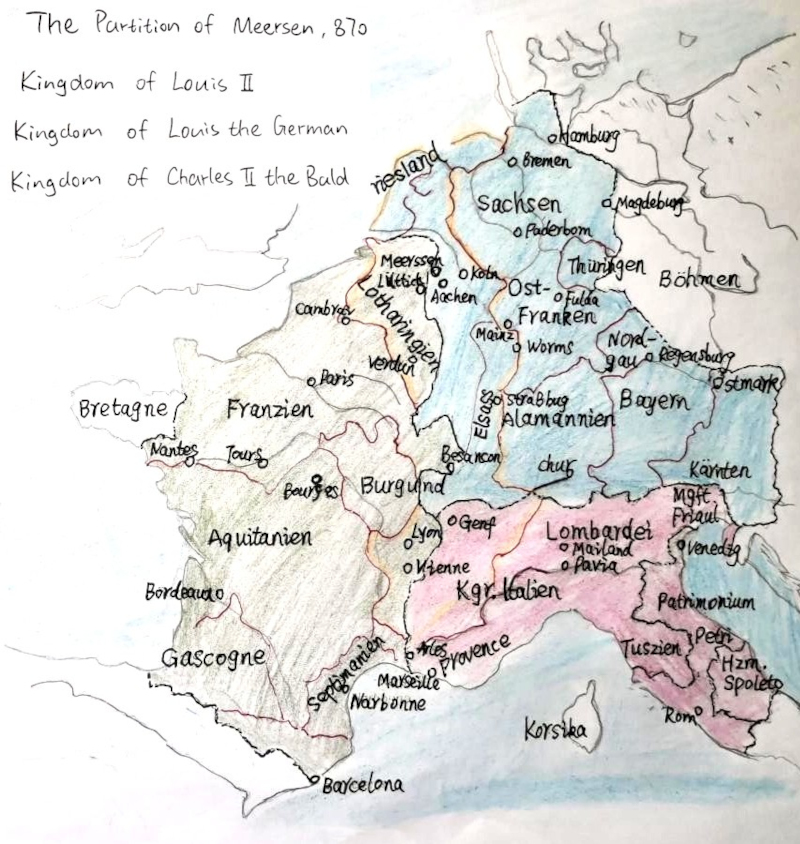
"The Partition of Meersen, 870," from Rosamond McKitterick's Atlas of the Medieval World (2005, 41), redrawn by Shaolong Yin
Drawing these maps was less about artistic accuracy than about understanding how space structures history. Reproducing them by hand helped me think about shifting borders and changing centers in a way that reading alone could not. Looking back, that experience was incredibly valuable and sparked my interest in historical geography.
We're about halfway through your Co-op. What are you looking most forward to working on during your remaining time at the Leventhal Center?
AF: I’m excited to gain more experience with georeferencing and GIS, especially considering most of the maps I work with are of local areas that are familiar to me!
Besides that, I’m also very appreciative of the opportunity to work for the BPL and contribute to one of the greatest publicly accessible resources in the city. So far I’ve really enjoyed seeing how different people choose to use this space and how genuinely appreciative people are that we’re here. It’s also been great to talk to patrons who are visiting Boston for the first time—I love sharing enthusiasm for my hometown and suggesting places that show tourists a different side of the city.
CY: What I am most looking forward to is exploring new tools and methods, particularly in digital humanities. Training in history does not always include tools like Python or QGIS, so this is a valuable opportunity to develop those skills and expand the methodological possibilities of historical research. It also offers a way to deepen existing projects by incorporating spatial analysis and extending their analytical scope.
At the same time, working with the Boston Public Library’s collections, such as maps and archival materials, makes it possible to begin building a more structured workflow for approaching historical-geographical questions.
I am also interested in understanding how exhibitions are developed, from planning to implementation, as well as in gaining experience with gallery and front desk work. Participating in curatorial activities provides a way to see how research can be translated into public-facing forms, and how connections between academic work and broader audiences can be made more effectively.
When you’re giving a tour of the Center’s gallery, what aspects of the exhibitions have you been most excited to share with patrons?
AF: I love going on small tangents about local New England history, especially some of the more human or funny moments that make the past feel more relatable. My favorite story is about the "Southwick Jog," a little part of Western Massachusetts that awkwardly juts into Connecticut. Local legends might claim that the cartographers were drunk when drawing the line or that the notch is to keep Massachusetts from sliding into the ocean, but I think the real story is even better.
Two surveyors were sent to survey the state’s southern border in 1642, which was defined as starting “three miles south of the southernmost branch of the Charles River.” Instead of trekking a straight line through the dense woods of Worcester County, the mappers decided to take a latitude reading at the start point, sail around Cape Cod and up the Connecticut River, then set the endpoint at the same measurement. Long story short, their second measurement was too far south, meaning that Massachusetts now claimed a 50-mile-long triangle of Connecticut. Almost two hundred years of dispute followed, including a contest over who could send a better monument to Britain to plead their case. In the end, Massachusetts agreed to give up the land in exchange for a small area of Connecticut south of the town of Southwick.

The "Southwick jog" on a 1990 map of wellhead protection areas in the Connecticut Valley (from LMEC's Applied Geographics, Inc. Records)
CY: When guiding visitors through the gallery, one of the most engaging moments comes from seeing familiar histories take on new meaning through maps. Boston’s role in the American Revolution is widely known, but when placed within maps that connect the city to the Atlantic world, trade routes, and imperial networks, it becomes more spatial and concrete, rather than abstract. Visitors can begin to see how a place that seems local is actually part of a much larger system.
Maps also reveal perspective. They reflect choices about what to show and what to leave out, whether emphasizing trade, military movement, or imperial claims. Looking at them closely encourages visitors to think about how people at different moments understood space and connection.
More generally, the exhibition connects individual objects to larger stories. By moving between different scales, from empire to city to specific sites, visitors can begin to see how geography shapes historical experience in ways that are not always immediately visible.
Our articles are always free
You’ll never hit a paywall or be asked to subscribe to read our free articles. No matter who you are, our articles are free to read—in class, at home, on the train, or wherever you like. In fact, you can even reuse them under a Creative Commons CC BY-ND 2.0 license.