This article is the first in an occasional series called Get to Know Your Data, where we'll be talking to the people and institutions that create, store, and share geospatial data. We'll be asking them about how they engage with the public and grapple with the social lives of the data that they manage.
Digitizing Town Corners
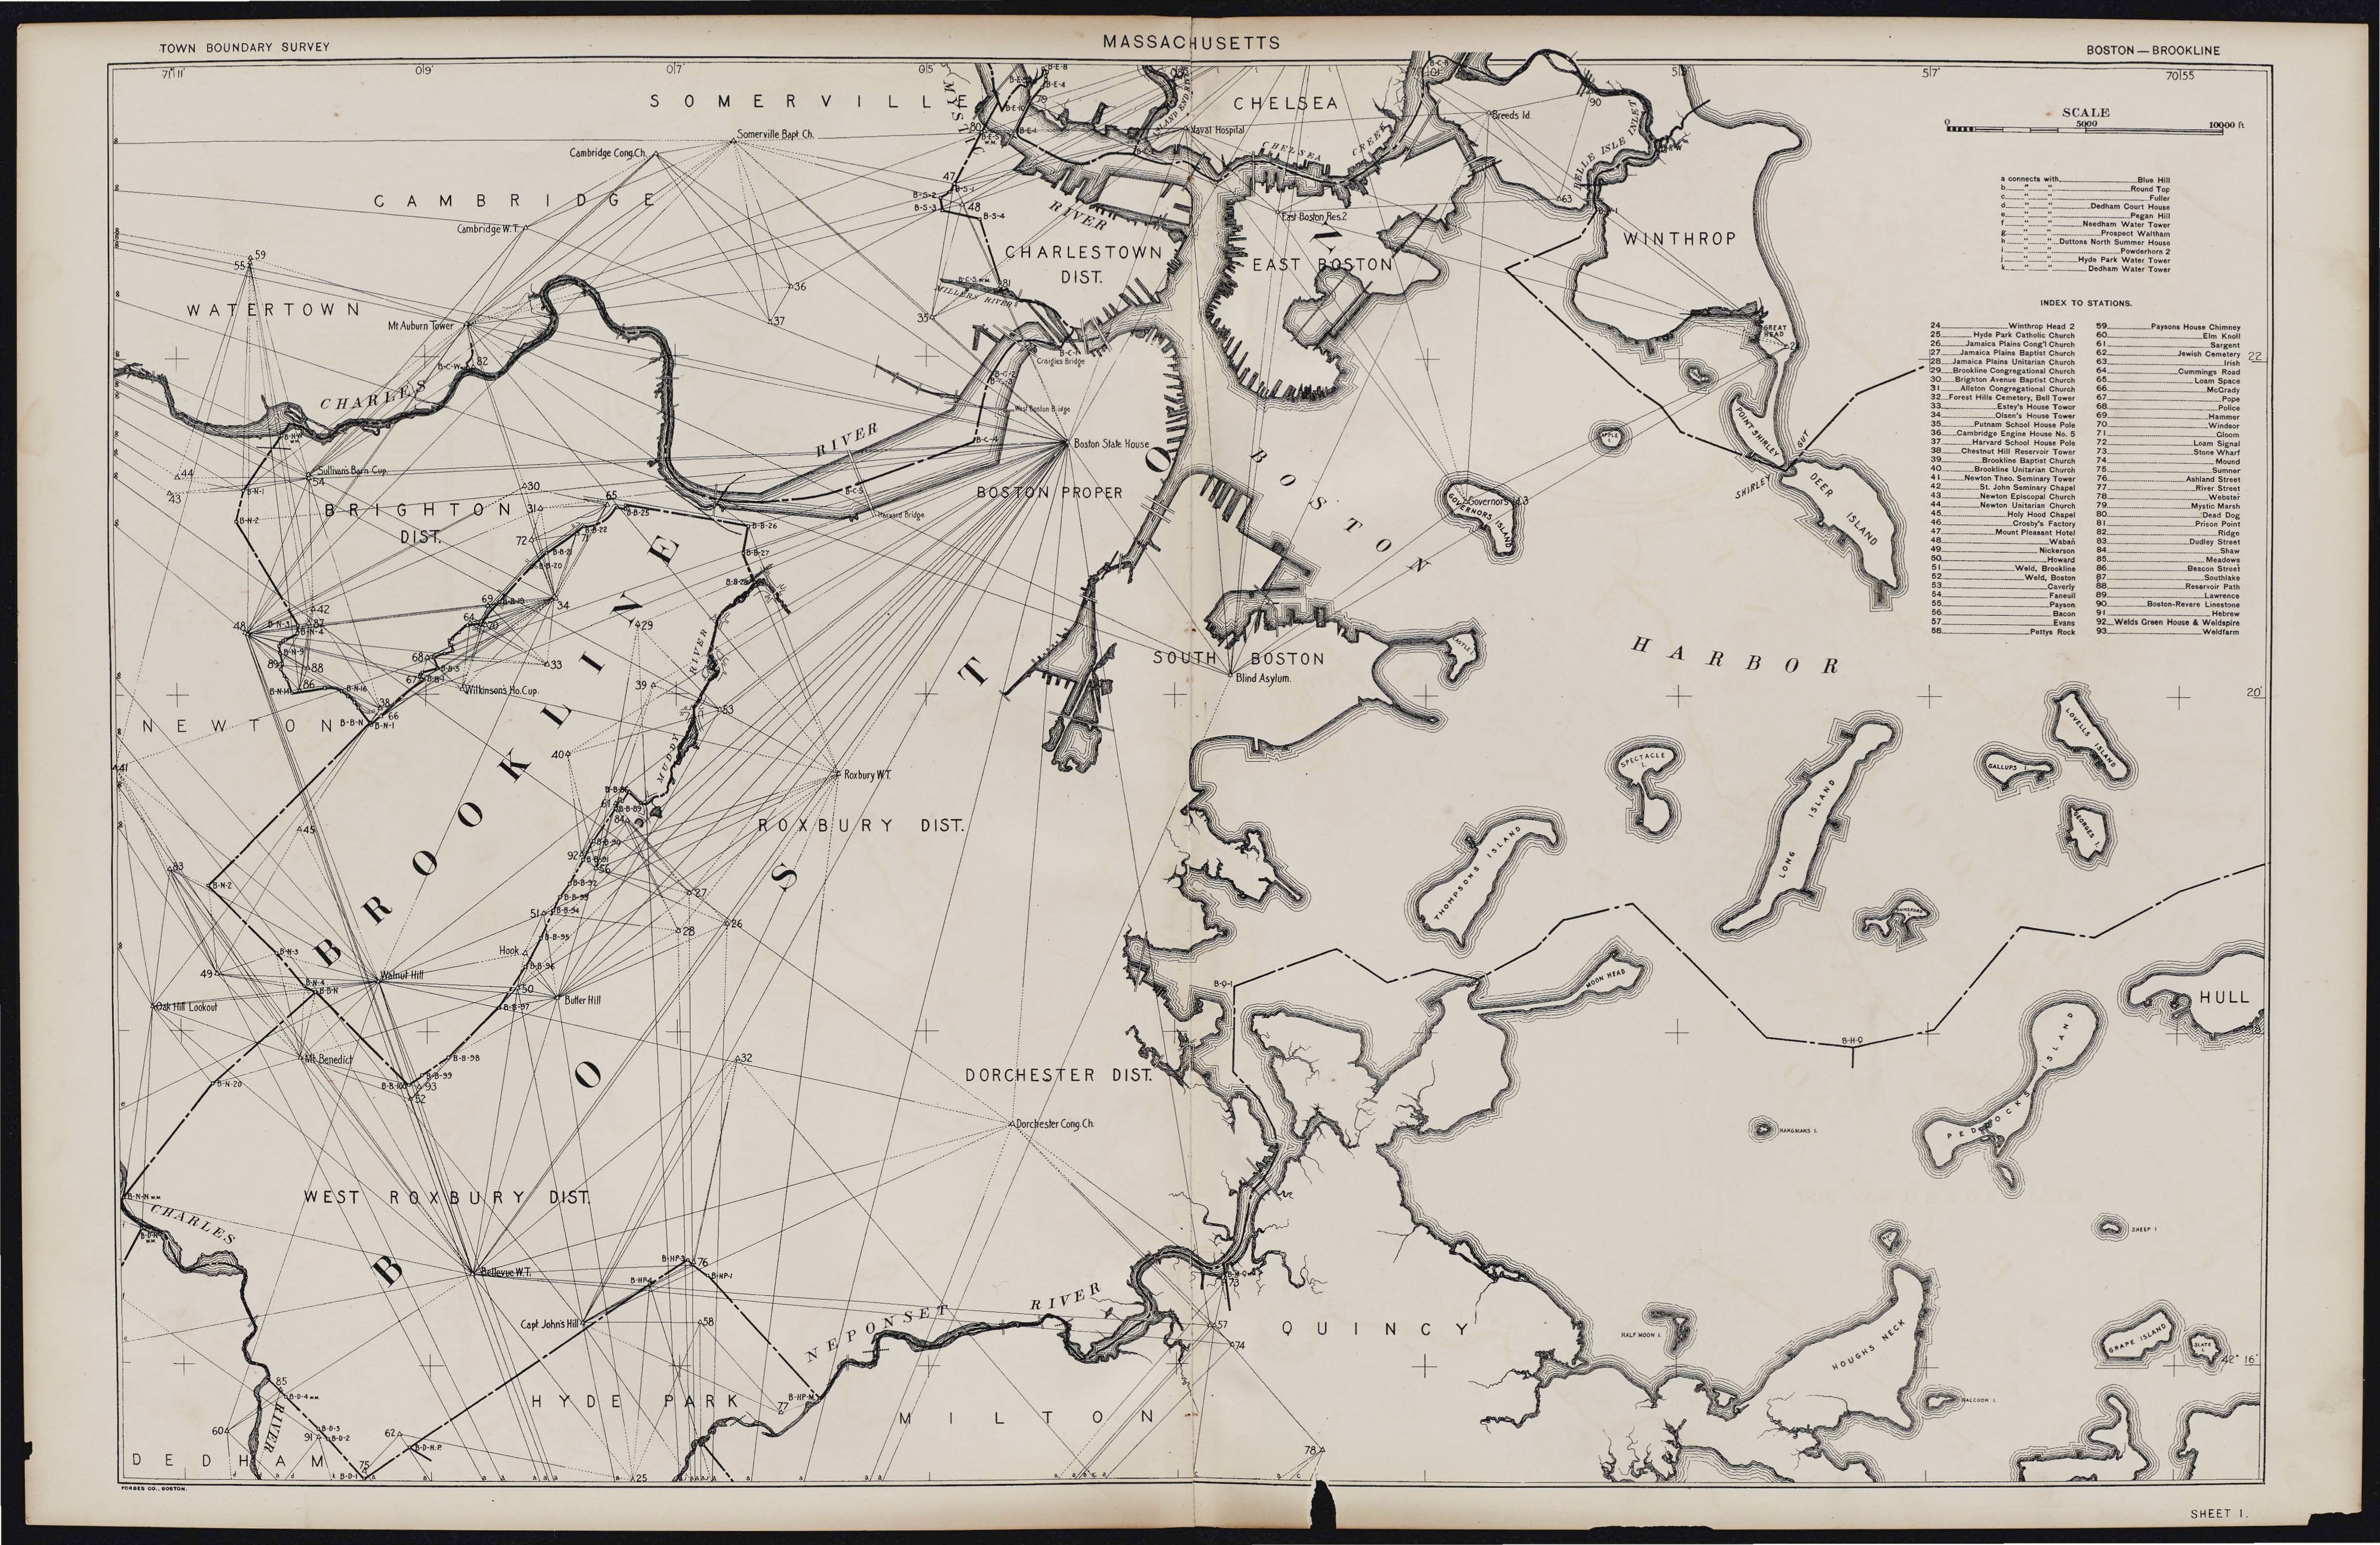
Trigonometric survey lines for Boston from the boundaries atlas
In the early twentieth century, the State of Massachusetts ordered the Topographical Survey Commission to standardize the geographic survey points which marked out the borders between municipalities. Unlike in the Midwest, where counties and townships are based on a rectangular grid survey, the lines between New England towns are defined by a connect-the-dots pattern that often references landmarks, like an old pine tree or a stone wall. The State Library has digitized many of these atlases for viewing online. (We also have some in our collections, but they haven't been digitized yet.)
Because these survey points still make up the legal definitions of cities and towns in Massachusetts, in recent years the Massachusetts Department of Transportation (MassDOT) created a dataset, intended for administrative purposes, which converted the survey points into modern GIS information, and linked to pictures of the scanned atlases.
We wanted to make this amazing link between historic maps and modern GIS data even more accessible, so we worked together with MassDOT to create a new tool for finding and using these atlases. We did some reformatting of the data, uploaded scans to our own web server, and made this interactive map of the town corners. Here, each blue dot represents a dot in the connect-the-dots definitions of each town border. Click on one to see more about that point!
New LMEC webmap to easily find any town corner
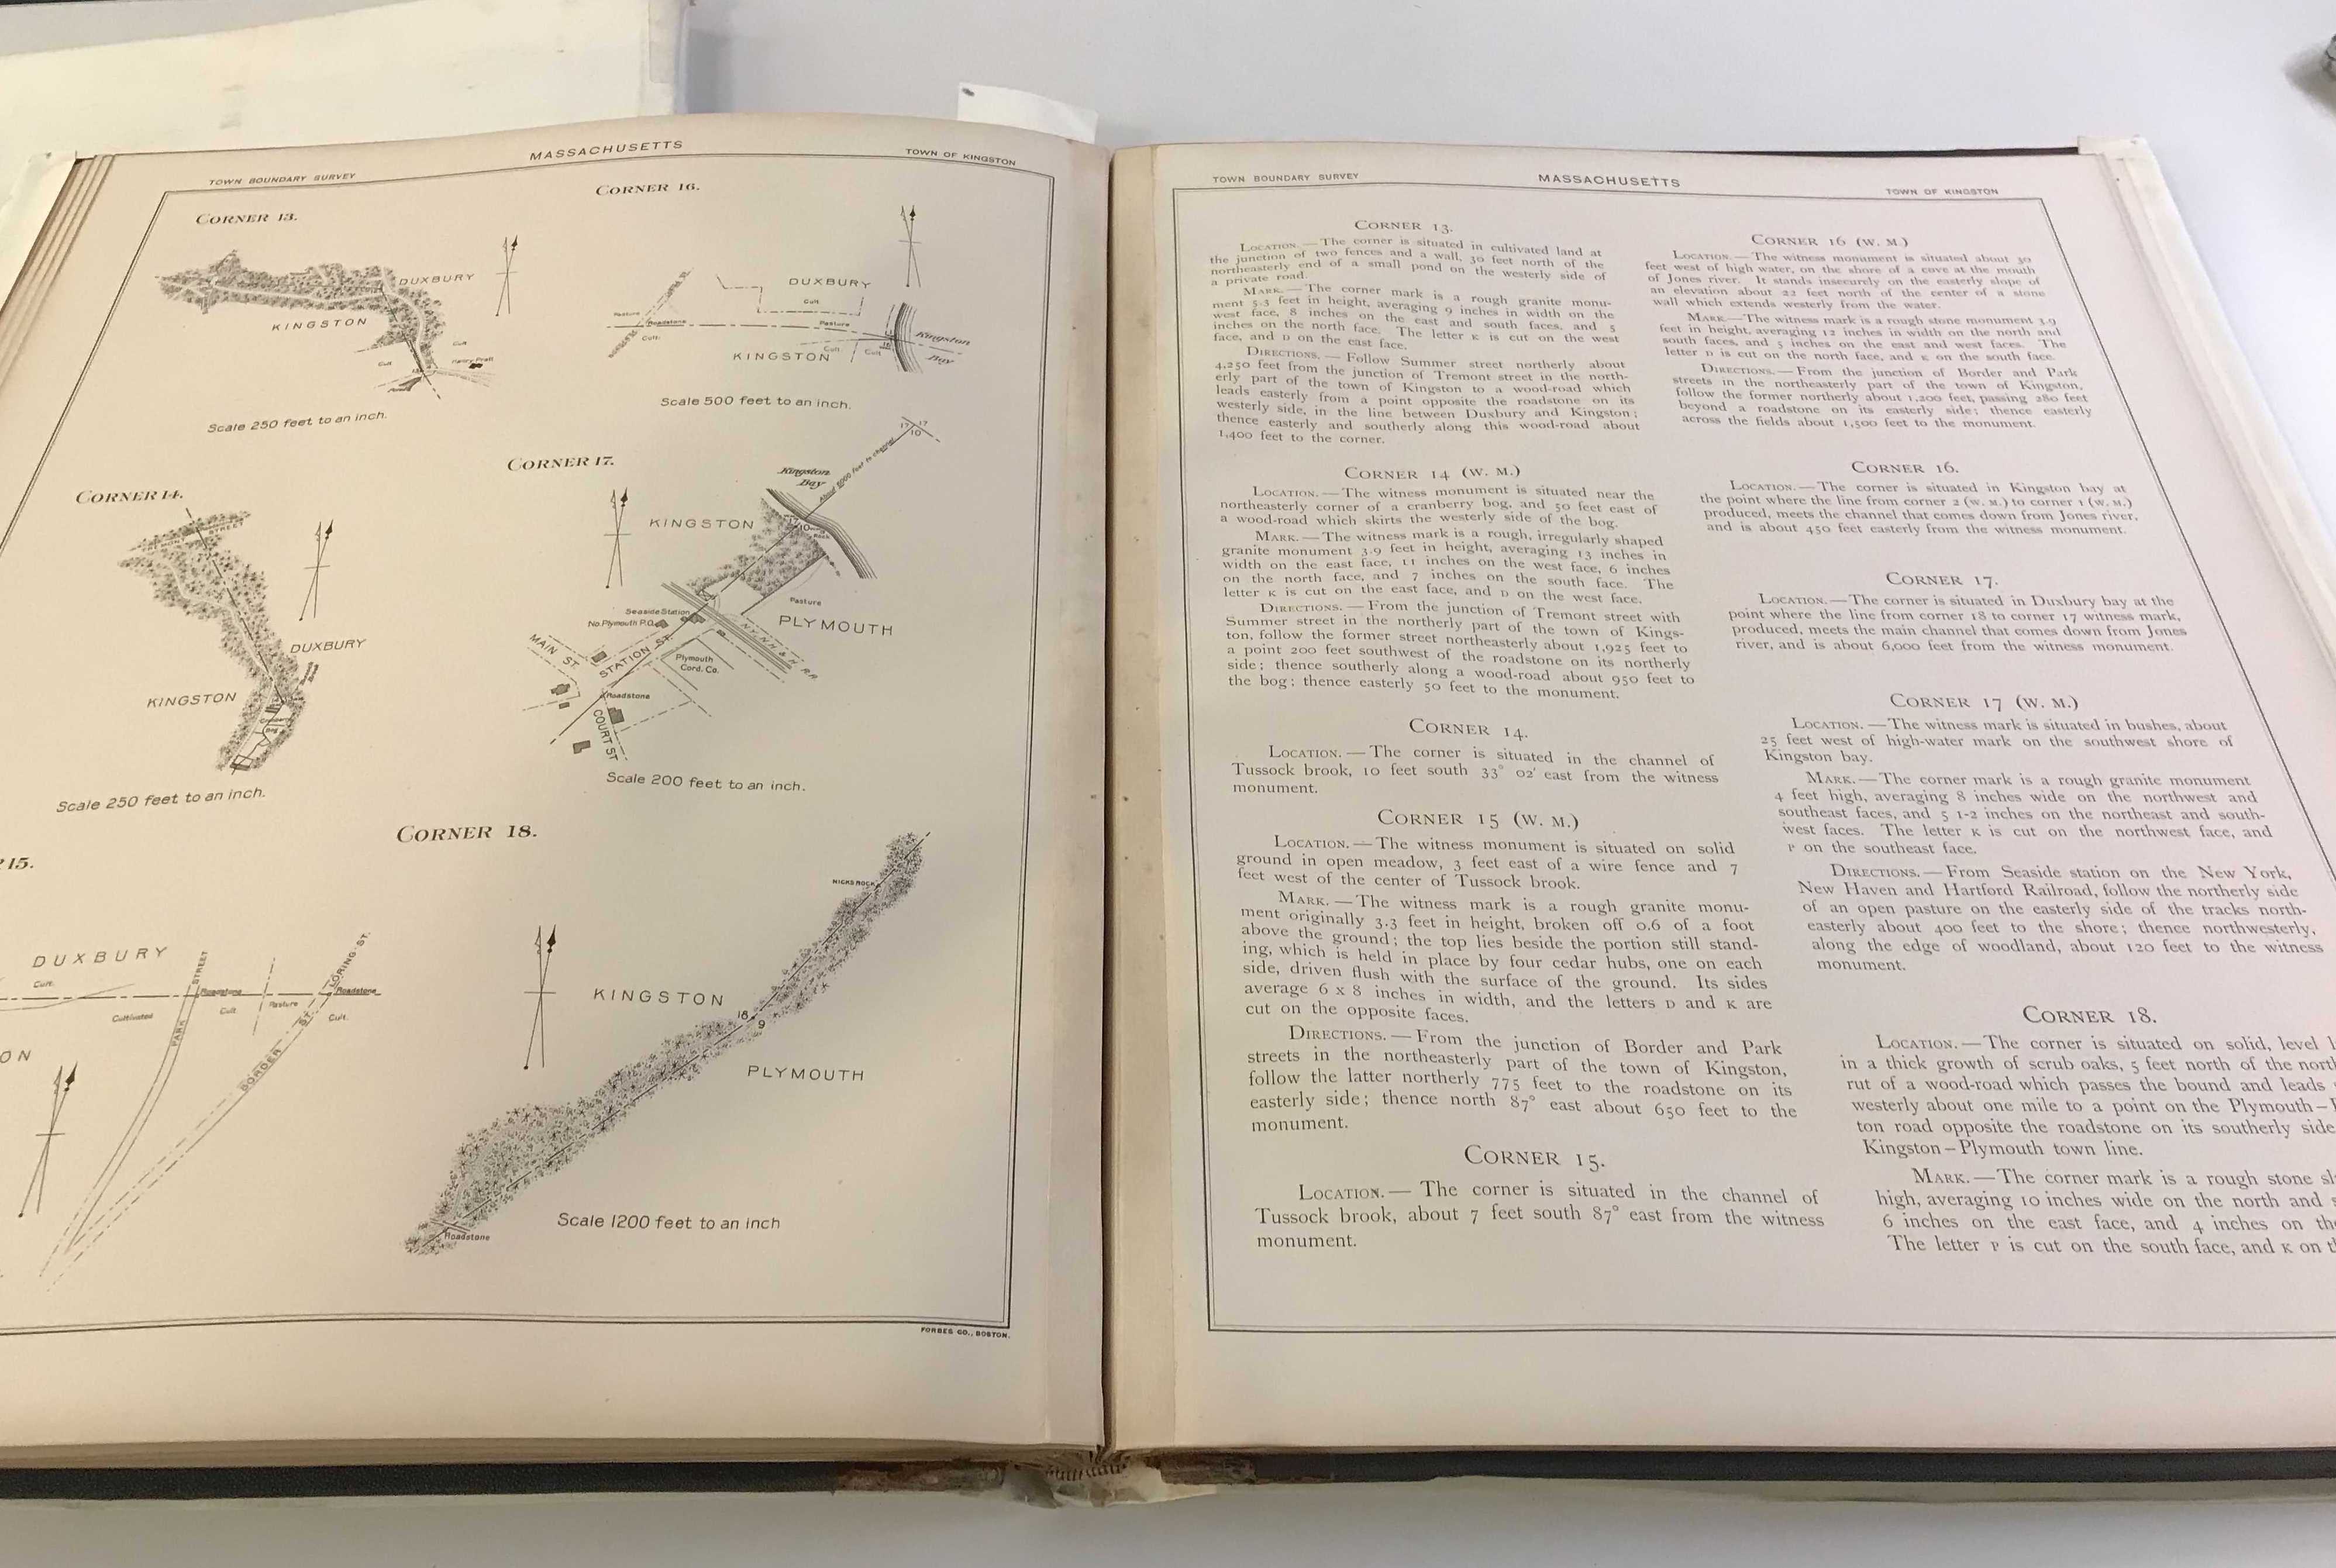
Atlas of the boundaries of the town of Kingston in the LMEC collections
We love maps that make historic documents more accessible and engaging, like our Atlascope viewer for fire insurance and real estate atlases. The historic town boundaries atlases in the LMEC's physical collections are rich, highly detailed resources. With maps, legal descriptions, tables, and sometimes even photographs, they are full of information. Statistical tables include geographic triangulation stations and the distances between them. Hand drawn indicator maps, show the locational details of town corners, noting features like buildings, fences, sewer lines, vegetation, and waterways.
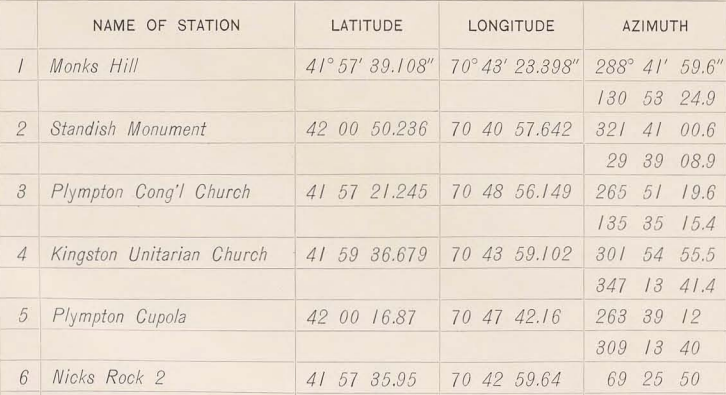
Triangulation stations in Kingston, Massachusetts
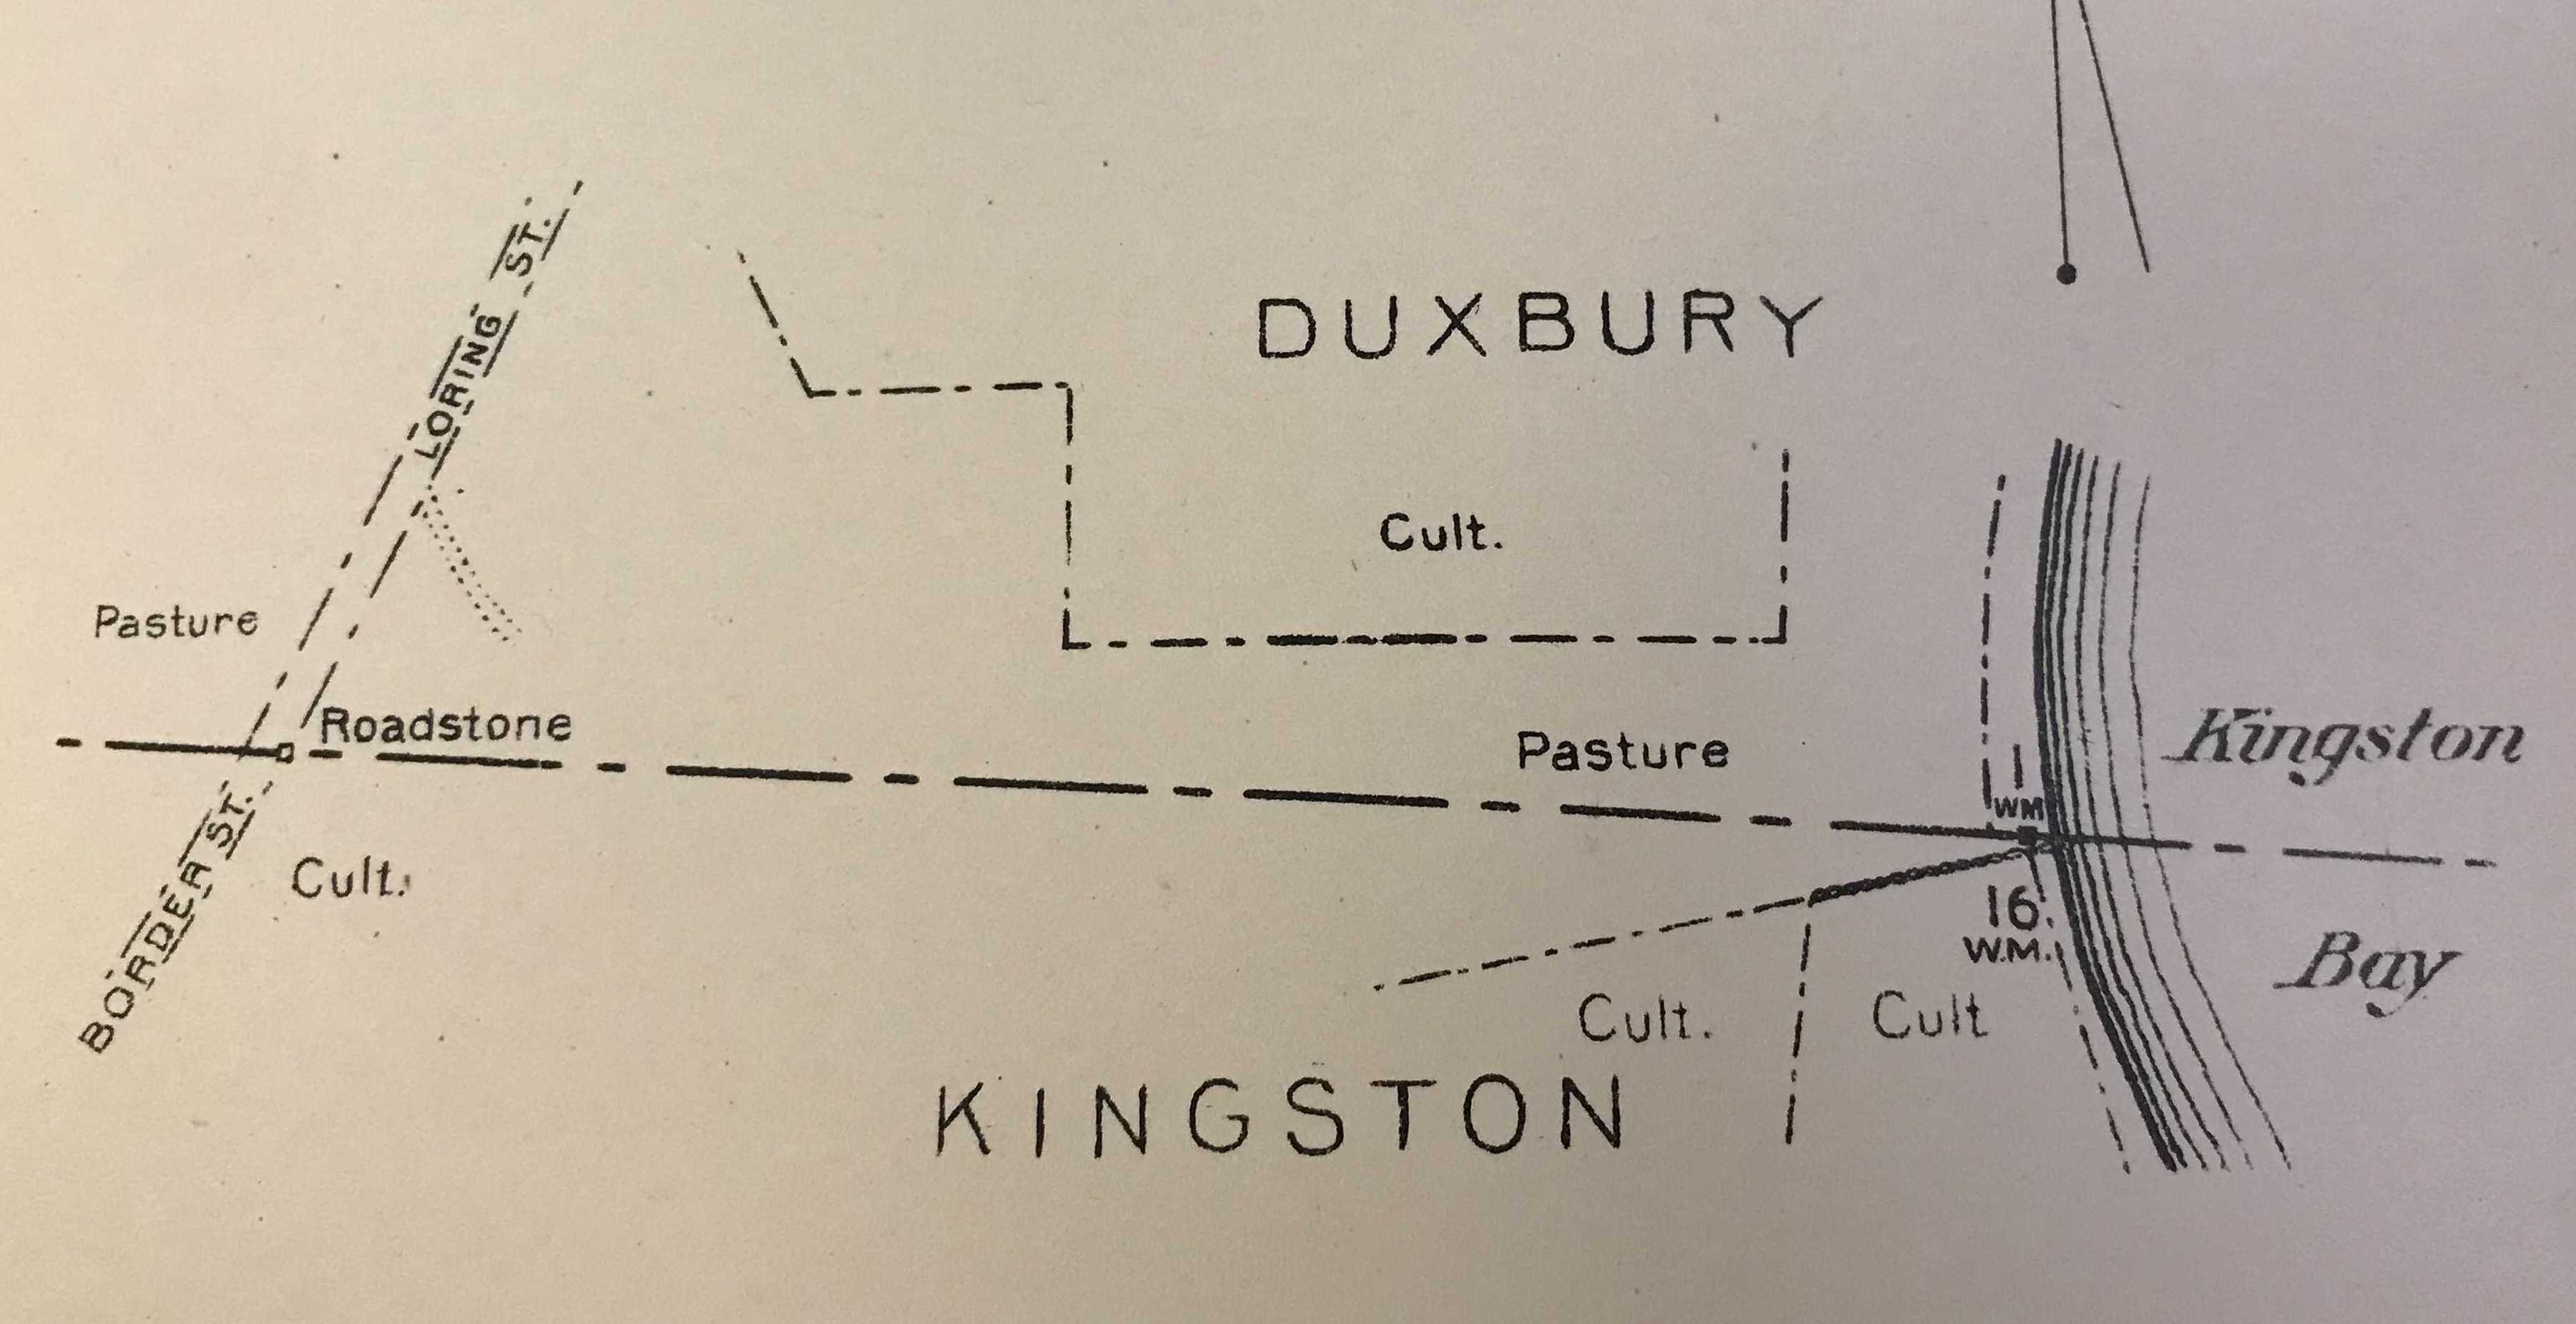
Town boundary between Kingston and Duxbury, along the Jones River
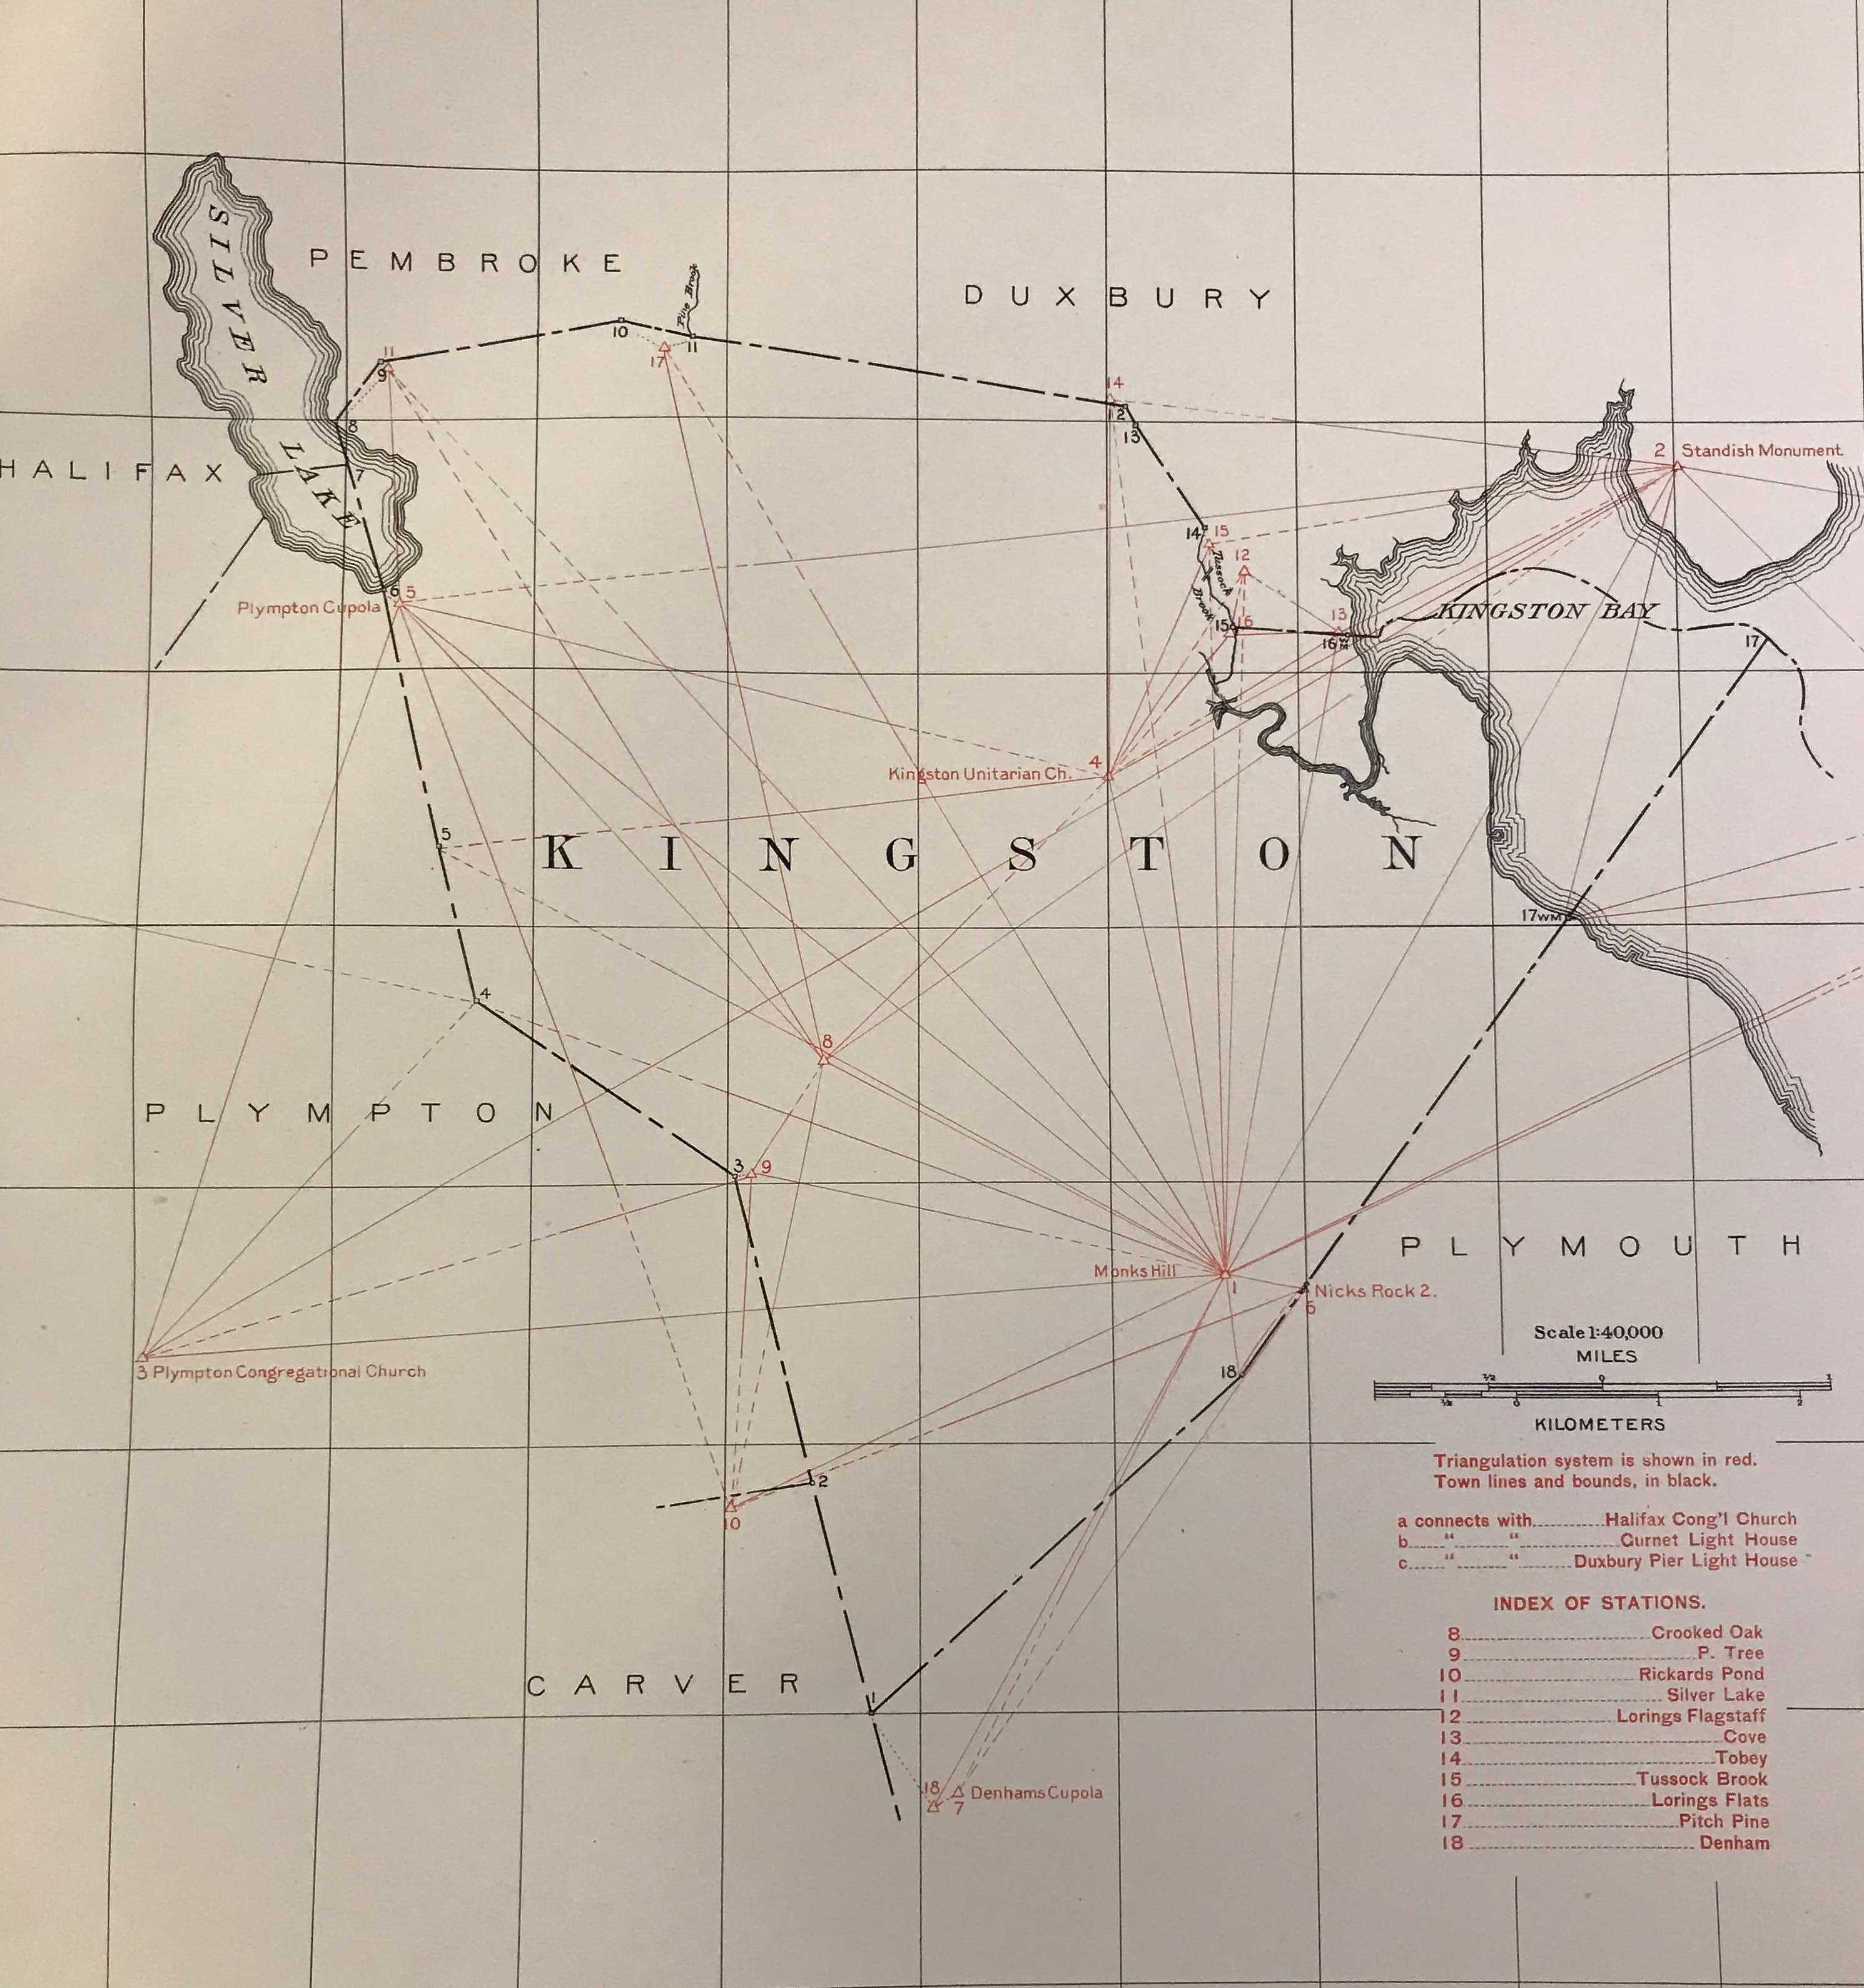
Map from the 1899 Kingston atlas showing survey locations
Making digital reference maps that aid in finding historic materials is a lot of work. For example, our GIS interns spent over a year creating the digitized maps that are part of Atlascope. We were really excited to find that MassDOT had already created data for town corner atlases, which gave us an opportunity to bring in our specialization in public engagement. Our town corners web map, therefore, is a demonstration of how data goes through many stages of its life: from the original surveyors in the early 1900s, to the GIS conversion carried out by MassDOT, and now the LMEC's public-facing web discovery tool.
Interview
At the LMEC, accessibility is a core staple of our work. In our public data projects, we aim to tease out some of the technological and social barriers which inhibit public datasets' everyday usefulness. Data published by government institutions interest us, because, just like the materials held by the Boston Public Library, they are resources which belong to the people.
Having made a connection with MassDOT via the town corners webmap project, I was interested in learning more about the ways public accessibility factors in to their daily data practices.
I sat down with Carl Hughes, MassDOT's Lead GIS Developer. We had a discussion about the GIS resources they oversee, and some of the challenges inherent in creating data materials for public audiences.
The text of this interview has been lightly edited for clarity.
Belle Lipton: How long have you worked with MassDOT?
Carl Hughes: Five years.
BL: How many people are in GIS services there?
CH: The team is around 15 people or so. We manage the GIS data & infrastructure.
BL: What are some of the main datasets you manage?
CH: The road inventory is the main dataset we work on. We also manage rail, transit, airports, bike networks, the crash inventory, and many other assets.
BL: When you make maps and data for public audiences, what does that mean?
CH: A lot of the time, when we make something “public,” we don't build it for your everyday citizen. They don't necessarily care about the pavement condition. They do care about it, but they care about it on their commute, like if they have a pothole and they want to report it, or something like that.
We gear our materials towards 1. Developers who are doing construction or transportation work 2. City planners and town GIS departments who we work with very closely and 3. Researchers, academics and activists focused on transportation equity.
BL: What are some of the challenges in your work to making data that is accessible for everyday citizens?
CH: Much of the data formatting rules are federally-regulated. For example, there are attributes we collect and report on that wouldn't mean much to the public. Some I can think of are "jurisdiction", "functional classification" and "federal functional classification". Jurisdiction means ownership and ownership determines who is responsible for the road. Internally, we say things like, "oh you know, the jurisdiction dataset", or, "is the road accepted or unaccepted?". We use terminology like this internally, but it might not be obvious to the average person. It means whether or not the city owns and maintains an asset. Sometimes roads are built within a city but they are "unaccepted" so the city does not pay to maintain it. All of this feeds into this thing called chapter 90, which is funding that the towns get, calculated on population, jobs, and then the actual mileage of roads that are accepted within their town. So the data we maintain has real implications for the towns, but it doesn't bother the public.
BL: What are some challenges in your work to using web maps as a form of communication with everyday citizens?
CH: It's a matter of convenience. We are very focused on the road inventory. That's everything from speed limit data, to pavement condition, to guard rail locations. Those aren't very interesting, in and of themselves to the public. We do spend a lot of money, however, collecting, maintaining, cleaning, updating and building tools to support this data.
The benefit to the public is that it gets drawn up into non-MassDOT tools like Google Maps and Waze. That's the primary way most people interact with the data we collect and the work we do. If we built a tool to show, for instance, the locations of road closures, nobody would use that application. It would be inconvenient. But Google Maps does take that information from us.
BL: Do you use Google Maps, Apple Maps or Waze?
CH: I mean, I use Google Maps, it's just easiest!
BL: Anything else our readers should know about?
CH: We recently published a new site with transportation-related COVID data, so how has the pandemic impacted T-ridership? Or toll revenue? Or traffic? The stories it tells are pretty cool.
Learn More
Find data in MassDOT's data portal, GeoDOT
Learn how the pandemic has impacted travel patterns in Massachusetts with MassDOT's COVID Mobility Dashboard
Become a data sleuth by signing up for LMEC's Spring workshop series, Making Sense of Maps and Data
Learn more about how data and society impact one another by checking out LMEC's Spring lecture series Angles on Bending Lines (calendar announcement coming soon!)
Get GIS data help from the LMEC by making a GIS reference request
Our articles are always free
You’ll never hit a paywall or be asked to subscribe to read our free articles. No matter who you are, our articles are free to read—in class, at home, on the train, or wherever you like. In fact, you can even reuse them under a Creative Commons CC BY-ND 2.0 license.