This is the first installment of a three-part series (for further reading, see parts two and three). This digital publication series was supported by the Leventhal Map & Education Center's Small Grants for Early Career Digital Publications program.
The practices of measuring and mapping the Earth emerged as a central part of American and British imperial culture, particularly after the 1740s. But measuring and mapping temperature? Besides a few enterprising observers—like Benjamin Franklin, who wielded thermometer and pen to map the Gulf Stream in 1768—the American colonies lacked a substantive meteorological tradition.1

Benjamin Franklin and Thomas Folger's "A chart of the Gulf Stream" (1768), from the Geography & Map Division, Library of Congress.
The weather patterns illustrated in the chart above, which I created using ratings assembled by historian David Ludlum, would have therefore been at once familiar and unfamiliar to American colonists. The chart rates winter weather in the northeastern American colonies from 1700 to 1800 using a scale (severe, very severe, and mild) based on colonists’ own qualitative descriptions of weather conditions. Yet the chart also represents an abstraction. It indexes the relative severity of one hundred winters that no single observer—not even the long-lived, thermometer-wielding Franklin—ever experienced.
Climate scientists today work from firmer, quantitative bases when they measure weather severity, but the charts they produce present us with similar abstractions. Take, for example, the chart published alongside the alarming report announcing that 2024 was not only the warmest year on record globally, but also the first year in which the Earth’s average surface temperature exceeded 1.5°C above its pre-industrial level.2
Chart from Copernicus
The intensification of droughts, wildfires, floods, and record-breaking heatwaves across the United States and around the world have made our new climate reality clear. Still, the message embedded in the chart remains mind-boggling. How did we so quickly reach the 1.5 °C warming threshold that scientists have long designated as the Earth’s climatic tipping point? What temperatures will register on the chart in 2030? In 2040?
If we are to have any chance at repairing the conditions that have caused the planet to warm, the first question must be answered with a caveat, the second with a disclaimer.
The caveat is that the current climate crisis didn’t, in fact, emerge so quickly. Human responses to the Little Ice Age, a period of cooling that lasted roughly from 1300 to 1850, set the stage for the global heating we are living through today.3 The disclaimer is that simply knowing and negotiating the climate crisis through numbers isn’t going to catapult Earth towards a more stable climate; nor will it usher in a more livable, inclusive world.
The trouble with the 1.5 °C warming threshold and the “pre-industrial” global temperature baseline
The 1.5 °C warming threshold and the widely-adopted “pre-industrial” global temperature baseline from which it is measured have drawn substantial criticism from multiple communities and stakeholders in the past decade.
Indigenous and African communities and climate activists from the Global South have long argued that the practice of hinging global climate policy targets on average global temperature thresholds—like that of the 1.5 °C threshold adopted in the 2015 Paris Agreement—is unproductive, because it encourages policymakers to overlook historical patterns of environmental change and exploitation in their communities that began as a result of colonial, imperial projects long before temperature started to be measured in degrees. Political leaders from these communities and their allies contend that the very idea of a “safe” or “acceptable” numerical limit for global heating merely offers the chief architects of the climate crisis—the industrial powers of the Global North—an excuse to continue business as usual as they chase a climate target of their own arbitrary construction.
Historians, policy analysts, and scientists, too, have critiqued the thresholds and metrics around which global heating is now commonly measured. They have rightly highlighted a key issue: the fact that the baseline used to measure how much the Earth has warmed, on average, since its “pre-industrial” era is calculated from data derived from a period (1850 to 1900) that was hardly pre-industrial. Historical climatologists initially chose to use data from the 1850 to 1900 period for the calculation of the Earth’s estimated “pre-industrial” temperature because it is the first interval for which temperature records are abundant enough to permit the construction of global and hemispheric temperature means. Because of this choice, the widely-adopted pre-industrial baseline from which the 1.5 °C warming threshold is measured presents the Earth’s pre-industrial temperature as an artifact of a period when, for example, coal had already been in widespread use in Europe for over two centuries.4 As scientists have pointed out, greenhouse gas concentrations in the Earth’s atmosphere had already begun to rise by 1850.
For all of these reasons, charts like the one above that measure climate change from the 1850–1900 baseline, and that fixate on the 1.5 °C warming threshold, are faulty maps. They not only obscure the historical origins of anthropogenic climate change by measuring global temperature rise from an anachronistic pre-industrial base. In presenting climate change in the guise of an average global temperature differential, they fail to account for the localized origins and effects of climate change. As policy analyst Shinichiro Asayama has observed, furthermore, fixating on the dangerous consequences of the Earth’s temperature rising above a given threshold—such as the recently valorized 1.5 °C from “preindustrial” threshold—unhelpfully encourages a scarcity mindset in all those who perceive the threshold as a finite deadline that spells doom if surpassed.
Although each additional degree of global heating will matter gravely for the health and safety of people and ecosystems worldwide, it won’t matter much what temperatures register on these charts in 2030 or 2040 if climate change continues to be defined as a problem that can be solved if corporations and nations’ aggregate emissions meet predetermined thresholds for “acceptable” amounts of global heating, and if the past and present effects of climate change merely continue to be measured and represented in the guise of a singular global temperature. As the paucity of reliable pre-1850s temperature measurements lays bare, humans only began to measure and represent climate conditions numerically rather recently. We’ve evolved to understand climate—and disaster—through our cultural attachments and senses.
What historical narratives and guideposts, then, shall we look to instead to navigate the stakes and origins of anthropogenic climate change, and as starting points for action and repair?
Situating and historicizing anthropogenic climatic change
The answer to the above question will necessarily be different in different places and geographies, because anthropogenic climate change did not emerge from one singular cause. Colonial cattle economies, plantation economies, deforestation, industrial agriculture, fossil-fuel extraction, and population growth have all contributed to anthropogenic climate change, as have humans’ consumption practices and transit habits.
In the New England and the Mid-Atlantic regions specifically, we can locate several origin points for the localized onset of anthropogenic climate change, all of which cluster around the late colonial era.
Beginning in the 1720s and especially by the 1730s and 1740s, settler populations in New England and the Mid-Atlantic began to rapidly expand, and the number of cattle kept by colonists began to exceed available grazing and haying grounds. During this period, some of the growth in the colonies’ human populations was due to natural increase, while some of the growth stemmed from transatlantic and forced migration.
In Virginia, for example, population growth was driven disproportionately by conditions of forced migration and forced reproduction amongst enslaved Africans. While New England and the Middle Colonies (New York, New Jersey, Pennsylvania, and Delaware) were not without enslaved peoples and were hardly immune to the institution of slavery, populations in these colonies, by contrast, grew largely in response to the expansion of Euro-American settlements and patterns of voluntary migration beginning in the 1720s.
Each new person in the American colonies presented another mouth to feed, another person to clothe and house, and another body to keep warm in wintertime. In the mid-Atlantic and New England colonies, cattle served as linchpins of each region’s economy, providing their keepers with meat, dairy products, and tallow, which was used for lighting, soapmaking, and candle production. In the seventeenth and early eighteenth centuries, farmers largely relied on the meadows along the Northeastern Atlantic Seaboard’s coastal plain for the feeding of their cattle. Because coal had yet to be discovered in large quantities and was not yet mined commercially in North America, people needing warmth harvested and burned wood.
Cattle grazing and wood harvesting and combustion were not (and still are not) climatically or environmentally benign activities. As cattle graze and digest grass, their stomachs ferment its cellulose into methane (CH4), a potent greenhouse gas that contributes to atmospheric warming. As trees are harvested and burned for fuelwood, they release carbon dioxide (CO2), another greenhouse gas that similarly traps heat in the atmosphere. Adopted at scale, cattle grazing and timbering activities can reshape entire environments and atmospheres. While the amount of emissions released by timbering and grazing in New England and the Mid-Atlantic regions during the colonial era has yet to be studied (and detailed evidence for such studies is lacking), it is clear that by about 1740, each region had reached a critical turning point in its demographic growth and in the extent of emissions-producing activities occurring on the land.5
By the end of the 1740s, livestock populations had swelled so dramatically and hay prices had escalated so steeply that Connecticut agricultural writer Jared Eliot, for example, declared in a December 1749 agricultural treatise “it is evident that the necessary stock of the Country hath out-grown the meadows….” In response to the rapid increase of the British-American colonies’ settler populations, statesman and scientist Benjamin Franklin, by 1751, was busy writing his essay “Observations Concerning the Increase of Mankind,” which he later published in 1755.
In light of these developments, it makes sense to consider the 1720–1750 period as a more compelling baseline for approximating when certain activities—like timbering, cattle grazing, and population growth—began contributing to anthropogenic climate change in the New England and mid-Atlantic regions specifically. Even without quantifiable emissions data, the period is a far more promising one for further analysis than, say, the prevailing 1850–1900 period that is so commonly cited as the Earth’s “pre-industrial” climatic baseline on global temperature rise charts.
Somewhat counterintuitively, however, if we look at the type of weather experienced by colonists in New England and the Mid-Atlantic, we don’t find the climate getting definitively warmer. Taking a closer look at the dataset below, we see that colonists in these regions continued to experience sporadically severe and very severe winters all throughout the eighteenth century. The dataset indicates, however, that the winter weather was not always severely cold. Colonists also experienced a series of very mild winters during the mid-1740s, and again in spurts across the second half of the eighteenth century. The years 1752–56, 1769–71, 1786–91, and 1792–95 stand out as four periods defined by particularly mild winters.
Were these clusters of very mild winters due to anthropogenic climate change? Available evidence makes it difficult to say. It remains possible that anthropogenic activities were, at the very least, a partial cause. During his travels through the Middle Colonies in 1748–50, Swedish botanist Pehr Kalm interviewed elderly settlers, who recalled that winters had formerly been longer and more severe, with deeper and more persistent snow cover. These settlers attributed the moderation of the winter cold to widespread forest clearing and other changes in land use. Many of the people Kalm interviewed were born into the Maunder Minimum (1645–1715)—a period of low sunspots and colder winters in the American colonies—which may have sharpened the contrast they perceived between earlier and later winters. But to conclusively decipher whether anthropogenic or natural factors gave rise to the milder winters marked on the chart above is an impossible task to achieve with existing sources.
What we can analyze, however, is how colonists responded to the severe weather represented on this chart. When we examine how colonists responded to the concurrent challenges of resource scarcity, population growth, and severe weather (rather than search for the immediate causes of the warmer winters represented above) we find a different causal chain of events—one that can help us to understand the roots of many of our contemporary challenges, climate change included.
Revisiting the roots of contemporary climate change and inequality as America turns 250
As the United States teeters toward its semiquincentennial on July 4, 2026, this series revisits the decades prior to the United States’ founding to examine how American colonists’ responses to scarcity, population growth, and severe weather helped to precipitate two revolutions—the American Revolution, and the Industrial Revolution.
In this series, I will look specifically at how several of the events annotated on the “winter weather” chart above—population growth, resource scarcity, agricultural adjustments, the enclosure of Native American lands, and severe weather among them—contributed to the making of the highly unequal, ecologically- and climatically-altered world we live in today.
The series title “Prelude to a Revolution” gestures towards the focus of the narrative I present. The phrase, however, is also meant to suggest that there still remains another revolution we can usher into existence: the revolution in human and non-human rights that the Age of Revolutions set the grammar for, but that revolutionaries left unfinished.
Recognizing that maps are not just records of history, but active agents within history, the series will also examine several maps that reshaped colonial land relations and conditions of inequality in North America both before and after the American Revolution. The final installment of this series will examine how one particular map—the Proclamation Line of 1763 map—helped to trigger the American Revolution itself:
![“The British governments in Nth. America,” by John Gibson [1763]. Norman B. Leventhal Map & Education Center.](https://iiif.digitalcommonwealth.org/iiif/2/commonwealth:6108vt62n/full/1200,/0/default.jpg)
John Gibson, The British governments in Nth. America (1763)
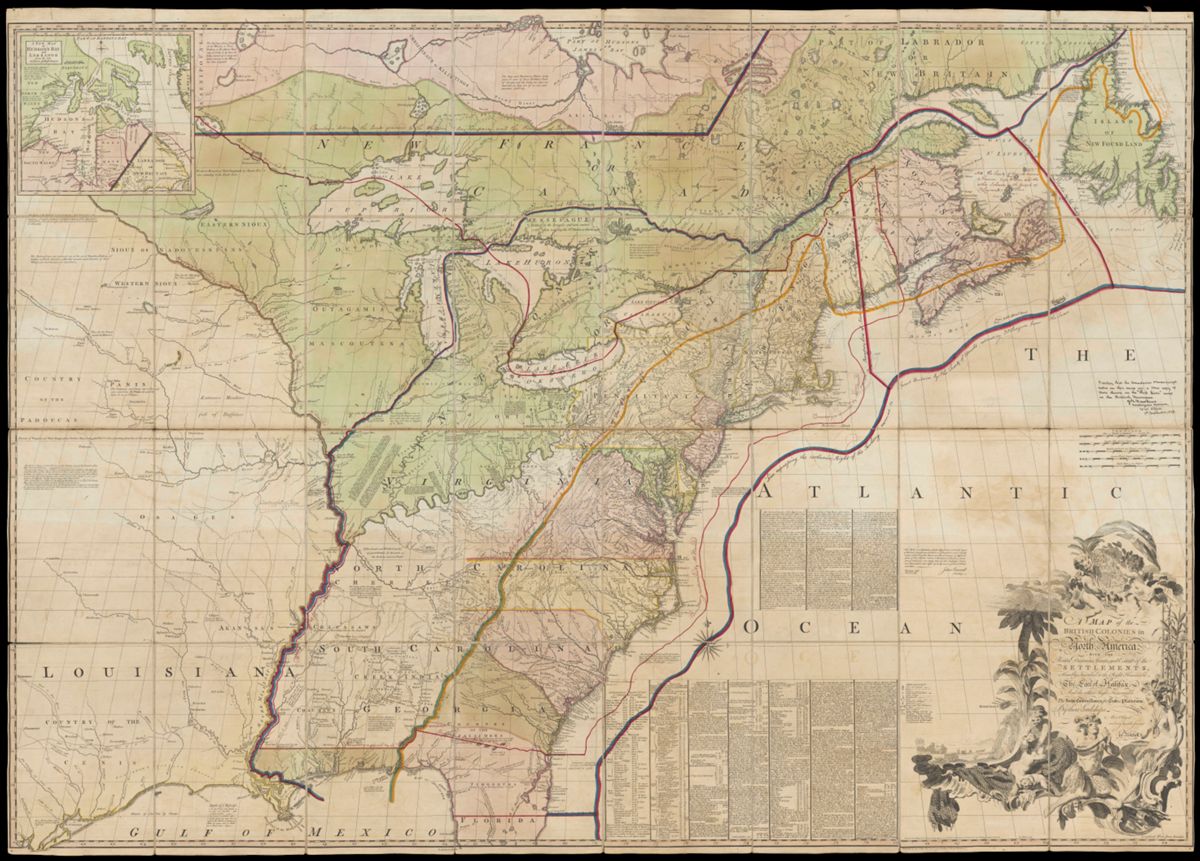
This version of John Mitchell's Map of the British Colonies in North America (1775) was used during the treaty negotiations that preceded the 1783 signing of the Treaty of Paris
The series will also examine how several other kinds of maps, including John Mitchell’s map (shown above), precipitated patterns of governance that that continue to condition how the United States and other global powers address environmental challenges, like climate change, to this day.
Stay tuned for the next installment in this series, which begins, quite literally, in the grass.
Charlotte Leib is a doctoral candidate in the Department of History at Yale University. Trained in US and early American history, energy history, landscape history, and urban history, Charlotte writes and researches about the cultures, technologies, political economies and climates that have shaped landscapes and cities in early America and in the nineteenth and twentieth century United States.
Notes
1. On Franklin’s map of the Gulf Stream, see: Joyce Chaplin, “Circulations: Benjamin Franklin’s Gulf Stream,” in Science and Empire in the Atlantic World, ed. James Delbourgo and Nicholas Dew (New York: Routledge, 2007): 73–96.
2. For additional reports confirming that the Earth is quickly surpassing the 1.5°C warming benchmark, see: Emmanuel Beevacqua, Carl-Friedrich Schleussner & Jakob Zscheischler, “A year above 1.5 °C signals that Earth is most probably within the 20-year period that will reach the Paris Agreement limit,” Nature Climate Change 15 (2025), 262–265; Alex J. Cannon, “Twelve months at 1.5 °C signals earlier than expected breach of Paris Agreement threshold,” Nature Climate Change (2025): 266–269.
3. Little Ice Age developments in agriculture, science, racism, and imperialism have been theorized and studied as critical drivers of anthropogenic climate change by several historians. For a good summary of recent work in this vein, and a roadmap for where the field might head next, see Joyce Chaplin, “Historians of Ideas Rush in Where Stratigraphers Fear to Tread,” Journal of the History of Ideas 84, no. 4 (October 2023): 775–801. For recent scholarship on Little Ice Age ideas and technologies, and the origins of anthropogenic climate change, see for example: Anya Zilberstein, A Temperate Empire: Making Climate Change in Early America (New York, NY: Oxford University Press, 2016); Pierre Charbonnier, Affluence and Freedom: An Environmental History of Political Ideas, trans. Andrew Brown (Cambridge, UK and Medford, MA: Polity Press, 2021); Frederik Albritton Jonsson and Carl Wennerlind, Scarcity: A History from the Origins of Capitalism to the Climate Crisis (Cambridge, MA: Harvard University Press, 2023); and Joyce Chaplin, The Franklin Stove: An Unintended American Revolution (New York: Farrar, Straus and Giroux, 2025). For scholarship that examines how Euro-American colonists in the Caribbean Islands and in North America experienced the Little Ice Age, see for example: Matthew Mulcahy, “Climate and Climate Change in Early America,” Oxford Research Encyclopedia of American History (2023); Sam White, A Cold Welcome: The Little Ice Age and Europe’s Encounter with North America (Cambridge, MA: Harvard University Press, 2017); Karen Ordahl Kupperman, “Climate and Mastery of the Wilderness in Seventeenth-Century New England,” in Seventeenth-Century New England, ed. Hall and Allen (Boston: Colonial Society of Massachusetts, 1984), 3–37.
4. On the uptake of coal as heating fuel in European geographies in the late sixteenth century, see for example: Barbara Freese, Coal: A Human History (Cambridge, MA: Perseus Publishing, 2003), 32–33; William M. Cavert, The Smoke of London: Energy and Environment in the Early Modern City (Cambridge, UK: Cambridge University Press, 2016), 23–28.
5. Eric Herschthal and John L. Brooke have provided a model for this kind of emissions-focused historical research in their recent article: “The Plantation Carbon Complex: Slavery and the Origins of Climate Change in the Early Modern British Atlantic,” William & Mary Quarterly 81, no. 2 (2024): 255–306.
Our articles are always free
You’ll never hit a paywall or be asked to subscribe to read our free articles. No matter who you are, our articles are free to read—in class, at home, on the train, or wherever you like. In fact, you can even reuse them under a Creative Commons CC BY-ND 2.0 license.