
This EPA map defines the Lower Neponset River as the 3.7-mile stretch of the Neponset River from the confluence with Mother Brook to the Walter Baker Dam.
On Monday, March 14, 2022, the U.S. Environmental Protection Agency (EPA) announced the addition of the Lower Neponset River to the Superfund National Priorities List—a designation that comes after decades of local advocacy efforts and will provide federal resources for a thorough environmental hazard investigation and cleanup project.
The EPA’s decision draws from studies conducted in the early 2000s that determined “the river contains sediment contaminated with elevated levels of polychlorinated biphenyls (PCBs) that may pose a risk to human health and/or the environment.” PCBs, man-made organic chemicals consisting of carbon, hydrogen and chlorine atoms, first came into production in 1929 and were mainly used in industrial and commercial applications. Although banned in 1979, PCBs can remain in environments for long periods of time—generally accumulating in air, water, soil, plants, and fish—and have been linked to serious health effects.
See here for more information on PCBs & permitted recreation along the Neponset.
An early industrial river

A 1954 study by Edward Pierce Hamilton estimates 18 mills lined the Neponset by 1800.
Industrial activity along the Neponset dates back centuries before the introduction of PCBs in the 1930s. Early local industries relied on the river for a supply of water, a space for dumping waste, and a source of power for manufacturing infrastructure like mills and dams.
Many of these mills—supporting the production of flour, gun powder, paper, lumber, and chocolate—were concentrated in today's Dorchester-Milton Lower Mills Industrial District and Upper Falls area, and appear in great detail on this 1890 pictorial map by the O.H Bailey & Co. The map also labels 49 points of interest, including a branch of the Boston Public Library, the Milton School of Music, and the Milton News Office.
Let's take a closer look at two of the river's earliest industrial facilities.
This 1890 pictorial map of Lower Mills documents a handful of early local industries.
The local paper boy[s]

This map from Howard Wallingford's Papermaking on the Neponset cites the 1728 Act for the Encouragement of Making Paper.
Though one of the oldest and most successful industries, paper production along the Neponset was born out of necessity during a paper shortage in the colonies. In 1728, the Massachusetts legislature permitted "Daniel Henchman...Benjamin Faneuil, Thomas Hancock, and others" to construct a paper mill along the Neponset. Under the agreement, they were required to produce "140 reams of brown [paper]" and "60 reams of printing paper" during the first 15 months of operations, and "at least 500 reams, including 25 reams of writing paper, during each succeeding year thereafter." The partners "leased a fulling mill in Milton, installed necessary machinery...built a house for the workers" and presented "sample sheets to the provincial legislature" by 1731.
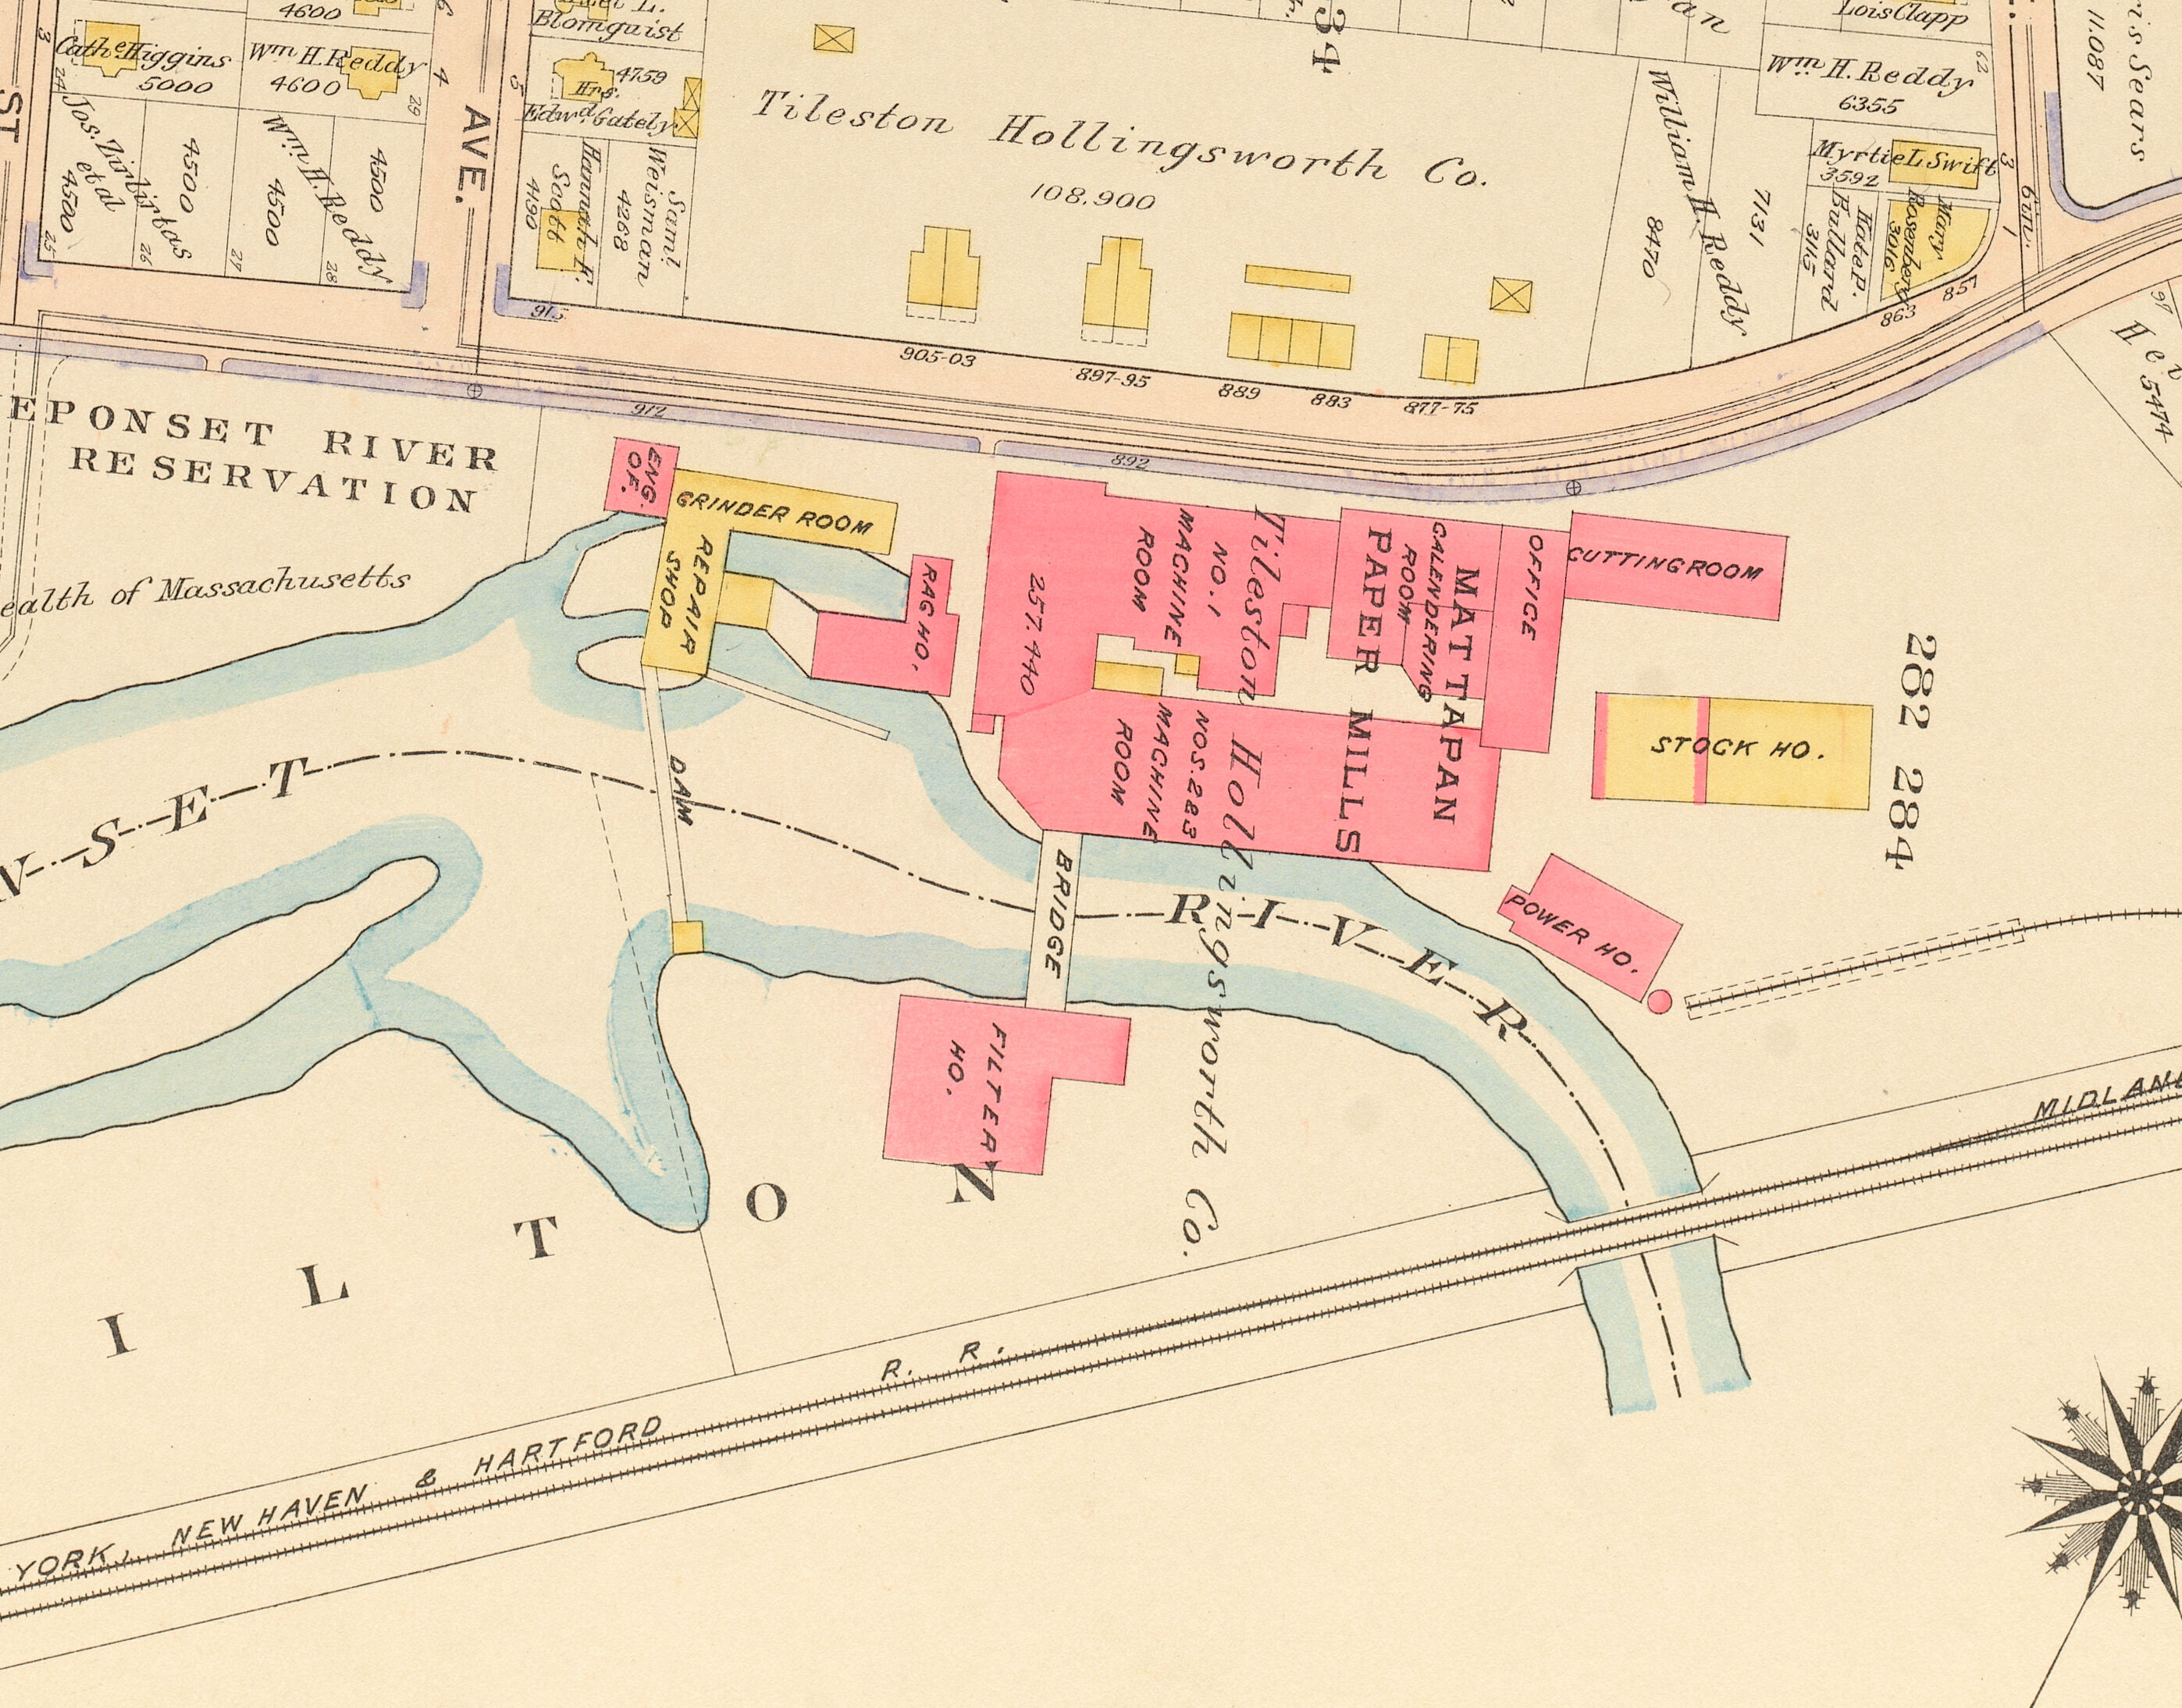
Almost 50 years later, a few new faces entered the industry. In 1773, George Clark began construction of a paper mill on the remnants of a lumber mill, and over the next three decades, bounced ownership from Abigail Quincy, to Patrick Connor and William Sumner, and finally to Edmund Tileston and Mark Hollingsworth of the Tileston and Hollingsworth Co., pictured on the map's border and along the river. The partnership saw overwhelming success and continued to buy, lease, and build additional mills on the river to support paper production into the twentieth century.
Flip through these atlas excerpts from the 19th and 20th centuries documenting the expansion of Tileston & Hollingsworth properties in 1874, 1889, and 1910 and the paper mill complex in 1912.
Willy Wonka and the Neponset River
Moving downstream, Boston's very own Wonka Chocolate Factory (a.k.a. the Walter Baker Chocolate Company) is also featured along the map's border and distinguished by the numbers 14, 15, and 16 on the map's geographic landscape.
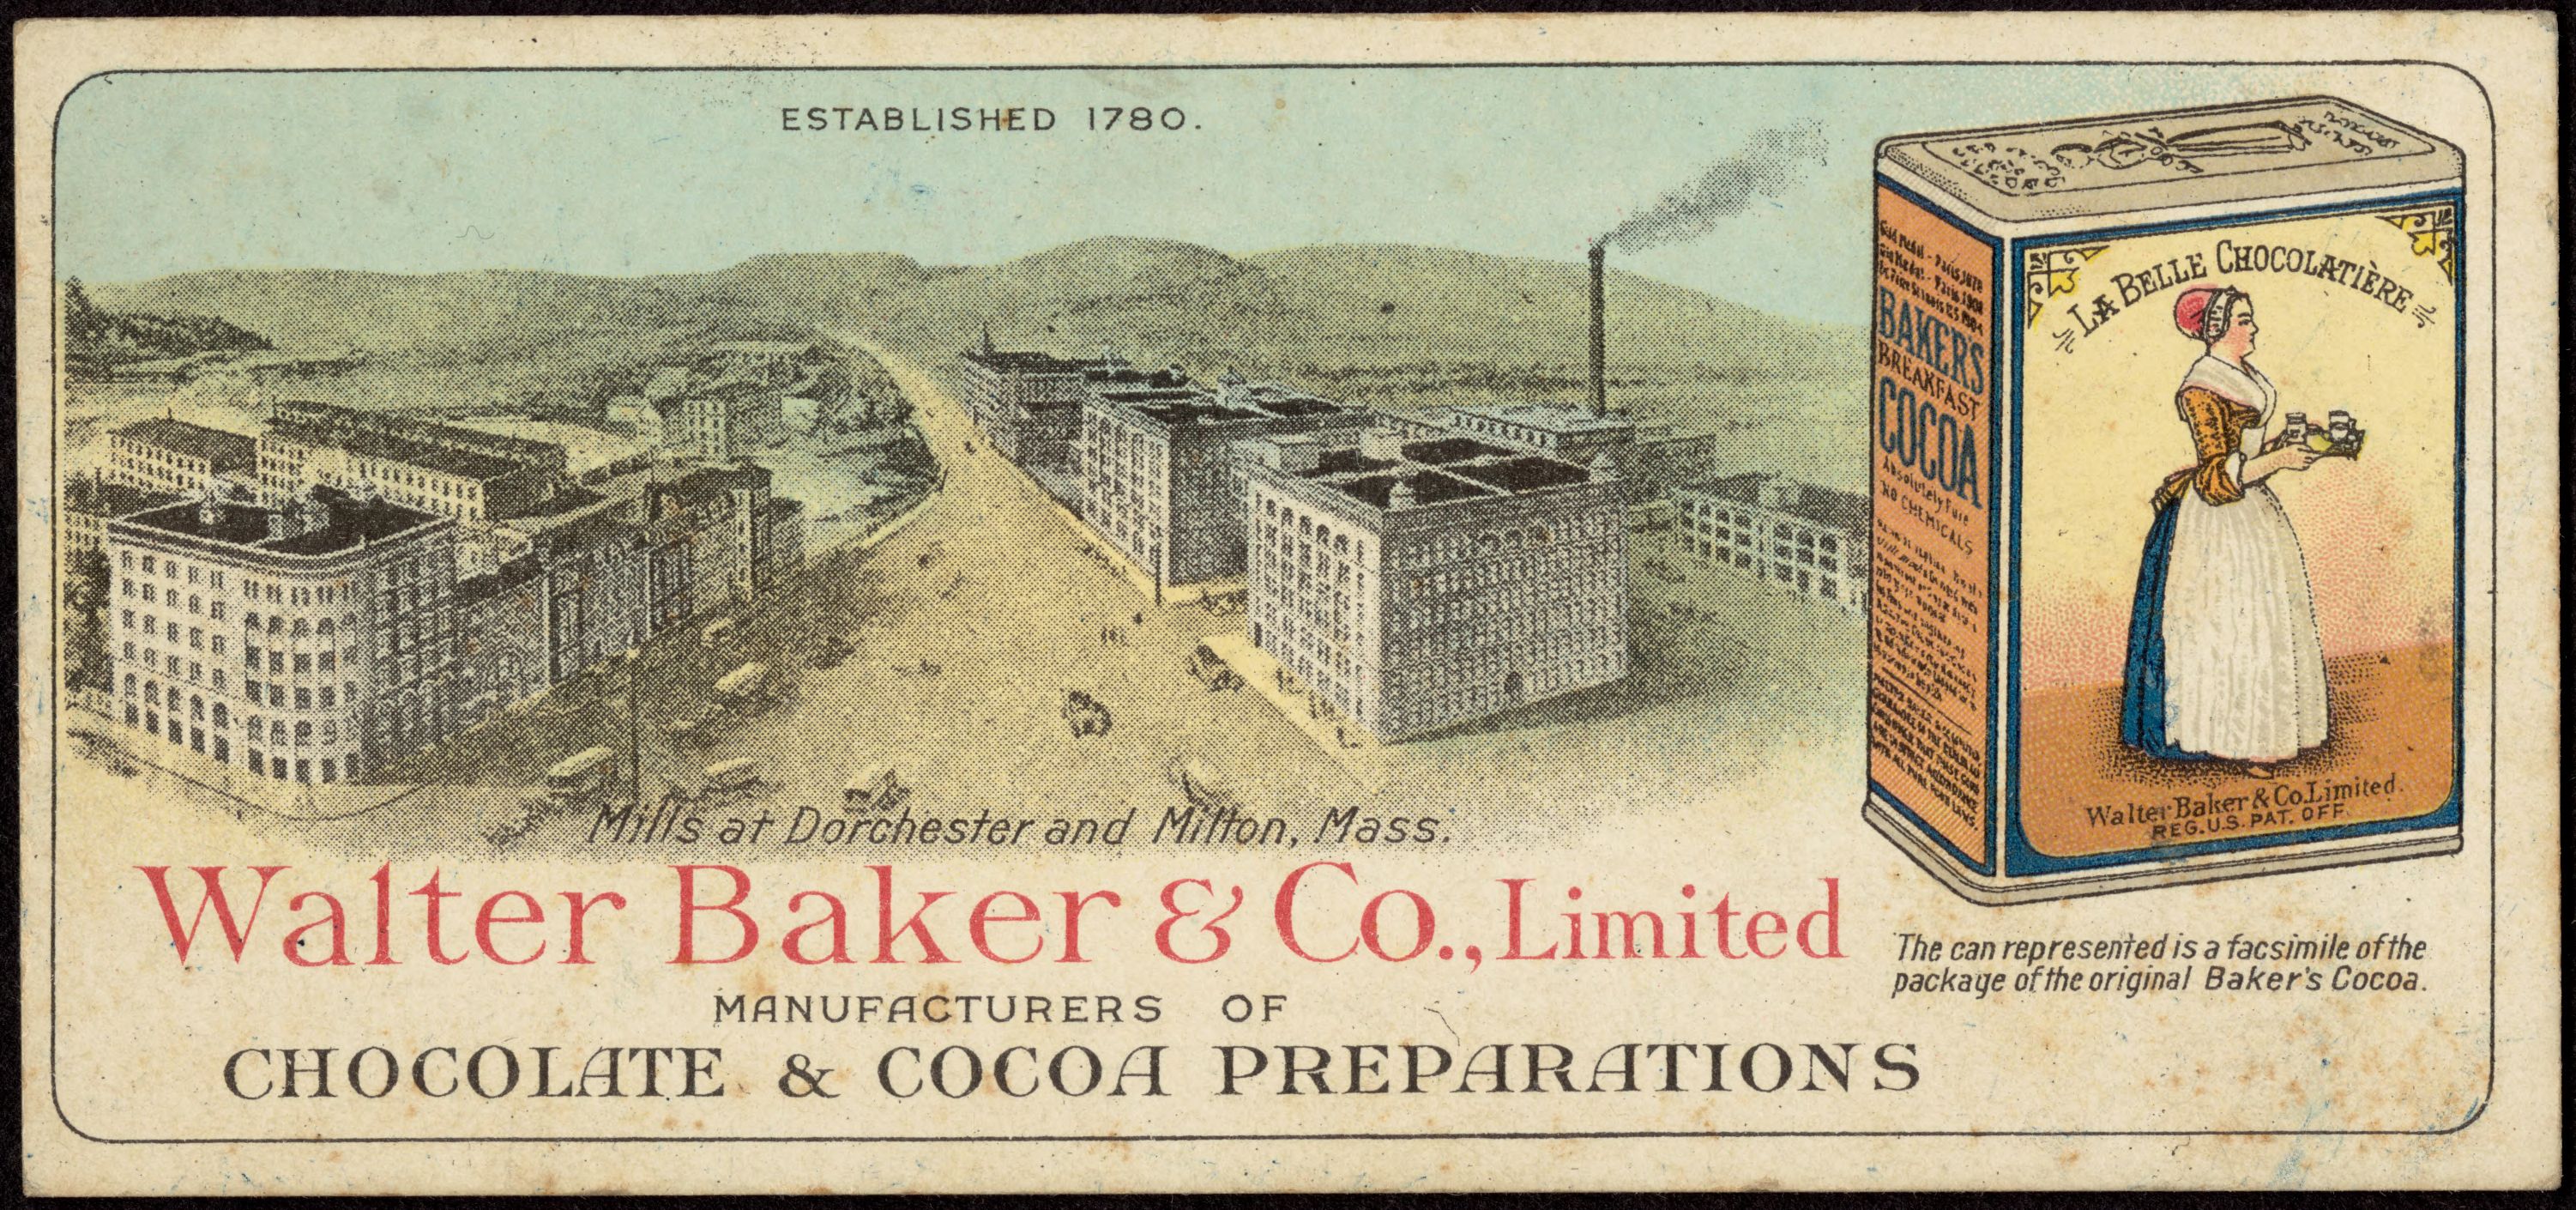
This advertising card from the late nineteenth lists the Walter Baker & Co. as manufacturers of chocolate and cocoa preparation.
How did this early chocolate business come to settle along the Neponset? In 1764, a young Irish immigrant named John Hannon approached local mill owners with a request to harness water power for a new chocolate-making technique he learned in London. No mill owners were particularly enthusiastic about the idea, but a general store owner named James Baker jumped on the idea as a prospective business opportunity. On March 8, 1765, Hannon began making chocolate in a saw mill financed by Baker and powered by the Neponset. Baker took full ownership of the business after Hannon disappeared in 1779, and the Baker name ran the Boston chocolate scene until 1965, when operations moved to Delaware.
Flip through these atlas excerpts from the 19th and 20th centuries documenting the Baker family and business in 1874, 1889, 1910, and 1933.


Geographic concentration of PCBs

This 1956 photograph documents the original Tileston & Hollingsworth Dam after Hurricane Diane in August of 1955.
Though the Walter Baker and Tileston & Hollingsworth facilities were likely not responsible for PCB pollution, their historic geographic sites are home to the highest concentration of pollutants today. According to a report from the Neponset River Watershed Association, concentrations are the highest "in Hyde Park behind the T&H Dam... [and] lower, but still quite high, behind the Baker Dam and in the area known as the 'braided channel' between the two dams." Both the Baker Dam and T&H Dam were reconstructed in the mid-1960s to replace damaged infrastructure after Hurricanes Connie and Diane and manage future flood control of the river. Today, PCB contamination from post-1930 industrial facilities have "bound to sediment particles...flowed downstream...[and] settled out behind the dams."
See here for the latest news and updates on the Neponset site.
Our articles are always free
You’ll never hit a paywall or be asked to subscribe to read our free articles. No matter who you are, our articles are free to read—in class, at home, on the train, or wherever you like. In fact, you can even reuse them under a Creative Commons CC BY-ND 2.0 license.