On February 2, we hosted From The Vault: African American History Month! From The Vault is a biweekly event series showing collections objects selected by Leventhal Center staff. For this edition of the series, we examined the ways maps can support and inform the story of Black and African American history in the United States. These maps highlight the power cartography can have in shaping the lived experience of people in the United States and around the world.
Thomas Clarkson, Coast of Senegal (1789)

Drawn to illustrate a series of letters written in Paris between December 30, 1789 and January 1790 explaining the African slave trade. The first federal census of 1790 counted 697,897 enslaved people, a figure that would increase by close to 70% in just 20 years. This map was created by Thomas Clarkson, an English abolitionist, and gives an inside look to the global attitude and casual knowledge of the kidnapping and enslavement of African people.
William C. Bloss, Map of the United States and territories, showing the possessions and aggressions of the slave power (1856)

Identifying free states in white and enslaved states in black, this map was created to draw attention to the inequity of the Three-Fifths Compromise, which allowed enslaved people to be counted as three-fifths of a person when determining a state’s population for political representation and voting power. This “compromise” gave enslaved states the perpetual upper hand in politics due to significant overrepresentation - the mapmaker highlights this in the right-hand corner “TWO votes in Slave States equal THREE in Free States.
Edwin Hergesheimer, Map showing the distribution of the slave population of the southern states of the United States (1861)

Published in 1861 at the very beginning of the Civil War, this map plots the percentage of slaves by county for the southern states. It’s noted that Abraham Lincoln was fascinated with the map primarily because it allowed him to trace military movements and to relate those actions to his emancipation policies. As one of the first statistical or thematic maps published in the United States, consider the impact this map had on the trajectory of the Civil War and the future importance of statistical mapping.
Home Owners’ Loan Association, Residential Security Map of Boston (1938)
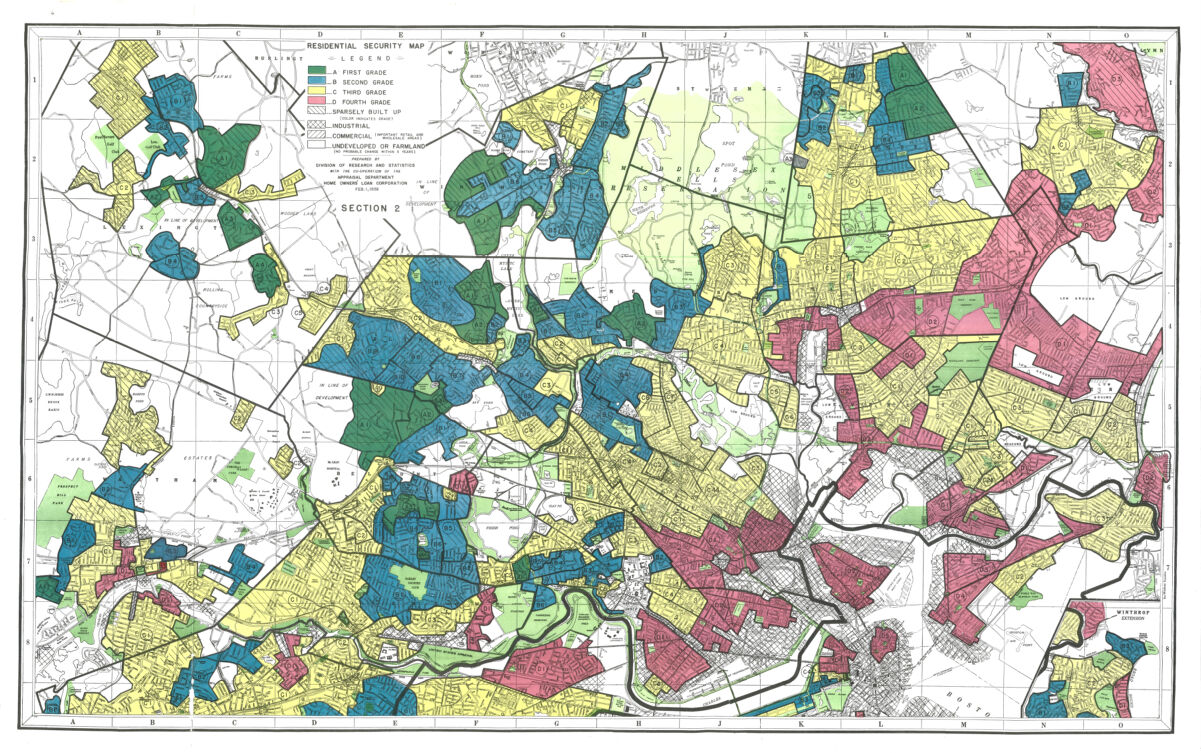
One of the first “redlining” maps of Boston - these maps were created by the Home Owners’ Loan Association to provide lenders with categorized grades used to determine the relative safety of lending in a particular area. While seemingly innocuous, these maps included race as a defining factor in evaluating neighborhoods and routinely evaluated African American, Italian, Irish, and other marginalized communities the worst as red or “hazardous.” This practice went on for decades and greatly restricted African Americans from purchasing homes and the ability to build generational wealth through real estate.
Louise E. Jefferson, Uprooted people of the U.S.A (1945)

This pictorial map shows the movements of the U.S. population during the Second World War, as well as changing social conditions brought about by the war. This map was created by an African American woman, Louise E. Jefferson whose career as a cartographer aimed to put marginalized people “on the map”.
What does it mean that Jefferson depicted African Americans picking cotton and fruit in the South (with no written context), yet named the “negro migration” out of the southern states?
Mary Ronin, The United States, the land and the people = Les états-Unis, le pays et ses habitants = De Verenigde Staten, het land en het volk (1958)
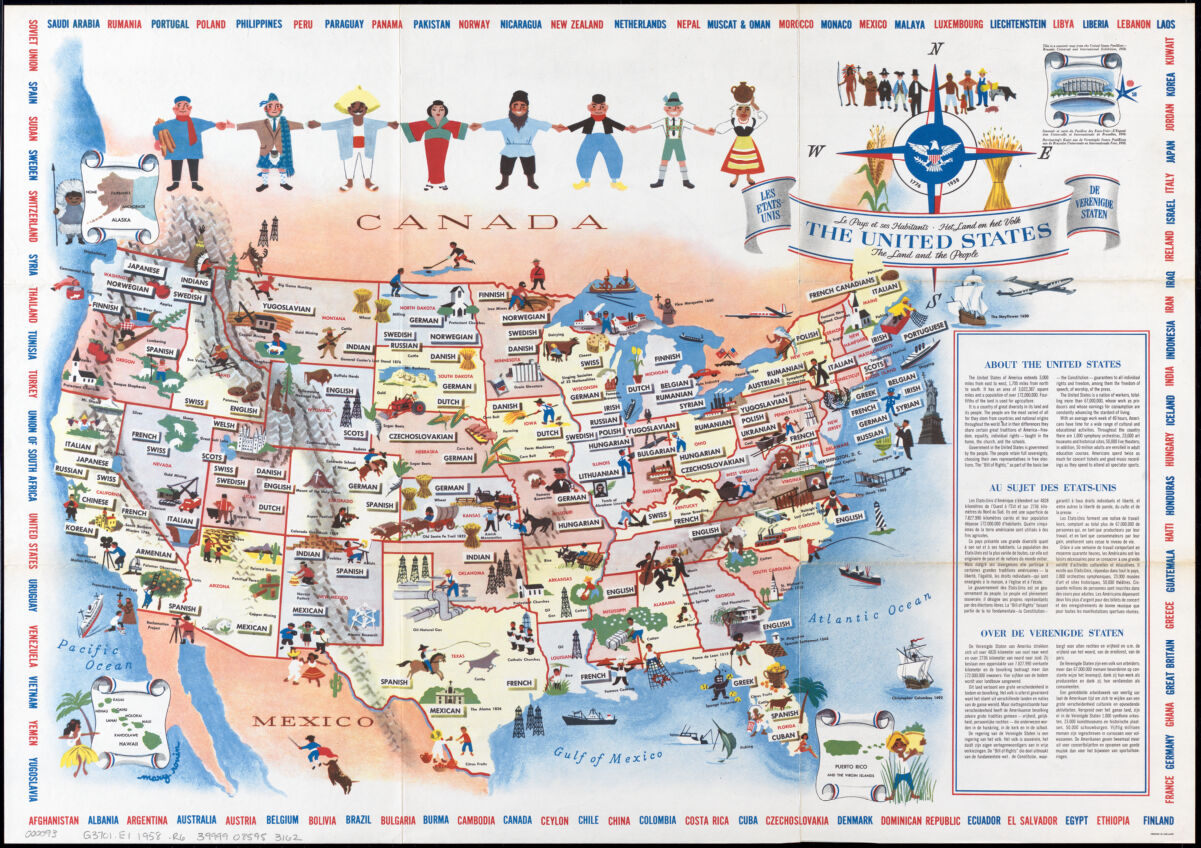
Created to be a souvenir map from the United States Pavilion at the Brussels Universal and International Exhibition, this map was intended to show the diversity of cultures and the unity between groups. African Americans are depicted on the map picking cotton and playing jazz, but are intentionally left an unnamed ethnicity. Despite its assertion that the Bill of Rights “guarantees to all individual rights and freedom”, African Americans had been systematically oppressed and discriminated against for nearly 100 years post-emancipation.
What message might the cartographer be saying by including (but intentionally not naming) African Americans, an ethnic group that has been in the United States since before its founding as an independent country?
Tufts University. Center for the Study of Race and Democracy, The African American Trail Project: Map of Significant Sites (2019)
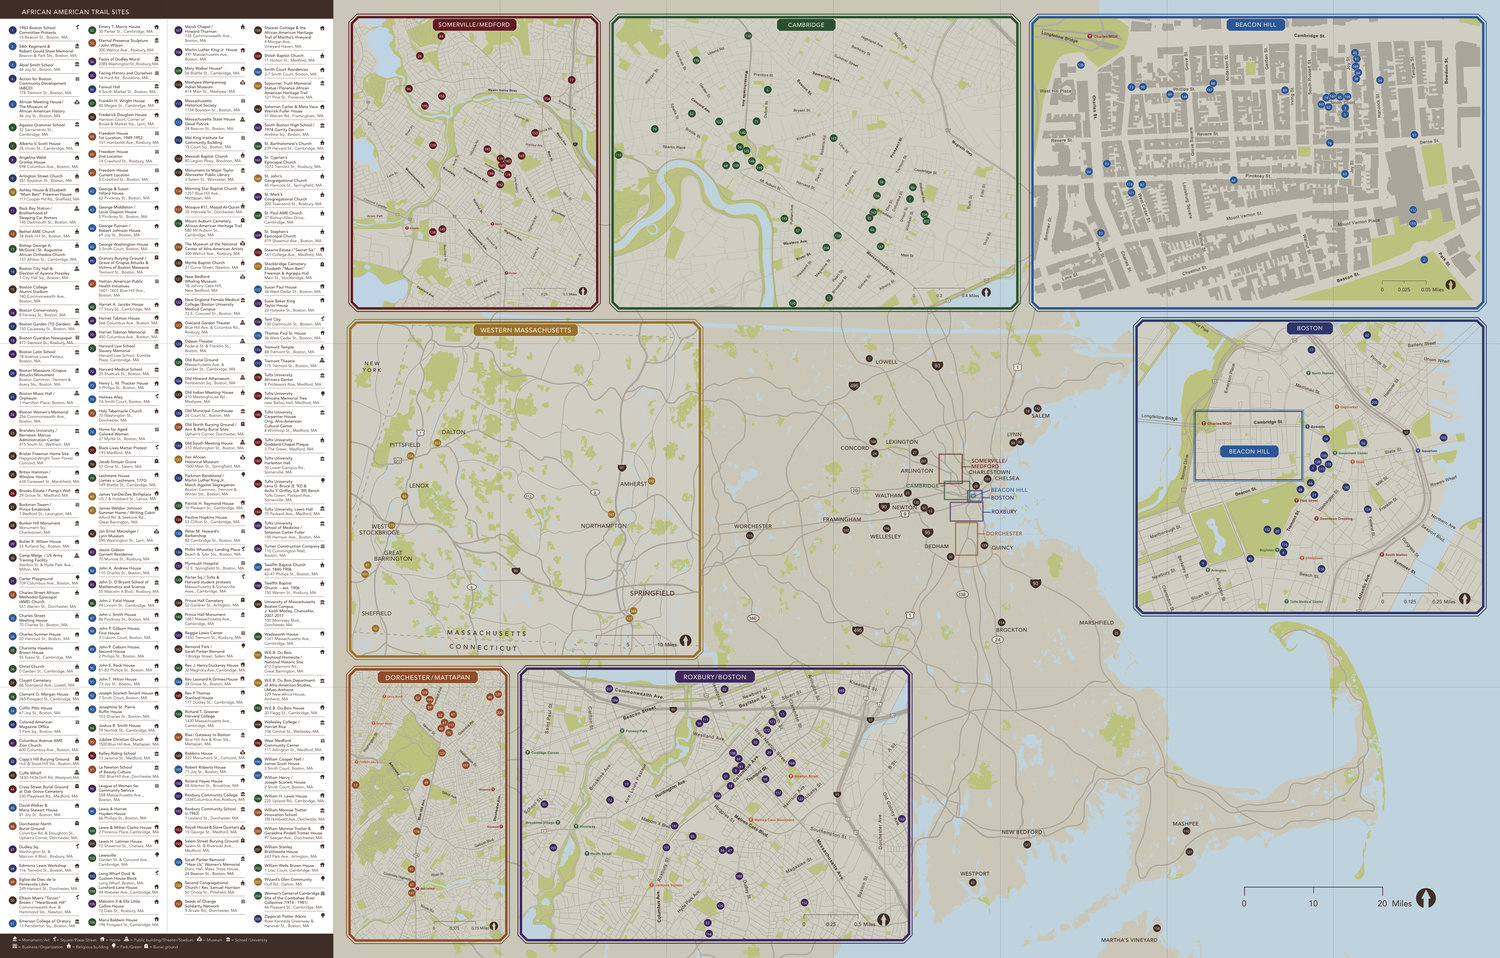
Driven largely by faculty and student research at Tufts University compiled over decades, this project maps African American and African-descended public history sites across greater Boston and Massachusetts. The project aims to “develop African American historical memory and intergenerational community, placing present-day struggles for racial justice in the context of greater Boston’s historic African American, Black Native, and diasporic communities”. This is an amazing resource and example of representative mapmaking by the Black community for the Black community.
Our articles are always free
You’ll never hit a paywall or be asked to subscribe to read our free articles. No matter who you are, our articles are free to read—in class, at home, on the train, or wherever you like. In fact, you can even reuse them under a Creative Commons CC BY-ND 2.0 license.