This article is a part of the Get to Know Your Data series, where we talk to the people and institutions that create, store, and share geospatial data. In this series, we ask about how data managers engage with public audiences and grapple with the social lives of the data that they manage.
When you think about public resources like open space, recreation areas, trees, shady areas, benches and tables, accessible public restrooms, what questions come to mind? Maybe you’re thinking about the immediacy of your day, about information that tells you where you can go to spend time outdoors and bolster your physical and mental health. Or maybe you wonder about bigger questions, like issues of equity when it comes to “third places.” For instance, where do these places exist? And who is able to access them?
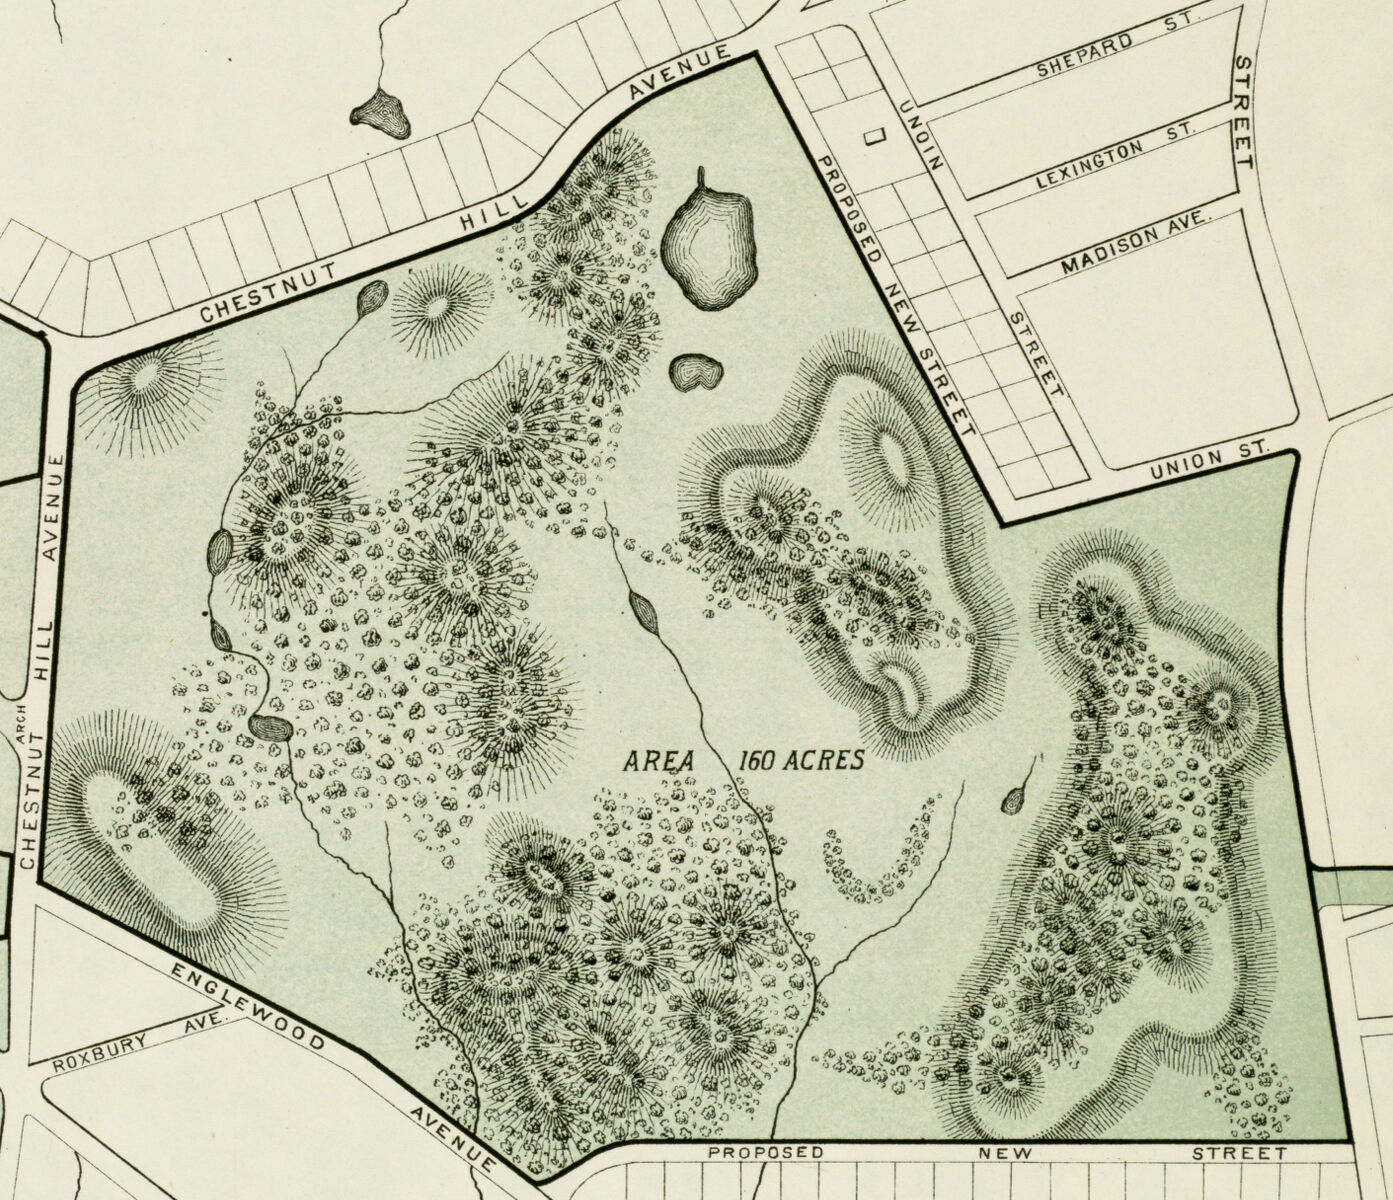
An excerpt from an 1876 plan of Brighton Park
In this interview, we speak with the Principal Research Analyst at the City of Boston’s Parks and Recreation Department (BRPD), Maggie Owens. Last year, as part of our May 2020 Angles on Bending Lines discussion series, Maggie talked with us about how data can be used to tell competing versions of the truth. Today, our discussion focuses on the attitudes and practices of BPRD as they strive to responsibly and meaningfully manage public datasets.
To supplement the discussion, we’ve included two City of Boston analysts who work on issues of public access to data and digital resources. Charlotte Shade is Boston’s Data and Performance Analyst. She manages the spatial data and GIS tools available via Analyze Boston. We also share resources by Joyce John, the city’s official Story Mapper, who has created numerous digital mapping tools for public exploration.
The text of this interview has been lightly edited for clarity.
Interview
Belle Lipton: What public datasets and tools do you create and manage?
Charlotte Shade: I work in the City’s Department of Innovation and Technology (DOIT), where we manage most of the datasets on Boston Maps. That’s the site where anyone can access any spatial data made publicly available by the city. There’s also a lot of spatial data on Analyze Boston.
Maggie Owens: In our Parks planning arm, we’ve been using geospatial data to better understand the whole picture of the city, and try to pick out patterns. That can be anything from understanding and maintaining information about our assets (whether that’s recreational or tables and benches), to understanding how well we are serving people. We collect and present information as we get it from the public, for example, with the Parcel Priority Plan, we were publishing bi-weekly survey results of places where people think there should be open space and why, including survey responses by zip code. This type of information helps us adjust our strategies and maybe target people when we see we are missing groups. It also allows the public to see a little bit of transparency about the information we are getting and how that relates to the decisions we are making. That place is fairly new to us, it’s just a baby step, but we hope to build on it.
BL: Which data resources or digital tools do you manage that have the greatest opportunity for good?
CS: I built a tool a couple of months back for the Zoning Board of Appeals. Obviously building and housing is a big thing in Boston with the way prices are. But I built a mapping tool through ESRI to show where all of their zoning appeals are taking place, what stage they’re at, what date the hearings are, because of course people want to keep tabs on what’s going up in their neighborhood, is it equitable, how is it going to affect my property? That received a lot of attention, apparently—I was surprised. The public started really engaging with that to figure out what was going on in their neighborhood. But the project I am working on with Maggie for the asset inventory of the parks, I think that will be great when we are able to come out with a public dataset. Maggie has focused a lot on accessibility for the different assets within parks. If you’re someone who needs different accessible playgrounds, benches, whatever, you can just hop online and find the park that may have the best resources for you.
MO: Yeah, or if you’re a caregiver and you need access to a restroom or what have you, we have those different sorts of information that people can look at before they decide to visit a park.
BL: How do you define public engagement? What does it mean for a public data constituent to be “engaged” with parks data?
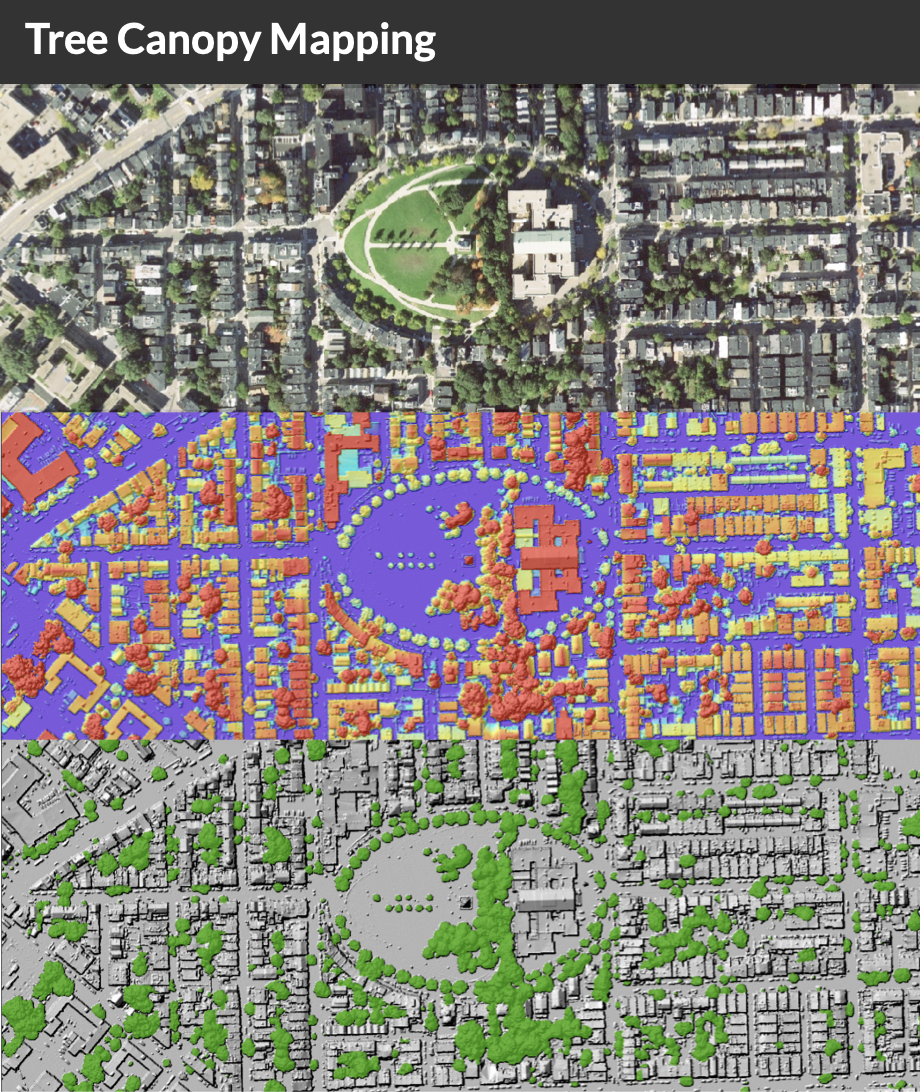
An excerpt showing how tree canopy data is extracted from aerial imagery, from the 2021 Tree Canopy Assessment report
MO: From my (still growing) experience, especially with inquiries about the urban forest plan set of materials, there are different ways people want to engage. You have the already interested constituent who is looking for more information, and the map or other geospatial information can help answer their questions. They’re usually the first ones to notice that we’ve put up a new map. Then you have people who may not know they are looking for maps or data, but the data ends up playing an important role in the storytelling experience, so we try to make it available in lots of different formats, like a StoryMap or PDF. And then there are people who really do want to work with the basic data itself. And process it.
With the Parcel Priority Plan, we put the map in a PDF format, and while you give up a degree of exploration, one of the ideas is that it’s more friendly towards people who may be less technologically-savvy, but also it would be easier for community leaders, because with that project in particular, community leaders were really vital to spreading word, so they could download the PDF and put that imagery into any presentation or share it out easily. So that was one idea about helping with the planning process itself, letting it be distributed more easily.
BL: Do you have an “ideal” public data user, and what skills would they need to have to work with your geospatial data resources?
MO: I don’t really frame it as who is the ideal user, I frame it as how can I be the ideal for them. Take the Open Space shapefile. If you just display that on a map – internally and externally we see this – without looking at the metadata, it’s all green, you just see a bunch of green polygons on the map, and it’s like wow, we have an amazing open space system. But there’s nuance there that would tell a more accurate picture, and we can’t expect people to look at the metadata. So how can we responsibly frame information, especially when it comes to graphic representation of data in a way that people realize whether their questions are being answered or not. So that’s often the challenge, I think. Making people understand whether their questions are being answered, and that can be, depending on the user, providing different sorts of guidance.
BL: What opportunities does the public have to shape the data itself, meaning the values which actually get encoded and the questions the dataset is designed to answer?
MO: I think that is probably one of the most challenging and one of the most interesting questions that we’re facing, at least in the planning arm. One of the things that we’re looking at is revisiting how it is that we come up with survey questions, so there’s that one approach. But that’s just one piece of it. And so I would say that I don’t have a great answer for you, other than that we’re really looking at it and are open to ideas and starting those conversations with different groups, such as with the Leventhal Map & Education Center, to figure it out.
BL: Perhaps you could discuss some of the challenges.
MO: Yeah, so, you have a degree of acculturation. So, are people used to having conversations around maps? Looking at them and interpreting them? And the different visualization techniques? Who are you hitting upon when you bring a map into the conversation? And taking a step back, is a map the right choice at all — or what is the appropriate visualization for any given dataset. Finally, how can you hand decision-making and representation into the hands of people who are different than yourself, and we see that as an effort throughout the planning process — how do we find ways to hand power over to the community? That extends to structuring the questions, the survey questions, and the visual representations in ways that are culturally meaningful to people and perpetuate the values we hold as a society. I think it’s important to find ways to add the humanity back in to the data and why these questions are being asked and give them a context in the time and place they were asked and structured around. So those are some of the challenges.
Learn more
- Check out these BPRD Resources:
- Read the LMEC announcement about an upcoming exhibition on environmental justice
- Register for LMEC’s upcoming data and society focused talk series:
- How Communities Use and Refuse Data About Themselves
- How Maps & GIS Data Underpin the Digital Economy
- Activists' Data Practices, Social Justice and Cultural Mapping for Cultural Equity
- GIS & The War on Crime and Drugs
Our articles are always free
You’ll never hit a paywall or be asked to subscribe to read our free articles. No matter who you are, our articles are free to read—in class, at home, on the train, or wherever you like. In fact, you can even reuse them under a Creative Commons CC BY-ND 2.0 license.