The allure of seeing the world from above is so closely associated with the discipline of geography that some degree programs even suggest that students who “prefer the window seats on airplanes” might be potential future geographers. And while there are many reasons to be cautious about the totalizing perspective of the “God’s-eye view,” aerial images still nevertheless invite us to observe spatial structures both grand and intimate, and to interrogate how the patterned ground on which we live came to take on its visual form.
Some of the most interesting aerial observations emerge from repetition in the landscape—both built and natural forms that occur time and time again. When I was working on developing our Insizeor tool, I tried a few different processing techniques for clipping out sections from an aerial image layer. Using one of these techniques that I didn’t eventually need for Insizeor, I started to experiment with what it would look like if I created rapid animations based on repetitive features.
Animations are eye-catching, but I quickly realized that it would be more interesting to array these aerial cut-outs next to one another, in order to create a visual pattern system that also allows the viewer to identify and explore each one of the images. And so Bird’s Eye Cards, the latest @bplmaps Glitch visualization, was born:
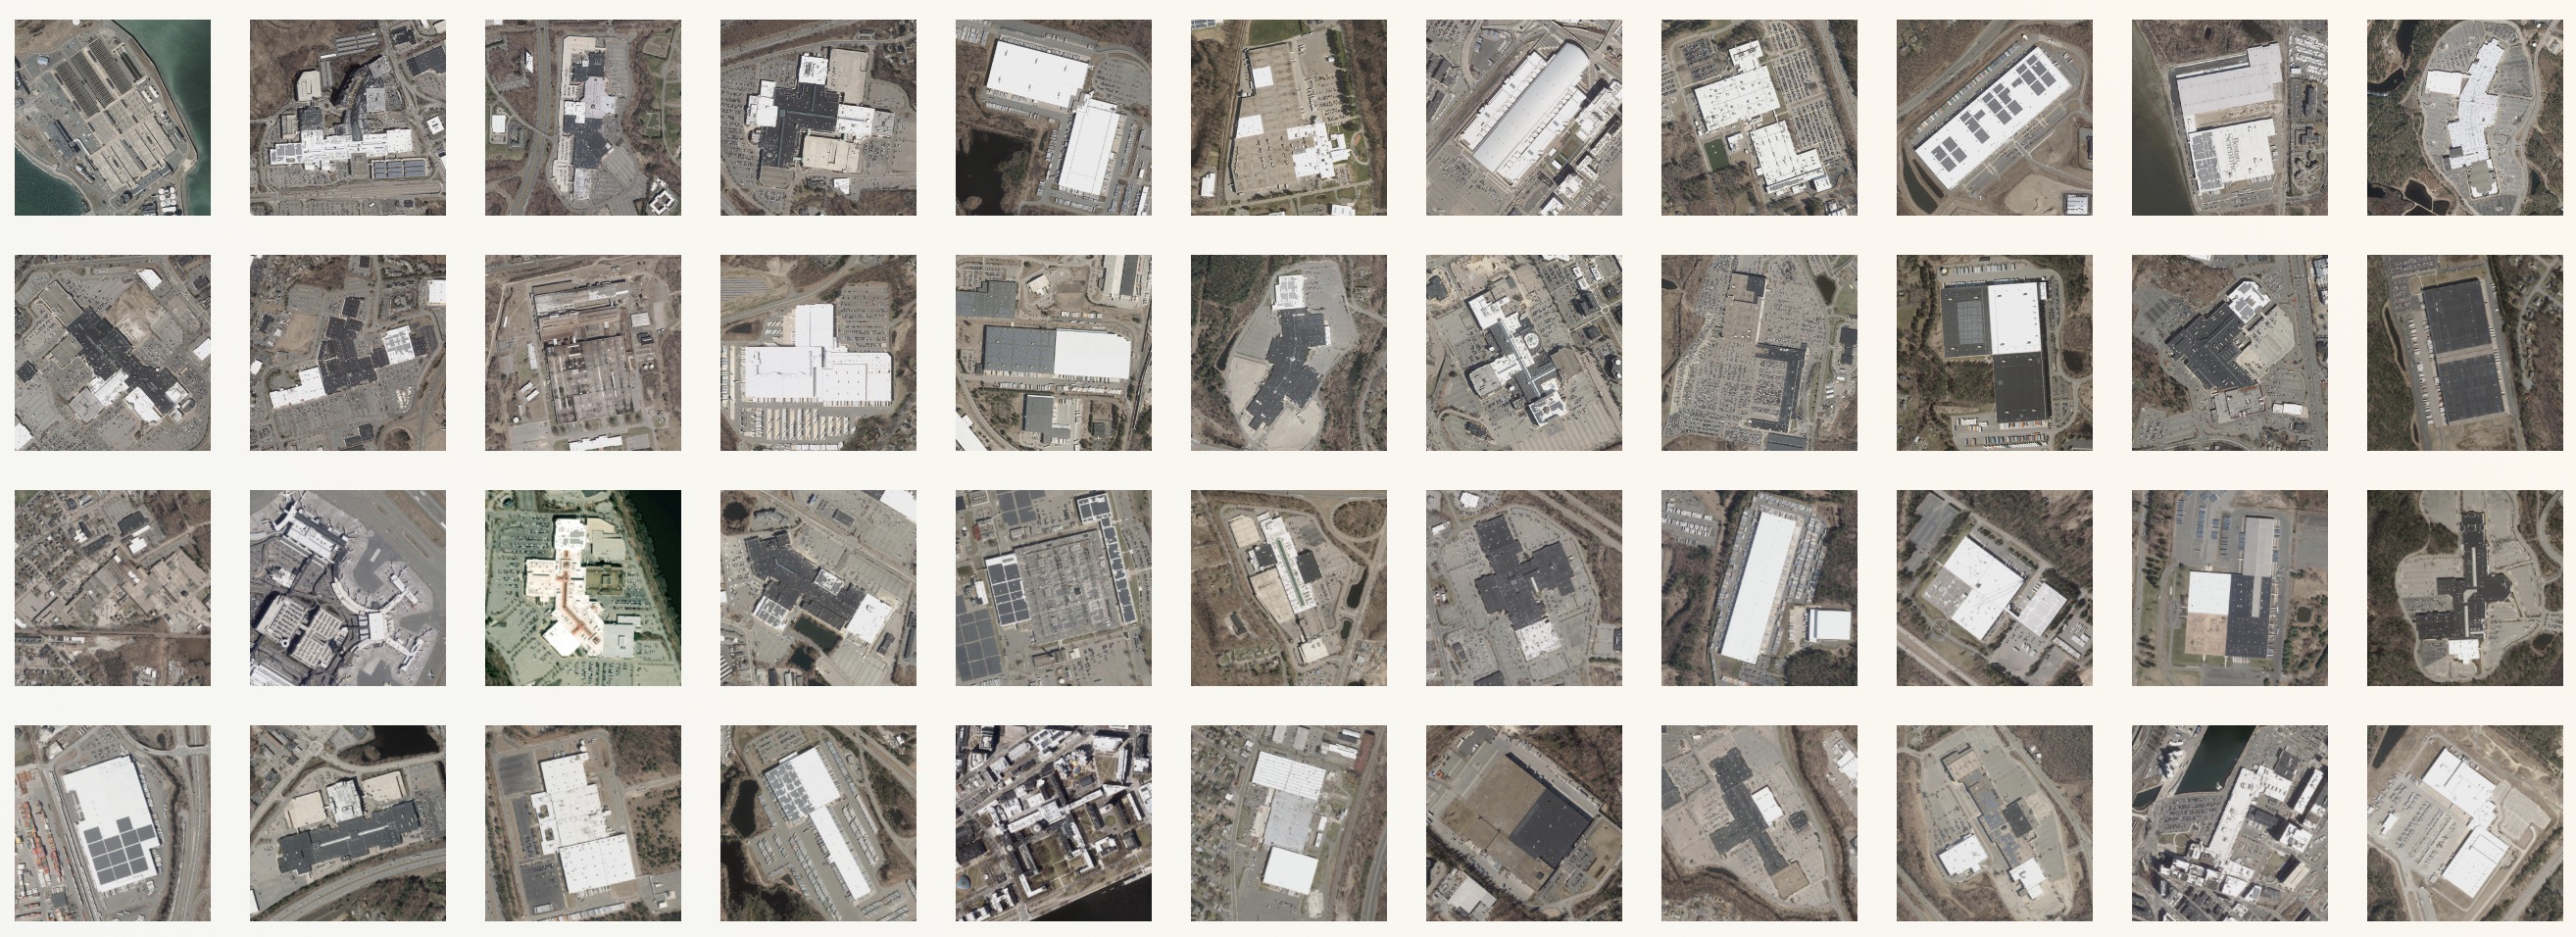
I started out by working with statewide data on Massachusetts, zooming in on the state's largest buildings (The largest of all is the MWRA wastewater plant on Deer Island). Some interesting patterns already begin to emerge here: we see malls, surrounded by enormous moats of parking; warehouses, with semi trucks lined up at their sides; and, in a few cases, solar panels that have been installed to make use of what would otherwise be wasted empty roof space.
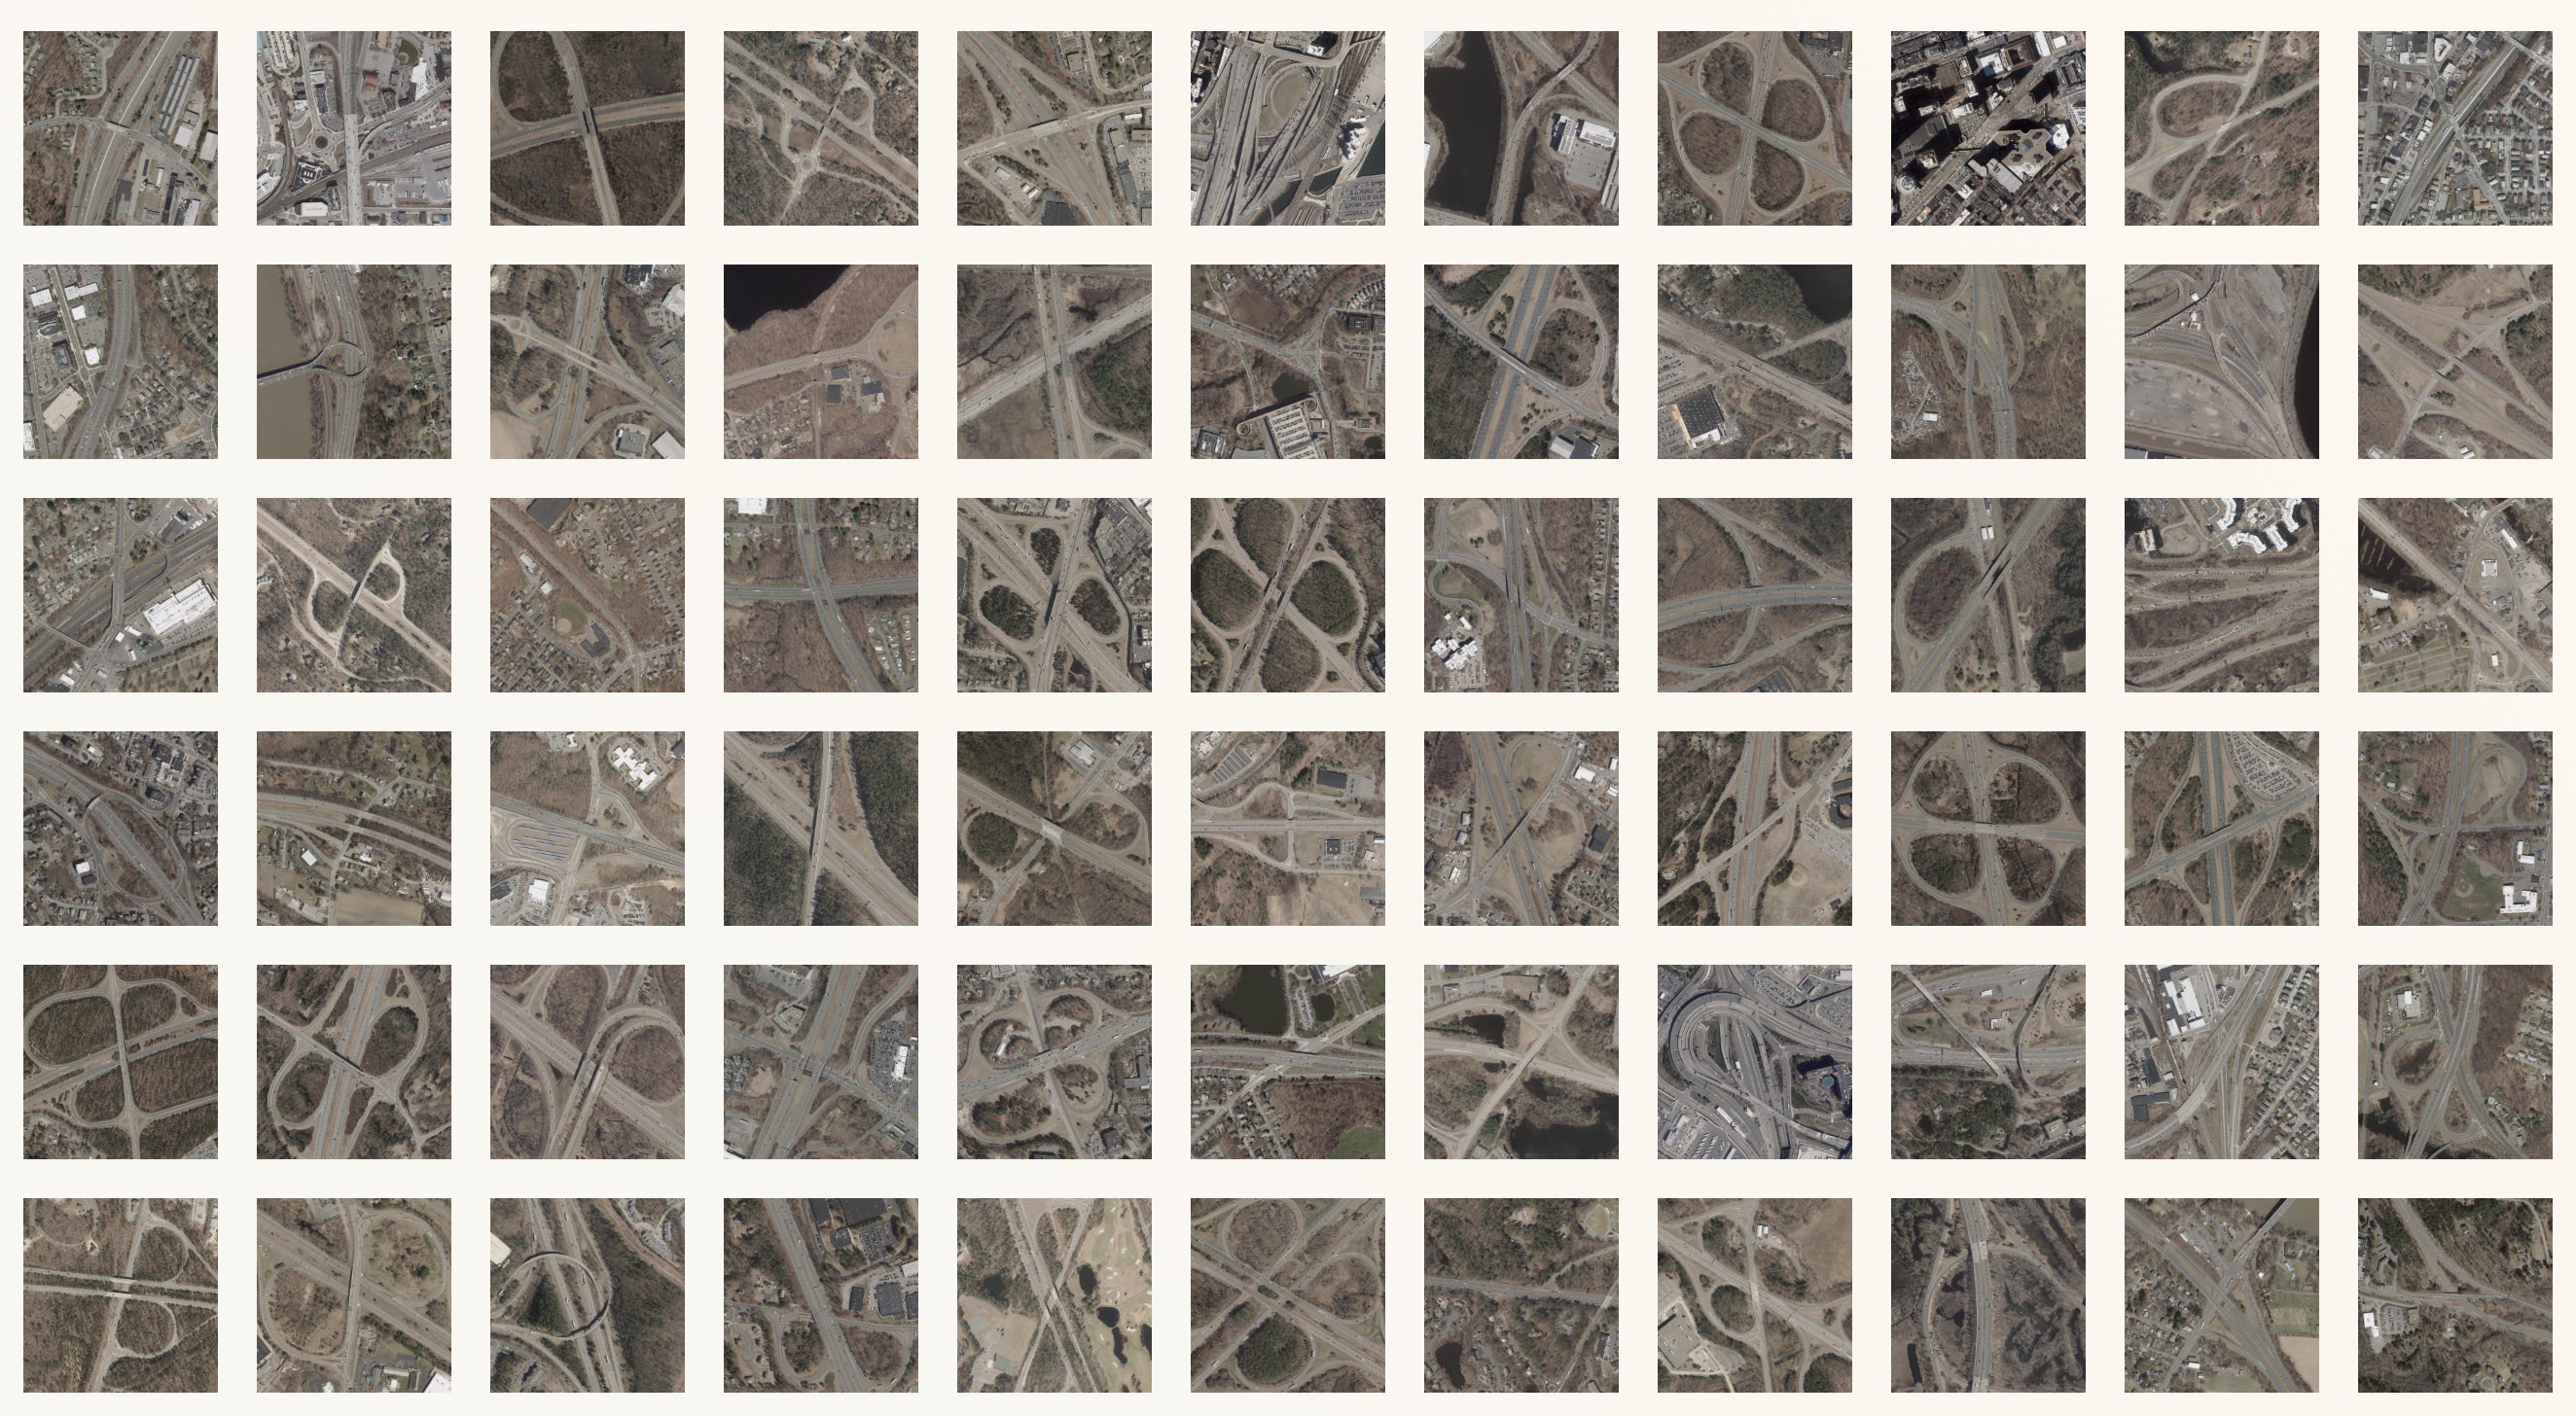
The built environment is full of similar large features with recognizable land use patterns. Here's every controlled-access highway interchange in Massachusetts:
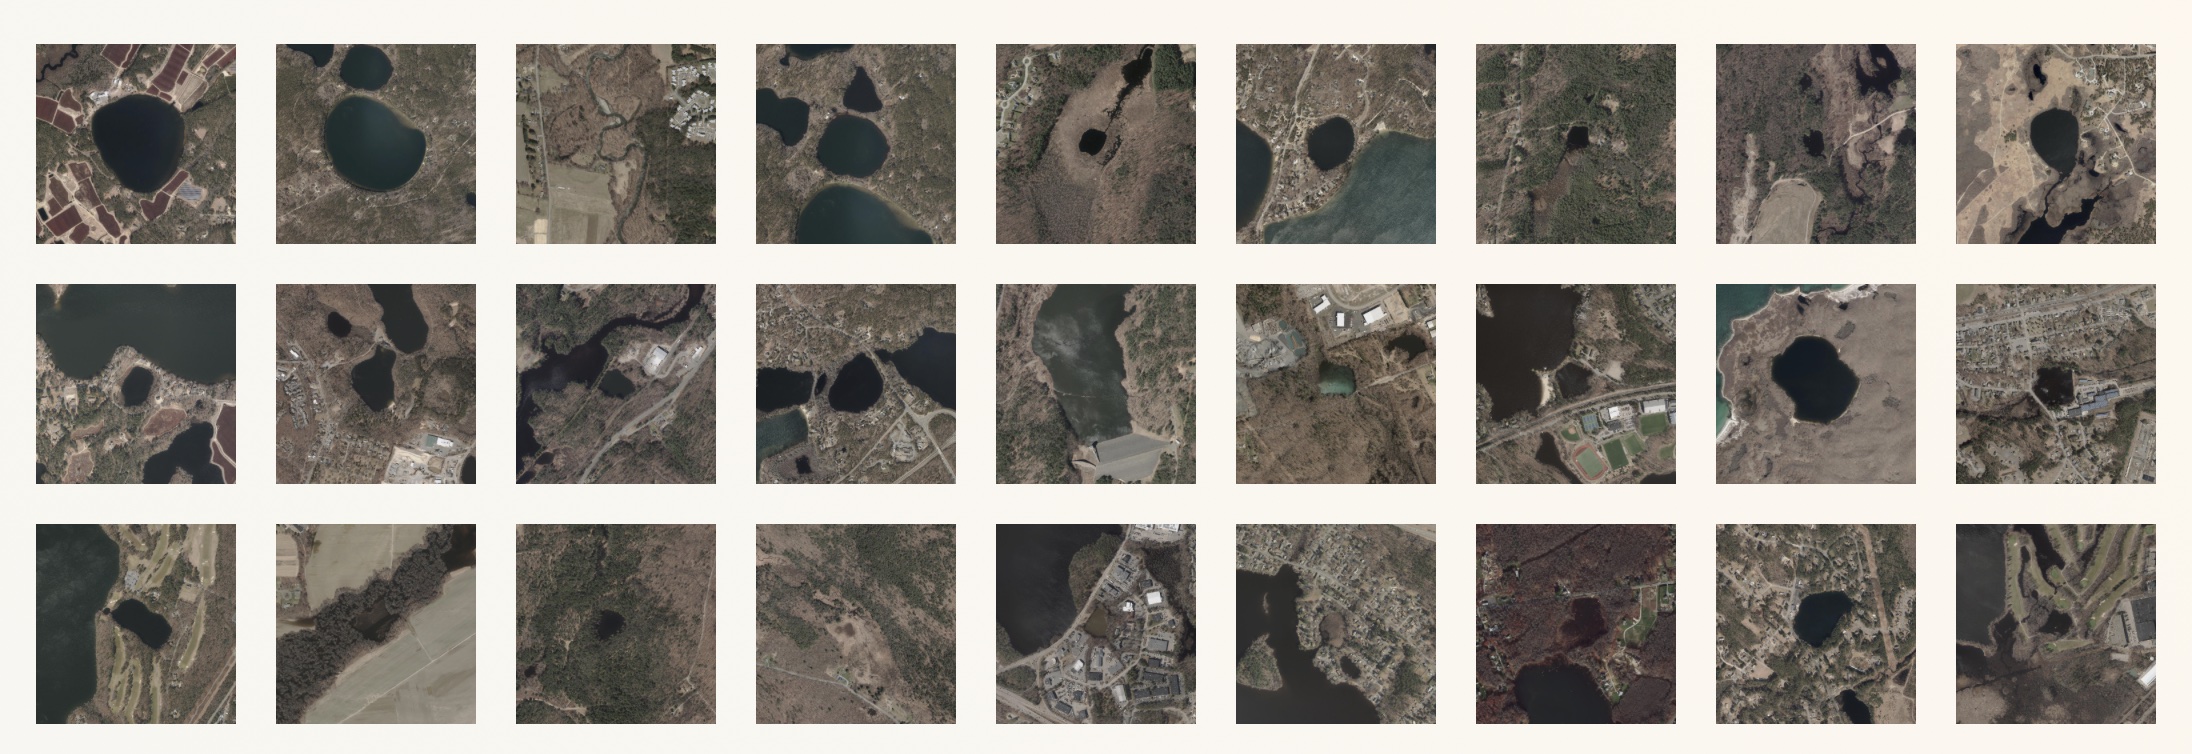
Then I began to wonder about natural features. While many elements of physical geography, like soil types or topographic features like eskers, are more easily visualized on a drawn map than in aerial imagery, I was curious about one kind of glacial landscape that should be fairly recognizable from the air: glacial kettle lakes. I couldn't find a GIS data set specifically identifying kettles, so instead I tried a bit of geospatial computation by calculating the "roundness" of every inland waterbody in the state. That produced this set of images, in which many kettles are represented:
Our current exhibition, More or Less in Common, is all about the interplay between the "natural" environment and social systems. In the exhibition, we talk about how environmental degradation and social marginalization often occur simultaneously, to the extent that neighborhood income is one predictor of how many trees are in a neighborhood. Therefore, I was curious to look at what we'd see from the air when looking at the richest 100 and poorest 100 (by median income) Census block groups in Massachusetts:
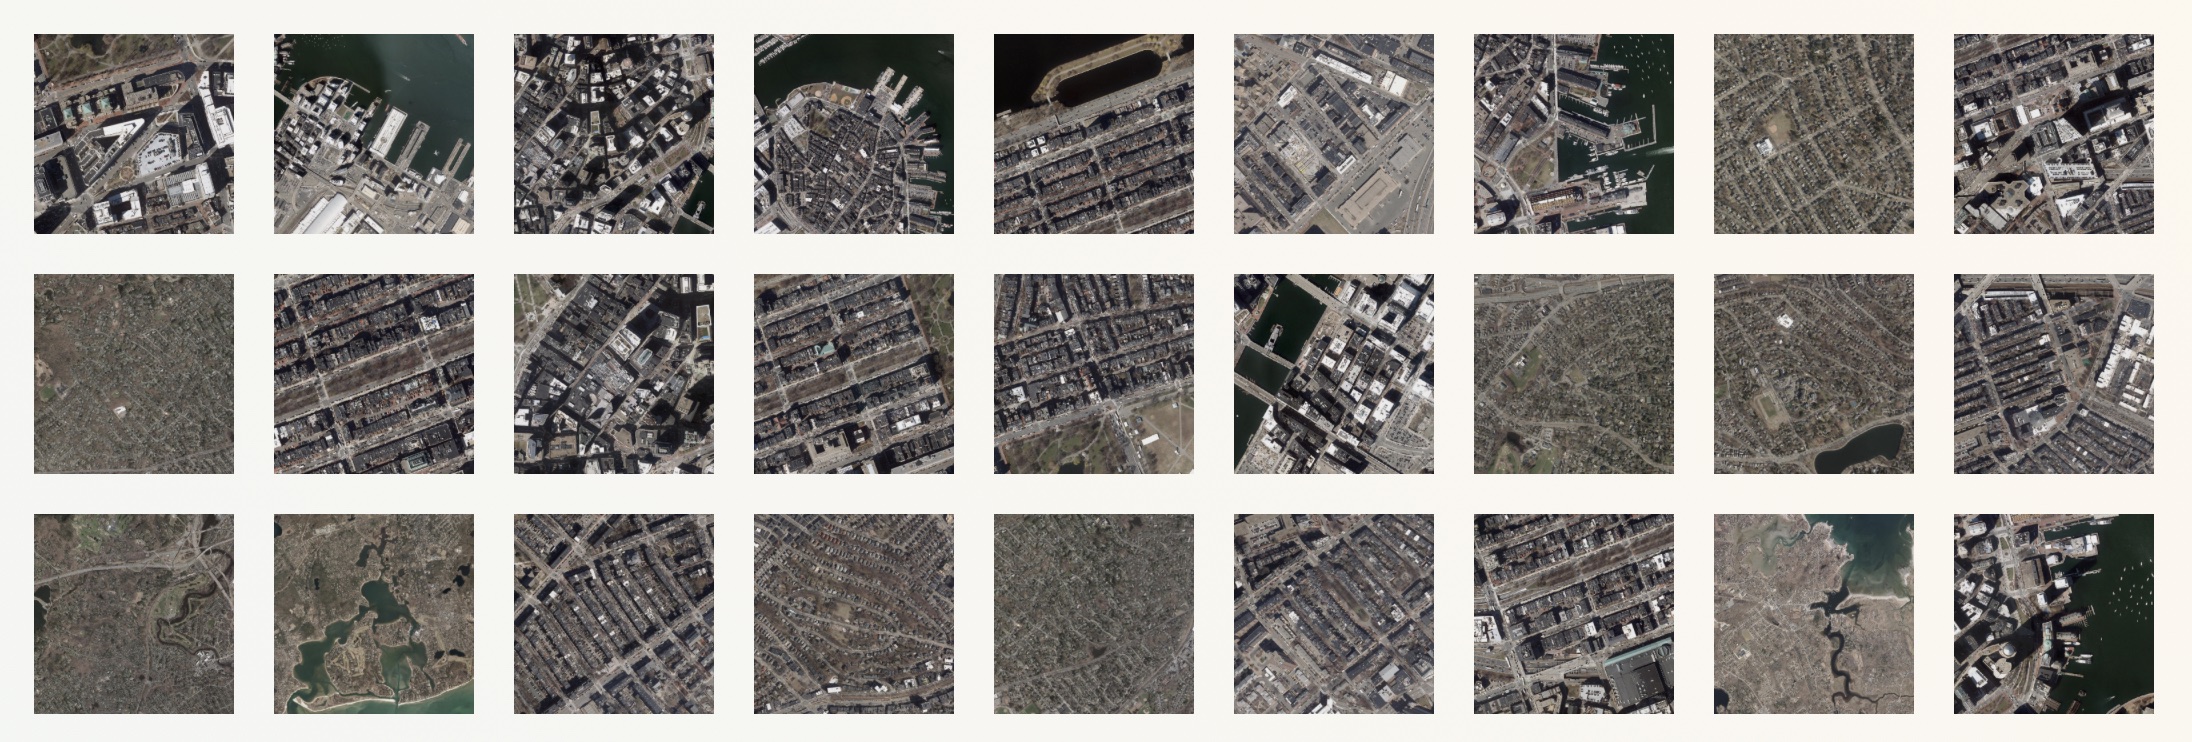
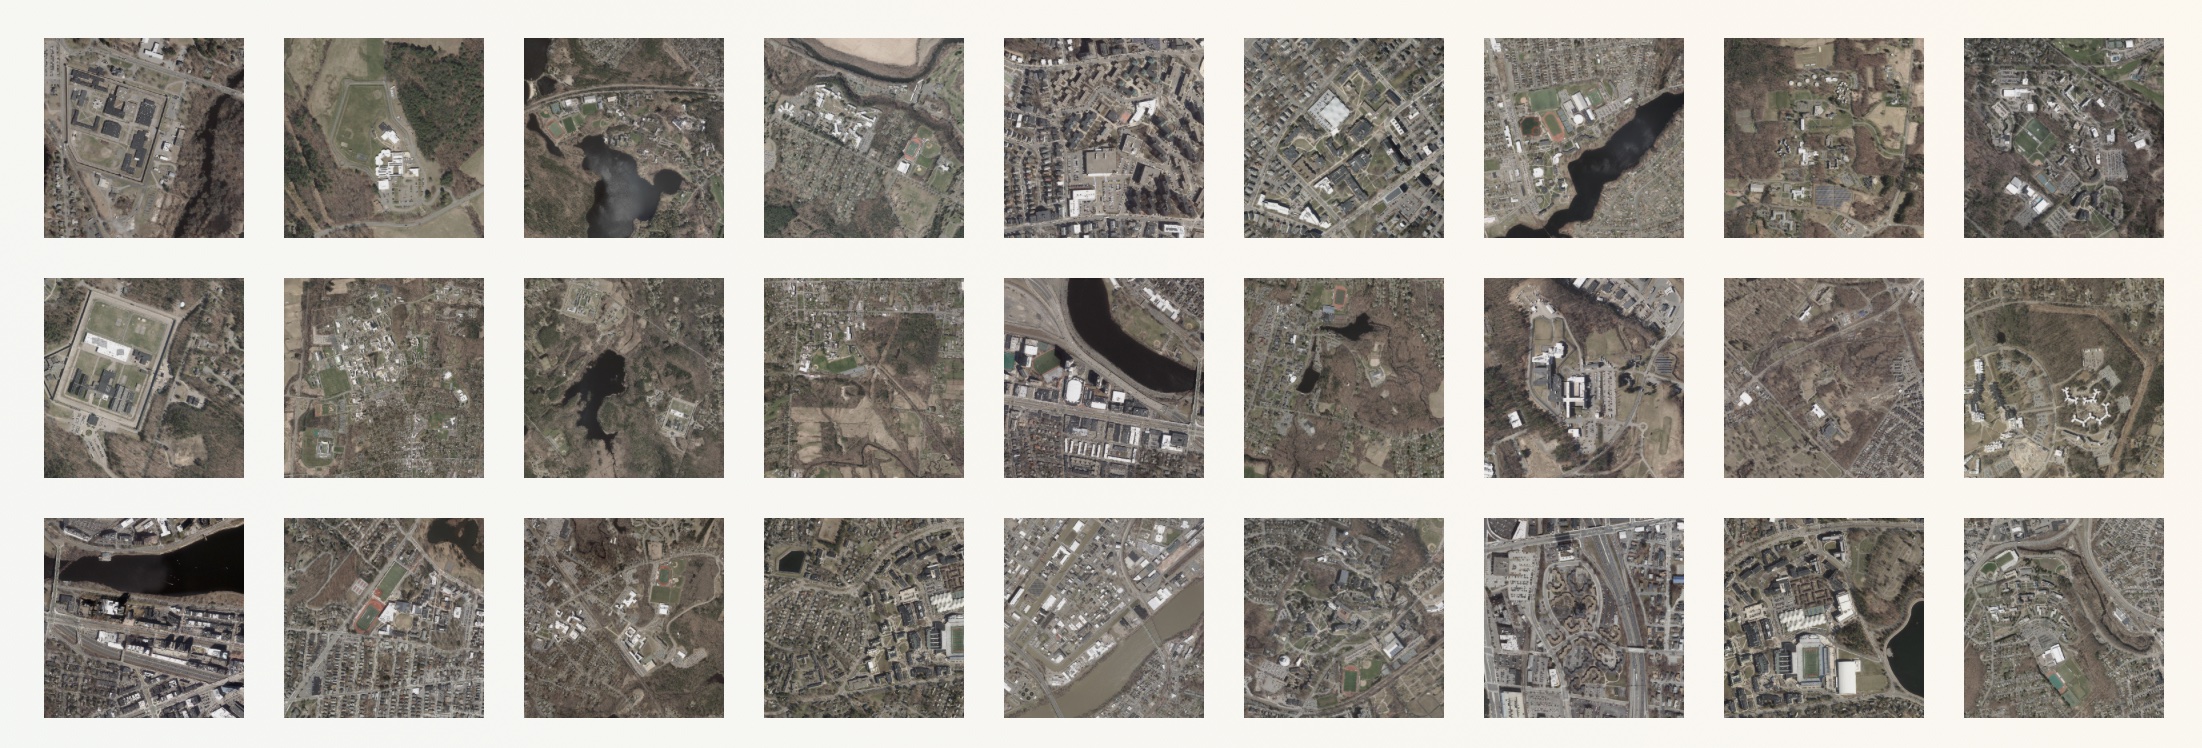
Perhaps unsurprisingly to anyone who's visited More or Less in Common, you can easily pick out some common types that align with the spatial structure of social inequality. Amongst the high-income blocks, we see a lot of leafy, single-family medium-density neighborhoods in places like Arlington and Brookline, along with deep green-and-blue recreational and resort areas along the coastline. Interestingly, inner urban neighborhoods are also well represented here, especially historic districts like Boston's Back Bay.
By contrast, the lowest income blocks are almost entirely institutional land uses. That includes colleges, which are a bit of a statistical outlier (Harvard Yard and Wellesley College are both amongst the "poorest" blocks in Massachusetts, due to the low individual incomes of most undergraduate students.) But it also includes the places like prisons and public housing blocks. What remains of the low income blocks not dominated by institutional building types are older neighborhoods in working-class cities, places like Chelsea, Worcester, Springfield, and Roxbury where worker housing from the nineteenth century has been repurposed into rental homes.
Want to explore more yourself? Try out the full Bird's Eye Cards visualization or remix the code on Glitch! Have an idea for a feature that you'd like to see us add to the visualization? Drop us a note or tag us on social media @bplmaps.
Our articles are always free
You’ll never hit a paywall or be asked to subscribe to read our free articles. No matter who you are, our articles are free to read—in class, at home, on the train, or wherever you like. In fact, you can even reuse them under a Creative Commons CC BY-ND 2.0 license.