Atlascope, a digital project developed by the team here at the Leventhal Map & Education Center, allows for the geographical exploration of Boston through history. Close to a hundred historic urban atlases from the especially transformative period between 1861 and 1938 are made uniquely discoverable through Atlascope's easily browsable and searchable web interface, a transformation which represents the culmination of years of work and technical design and development not fully visible from the surface.
Before I explain (and ruin the magic of) any of the inner workings of Atlascope, I’d like to highlight the fascinating moments of wonder it can generate. Atlascope’s outwardly simple arrangement of human geography, urban history, and digital accessibility, is uniquely positioned to spark curiosity in a way which engages the very personal connections to the places we live in and the histories we are a part of. We want to know what our neighborhoods used to look like, how our city has changed along with its citizens, our neighbors and ancestors, in order to form the communities we now belong to.
The overlay of a 1902 Bromley Atlas on top of present day Boston in Atlascope. We can see how more than 100 years ago the Central Library shared the city block with Harvard Medical while the area which is now the Prudential Center was a sprawling railyard. Note the Lenox Hotel in both the satellite view and the 1902 atlas.
Using Atlascope we can directly visualize a constantly shifting urban world, reinventing itself over many decades. In a seamless manner, we see how the streets we know personally are planned out, laid out, and integrated into all the complexities of a city as historical as Boston. Tramways, storefronts, industries, all appear and disappear, while the construction of any one specific building could be a part of countless personal geographies, as a childhood home, family business, workplace, or any other cherished part of the city.
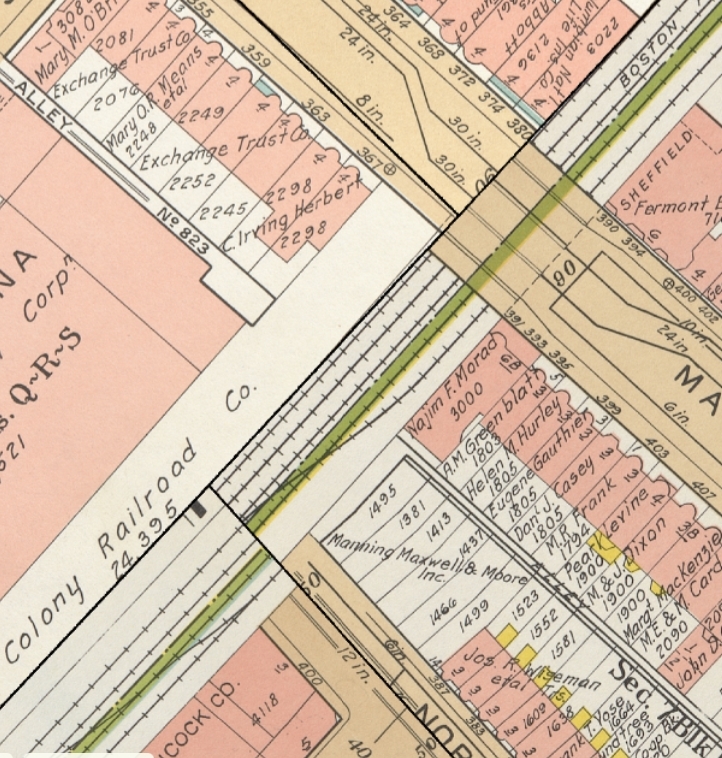
The imperfect meeting point of three distinct atlas plates on Atlascope, note the misalignment of the railroads in the bottom left, and Massachusetts Ave in the top right. An atlas ‘plate’ refers to the page spreads which the physical atlases consist of.
Occasionally it’s hard to ignore a jagged disconnect across the width of a road or the uneven presentation of certain features straddling municipal boundaries. In the midst of a wonderstruck historical journey it's easy to forget that Atlascope is a digital tool developed over the course of many years by the skilled (and hopefully forgiving) minds at the Leventhal Center. Like any human-made tool, it is not perfect. These ruptures and inconsistencies don’t merely represent the end of our curiosity, but rather a redirection toward a struggle which in many ways encapsulates much of the work we do here at the Leventhal Center.
There is a fundamental gap to be bridged, between the Leventhal Center’s mission to foster curiosity and understanding to all, and the more than quarter million items in our collection—representing daunting rows and stacks of atlases, maps, and other artifacts. It’s an unfortunately unavoidable fact that the sheer density of information and history contained within our vault is inherently inaccessible to the public.
In Atlascope, and especially thanks to its occasional missteps, the journey to overcome this inaccessibility is perfectly exemplified for us to see. Occasional misalignments mark the edges of the thousands of individual atlas plates which are digitally stitched together to form Atlascope. Occasional handwritten marks and notes remind us that these were once tools in their own right, as the material components of larger atlases. Abrupt shifts across municipal lines represent the original extents of these atlases, which served as very detailed, very technical, and very expensive data sources for the fire insurance and real estate industries.
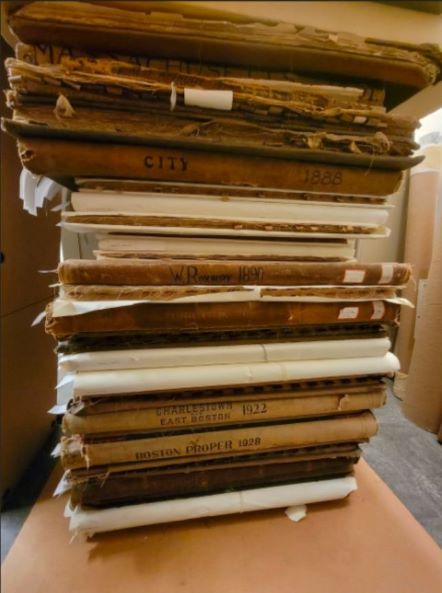
A stack of some of the urban atlases in LMEC's collection, also demonstrating their often fragile conservation status.
In fact, “larger” is definitely an all-around good way to describe these urban atlases, each being close to two feet in length and unwieldy in almost every regard, not just physically but also in terms of the overwhelming amounts of detail contained within them. There is considerable cumulative effort which has gone into transforming these bulky atlases, hopelessly dense and hard to use, into the easily learnable and curiosity provoking interface of Atlascope, free to access on any web browser anywhere.
In this journey, the physical atlases are first digitized page by page, their digital versions then meticulously georeferenced to align to real geographical locations before they are transplanted and digitally fitted together like puzzle pieces into the final contiguous map of Boston which forms Atlascope. This process is not just exceedingly technical in its own right, but also one which has occurred over the course of many years and across many separate projects and efforts, of which Atlascope is only a culmination.

Ian Spangler, Assistant Curator of Digital & Participatory Geography
To help explain the scope and complexity of the efforts which produced Atlascope, I spoke with Ian Spangler, Assistant Curator of Digital & Participatory Geography here at the Leventhal Center. The text of this interview has been lightly edited for clarity.
Ian, first off, can you give us an idea of where we’re starting from when it comes to Atlascope, in terms of working with physical collections material and these bulky atlases?
I haven’t actually had to use the original atlases in any meaningful way, mainly because their digitized versions have always been readily available to me, which I think highlights one of the main goals of Atlascope as being more about consolidation, into a format which is as intuitive and natural as possible for a user to interact with.
There was a problem of sheer quantity, but also the widely unconsolidated batches and collections of atlases, with not a lot of coordination between individual institutions’ digitization efforts. For example, the Library of Congress has a considerable and nation-wide collection of Sanborn fire insurance atlases, many of which are available to view online, which represents really valuable work entirely distinct but moving in a parallel direction to similar efforts at the Leventhal Center.
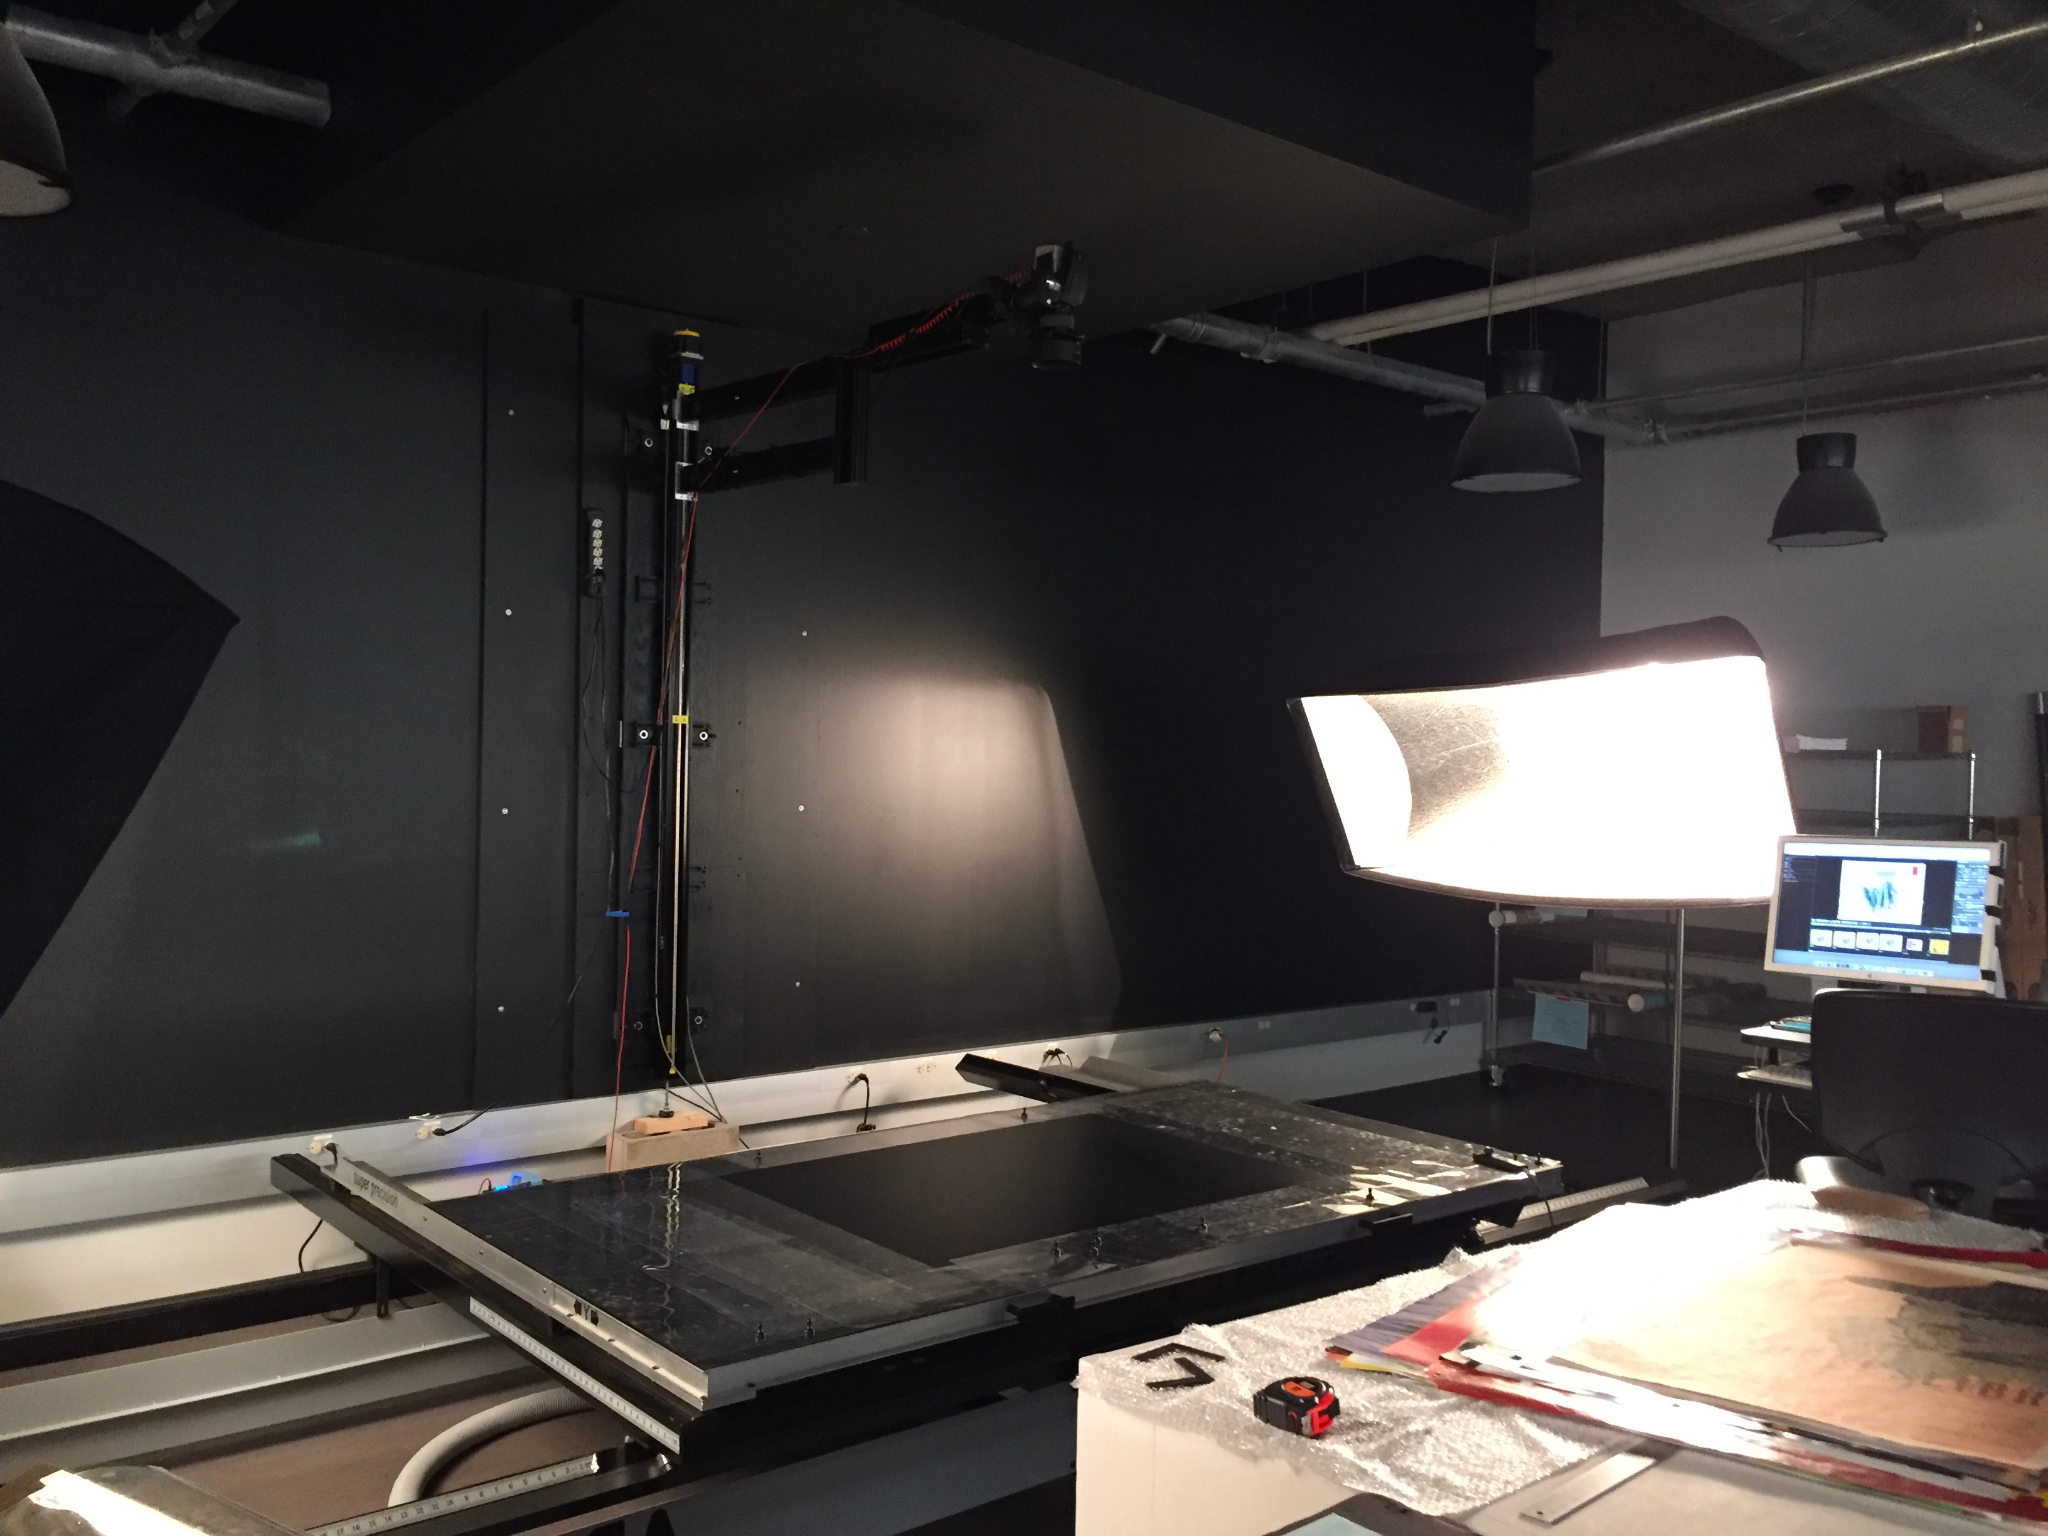
The journey towards Atlascope begins in the digitization lab, where the physical items in our collection are scanned and transformed into digital versions available online.
The next problem is that these digital versions are available in a format which is in many ways entirely based on the format of the original reference atlases. While this form of digitization does provide the benefits of internet accessibility and functions like panning and zooming, users are still expected to seek out specific atlases in the database, and then digitally flip through its pages using the original index material to find their desired location. A process not in tune to the natural intuitions of contemporary users, used to free scrolling and searchable addresses.
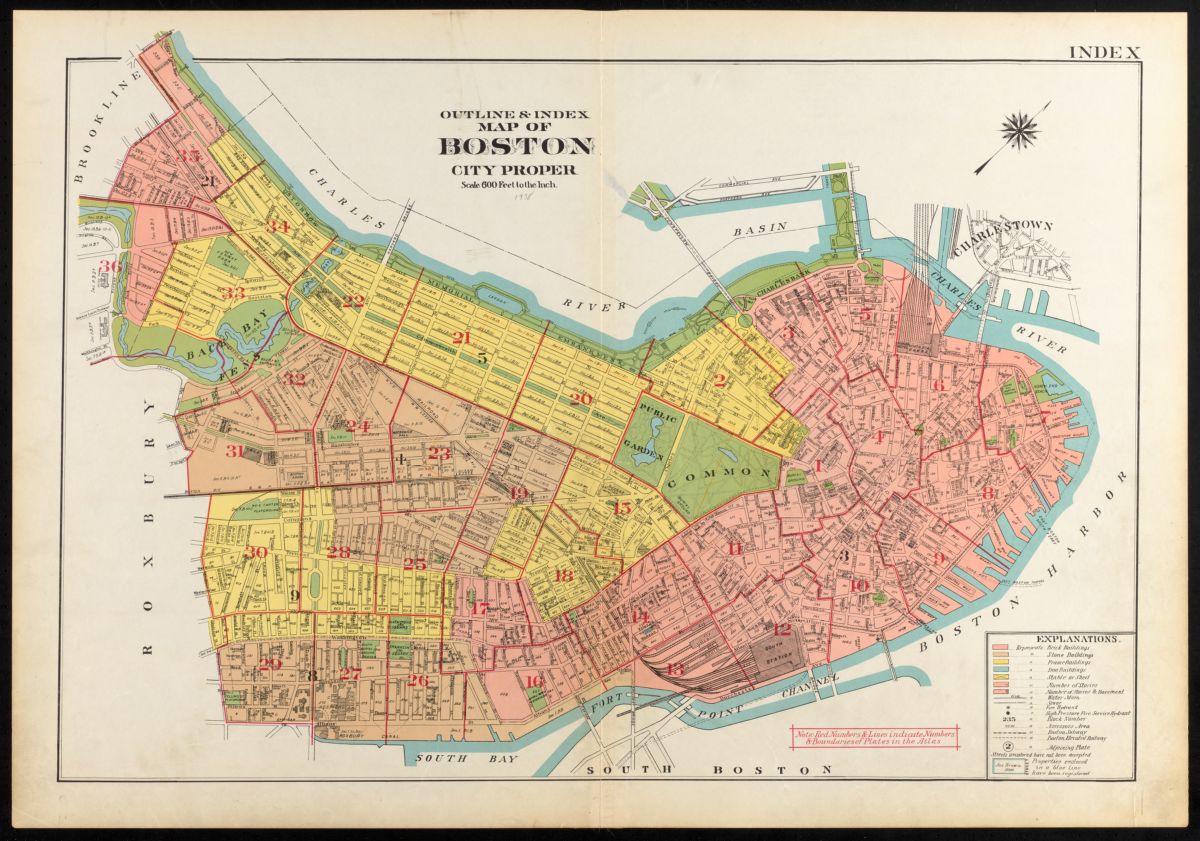
Each numbered section on the index of this 1938 Bromley Atlas of the City of Boston corresponds to a specific plate in the atlas. A user would identify which area they wished to investigate on the larger scale index map, and then flip to the specific plate for the ‘zoomed-in’ smaller scale and highly detailed depictions which the atlases are known for.
A big part of creating these resources is the georeferencing process. Can you walk us through that process and how it culminates into something like Atlascope?
There’s a similar problem with the georeferencing process with consolidation, but also an interesting one here with accessibility and natural intuition on the development end. The amount of data, the amount of atlases, which need to be processed mean that getting the most out of your person-hours is really important. Traditionally, georeferencing involves interfacing with spatial data through the kind of very technical and hard-to-learn software which we basically had to be trained to use, going through map by map, and linking coordinate points in the real world to pixels on the digital map.
The basic idea of georeferencing, visible in the creation of ‘ground control points’ (GCPs, in red) which link between real world geography and a historical atlas. The process depicted here is done through the Allmaps Editor, which allows for the georeferencing of any IIIF maps with relative ease, as GCPs are created at the click of a button.
In the process of creating Atlascope we were able to cut down on a lot of the complexity by integrating our work with other initiatives. First is IIIF (Inter Image Interoperability Framework), the kind of thing librarians get really excited about that no actual person will ever know about. It’s basically an initiative between different institutions to standardize the accessibility of digital materials between collections, so you’re not dealing with a bunch of different formats that can’t necessarily ‘talk to each other’ in the way you need them to. This makes a lot of cool things possible such, as allowing for a new kind of georeferencing process facilitated by a program called Allmaps, which is, pretty amazingly, largely the work of one man: the very enthusiastic Bert Spaan.
IIIF means that the mess of unconsolidated digital map collections I mentioned earlier are in a position to be presented in a more unified way. Allmaps uses this to allow for the georeferencing of any of these IIIF maps entirely on the web (without the need for downloaded software) in an online interface which is intuitive and easy to learn. This gives us the flexibility to hire interns to perform georeferencing work, and an overall efficiency which makes Atlascope, as an intuitive and accessible final product, possible.
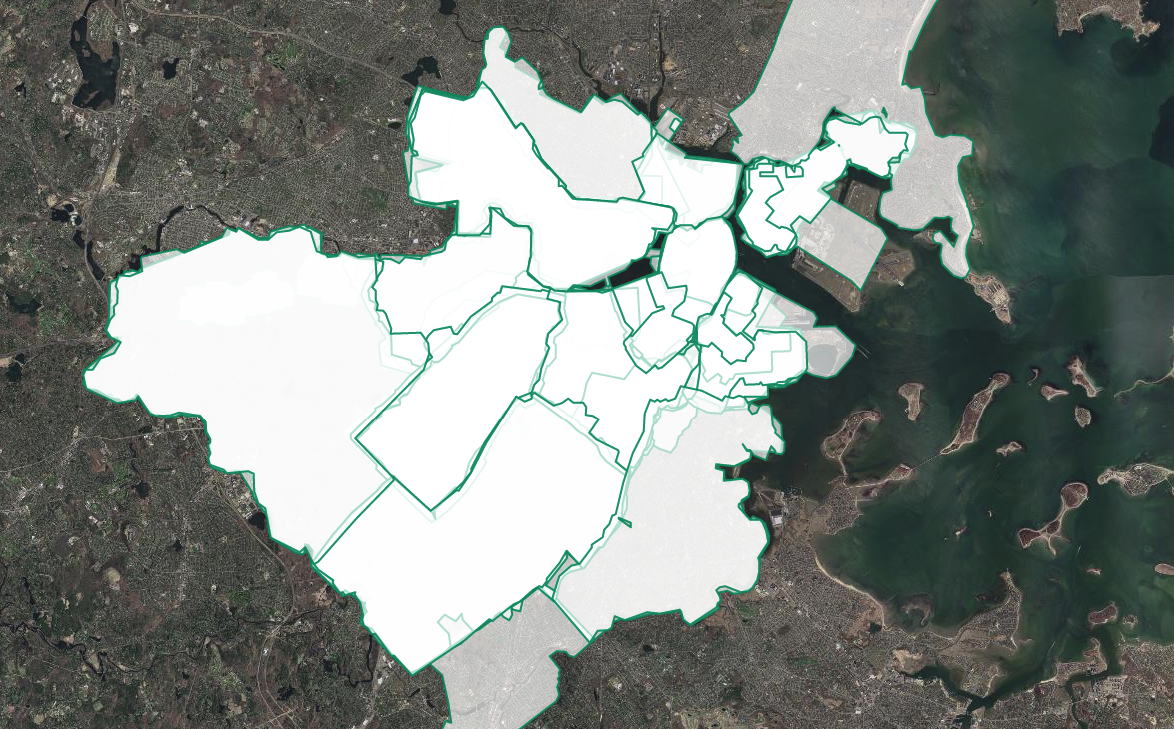
The 'final product' of Atlascope consists of ~100 historical layers from distinct atlases each with distinct geographic coverages. This behind-the-scenes snapshot shows the numerous, overlapping, and multilayered geographic coverages included in Atlascope, each corresponding to the extent of an actual historical urban atlas, each in turn composed of dozens of individual plates.
With all this talk of consolidation and intuition, I’d like to hear more about your thoughts on the final arrangement of Atlascope, and what makes its digital interface so effective?
I think it’s really all about spontaneity and the thrill of discovery, and the key question of how we engage with our technology. In the older formats, the atlases themselves or their digitized versions, the user had to go in with a question, a research inquiry, or a specific address to be investigated, the format simply wasn’t geared towards allowing for spontaneous curiosity and the kind of unexpected threads which you can lose yourself in through something like Atlascope. Now, you have the wiggle room to literally just drift, across different atlas plates and entire atlases, and through decades of historical change.
The dramatic changes which Boston has undergone are easily visible in Atlascope. Here the 64 year span between an 1874 Hopkins Atlas and a 1938 Bromley Atlas helps us visualize the landfill and development process which turned what was once the marshy wetlands of the Back Bay into the bustling urban neighborhood it is today.
This is something which makes accessible a really transformative period in history, really rich for discovery as a time when landscapes were being carved up and people were being displaced in a way which makes all the more critical the very basic question: what used to be here?
The atlases themselves from this time period also represent a really valuable source of information, marking a development in new, very standardized and very rigorous forms of mapmaking, which have so much potential to be reinterpreted and made widely accessible in tools such as Atlascope. All of this comes together to provide the perfect environment for the kind of spontaneity which allows for finding and creating the stories which lie beneath the surface of such detailed maps.
I’m tempted to think that changing a format in such a dramatic manner has some costs as well. Are there any downsides to the creation of Atlascope?
This is a question which I first heard from a student during a university class visit, I think because seeing the actual atlases in person as historical artifacts really drives home how radically different their presentation in Atlascope is from their actual nature. I really think we lose quite a lot in this process, because of the materiality of the books as possessing a time and place and purpose in their own right. I think it’s important to imagine the surveyors and engineers working to create these items not as artifacts but as tools intended as sources of information and understanding through the manipulation of geographic data. Understanding this is I think one of the necessary experiences for understanding geography, since our own efforts are basically the same process, crucially standing on top of and building off of these previous examples.
Our articles are always free
You’ll never hit a paywall or be asked to subscribe to read our free articles. No matter who you are, our articles are free to read—in class, at home, on the train, or wherever you like. In fact, you can even reuse them under a Creative Commons CC BY-ND 2.0 license.