This article is a part of the Get to Know Your Data series, where we talk to the people and institutions that create, store, and share geospatial data. In this series, we ask about how data managers engage with public audiences and grapple with the social lives of the data that they manage.
At the Leventhal Map & Education Center, we are interested in data resources and tools which make it easier to understand more about the places where we live. In this installment of Get to Know Your Data, we sat down with Tom Hopper, Director of Research and Analysis at the Massachusetts Housing Partnership (MHP).
About the Massachusetts Housing Partnership
MHP is a statewide public nonprofit affordable housing organization that works in concert with the governor and the state Department of Housing and Community Development (DHCD) to help increase the supply of affordable housing in Massachusetts.
A few years ago, MHP started the Center for Housing Data. In that short time, they’ve already created two invaluable digital tools for exploring housing data in Massachusetts: DataTown and the Transit Oriented Development Explorer (TODEX).
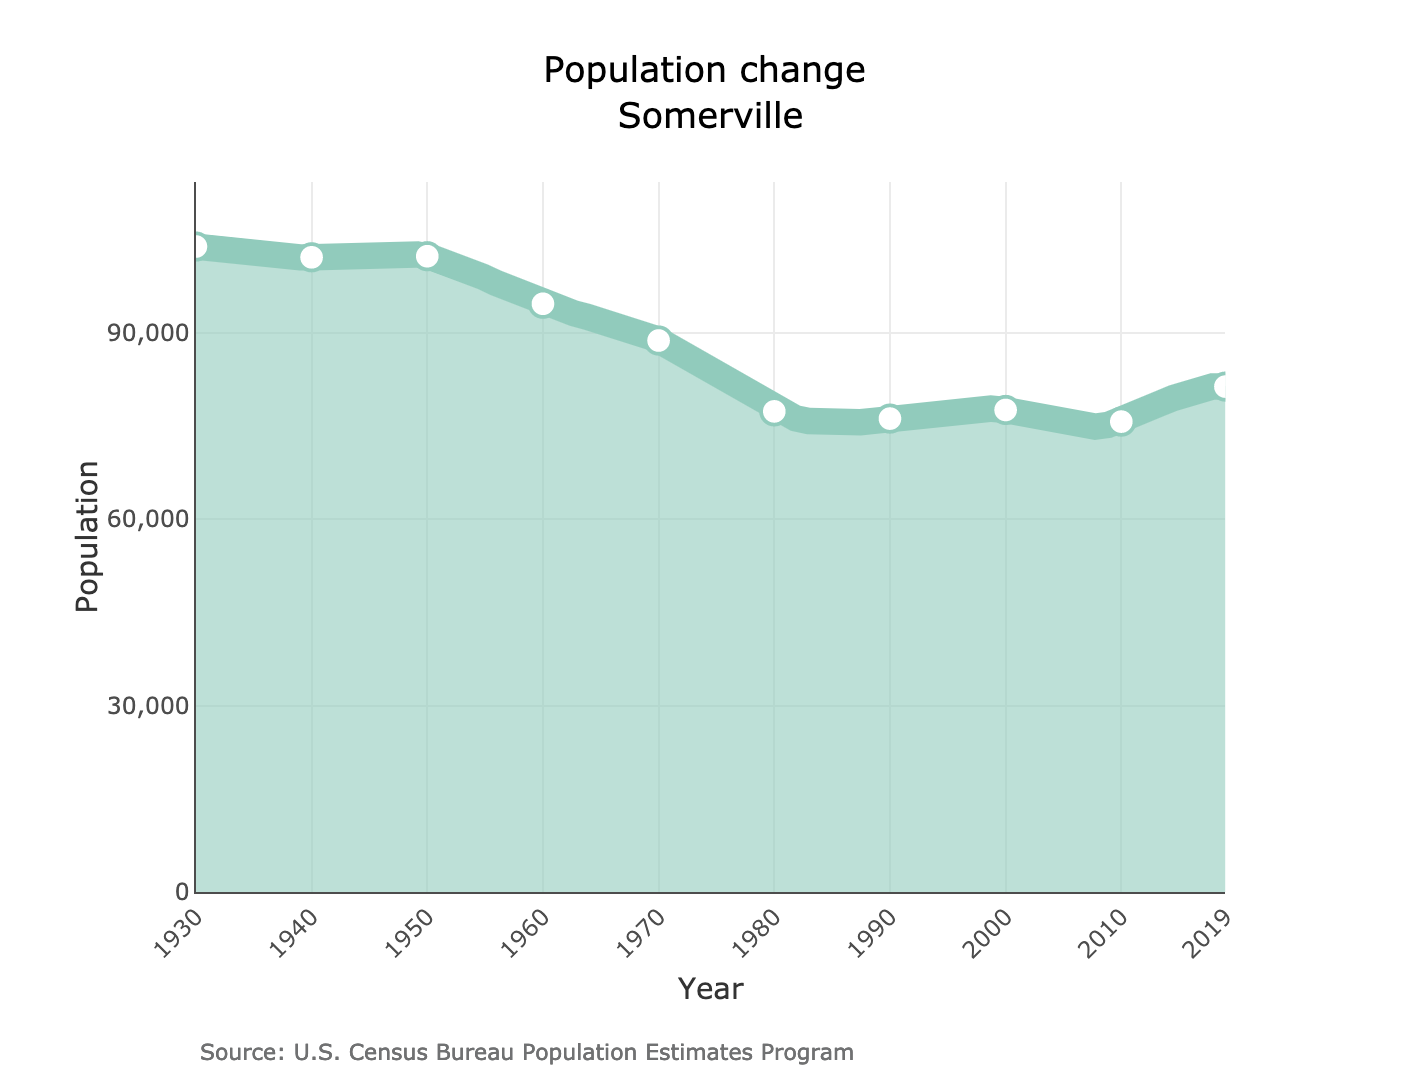
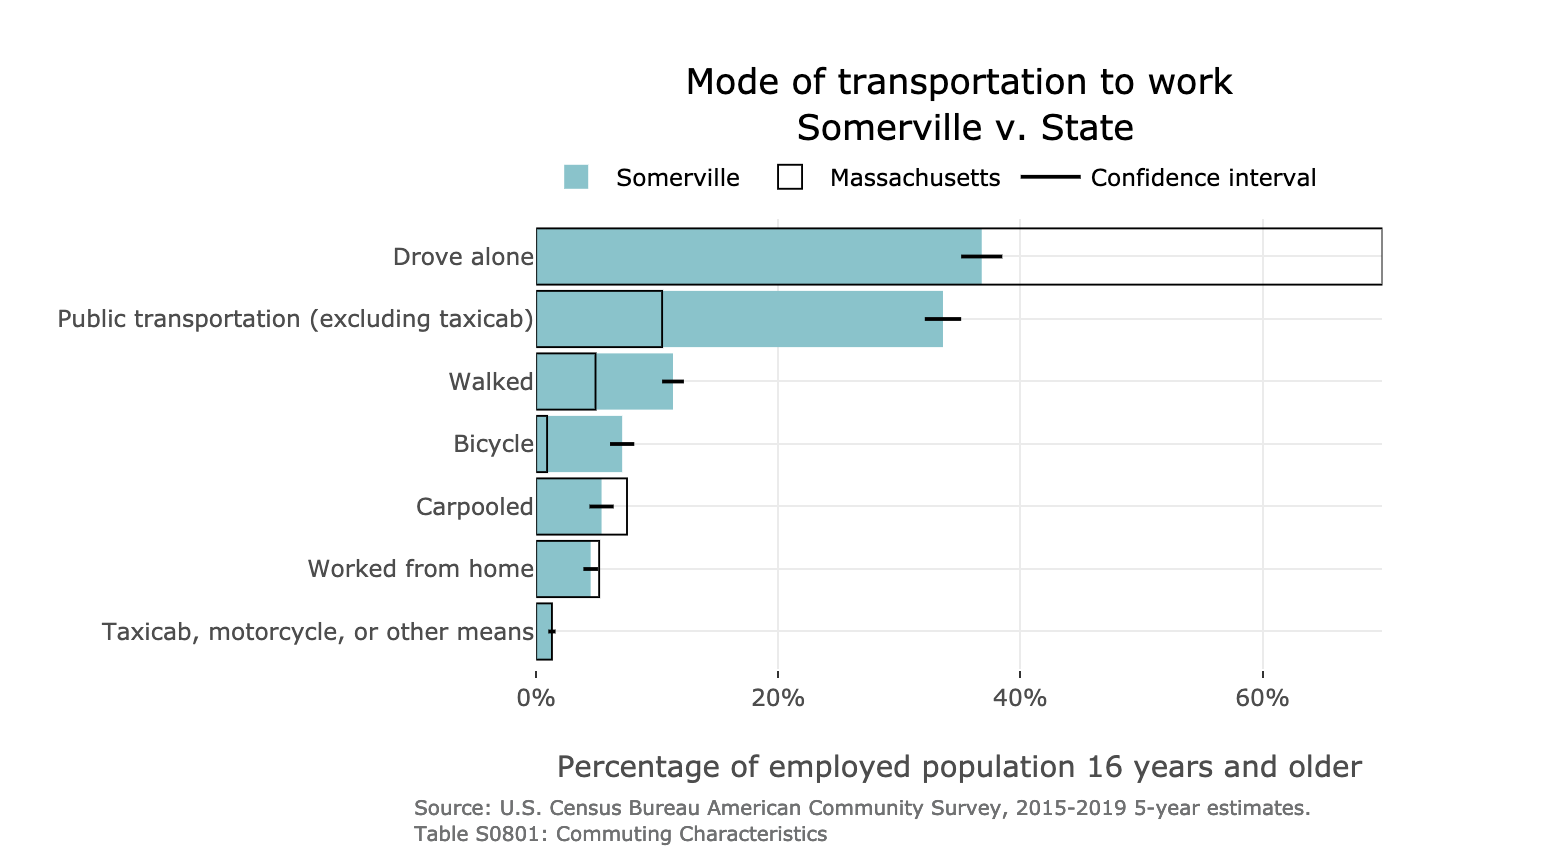
DataTown allows you to explore demographics on a town-by-town basis.
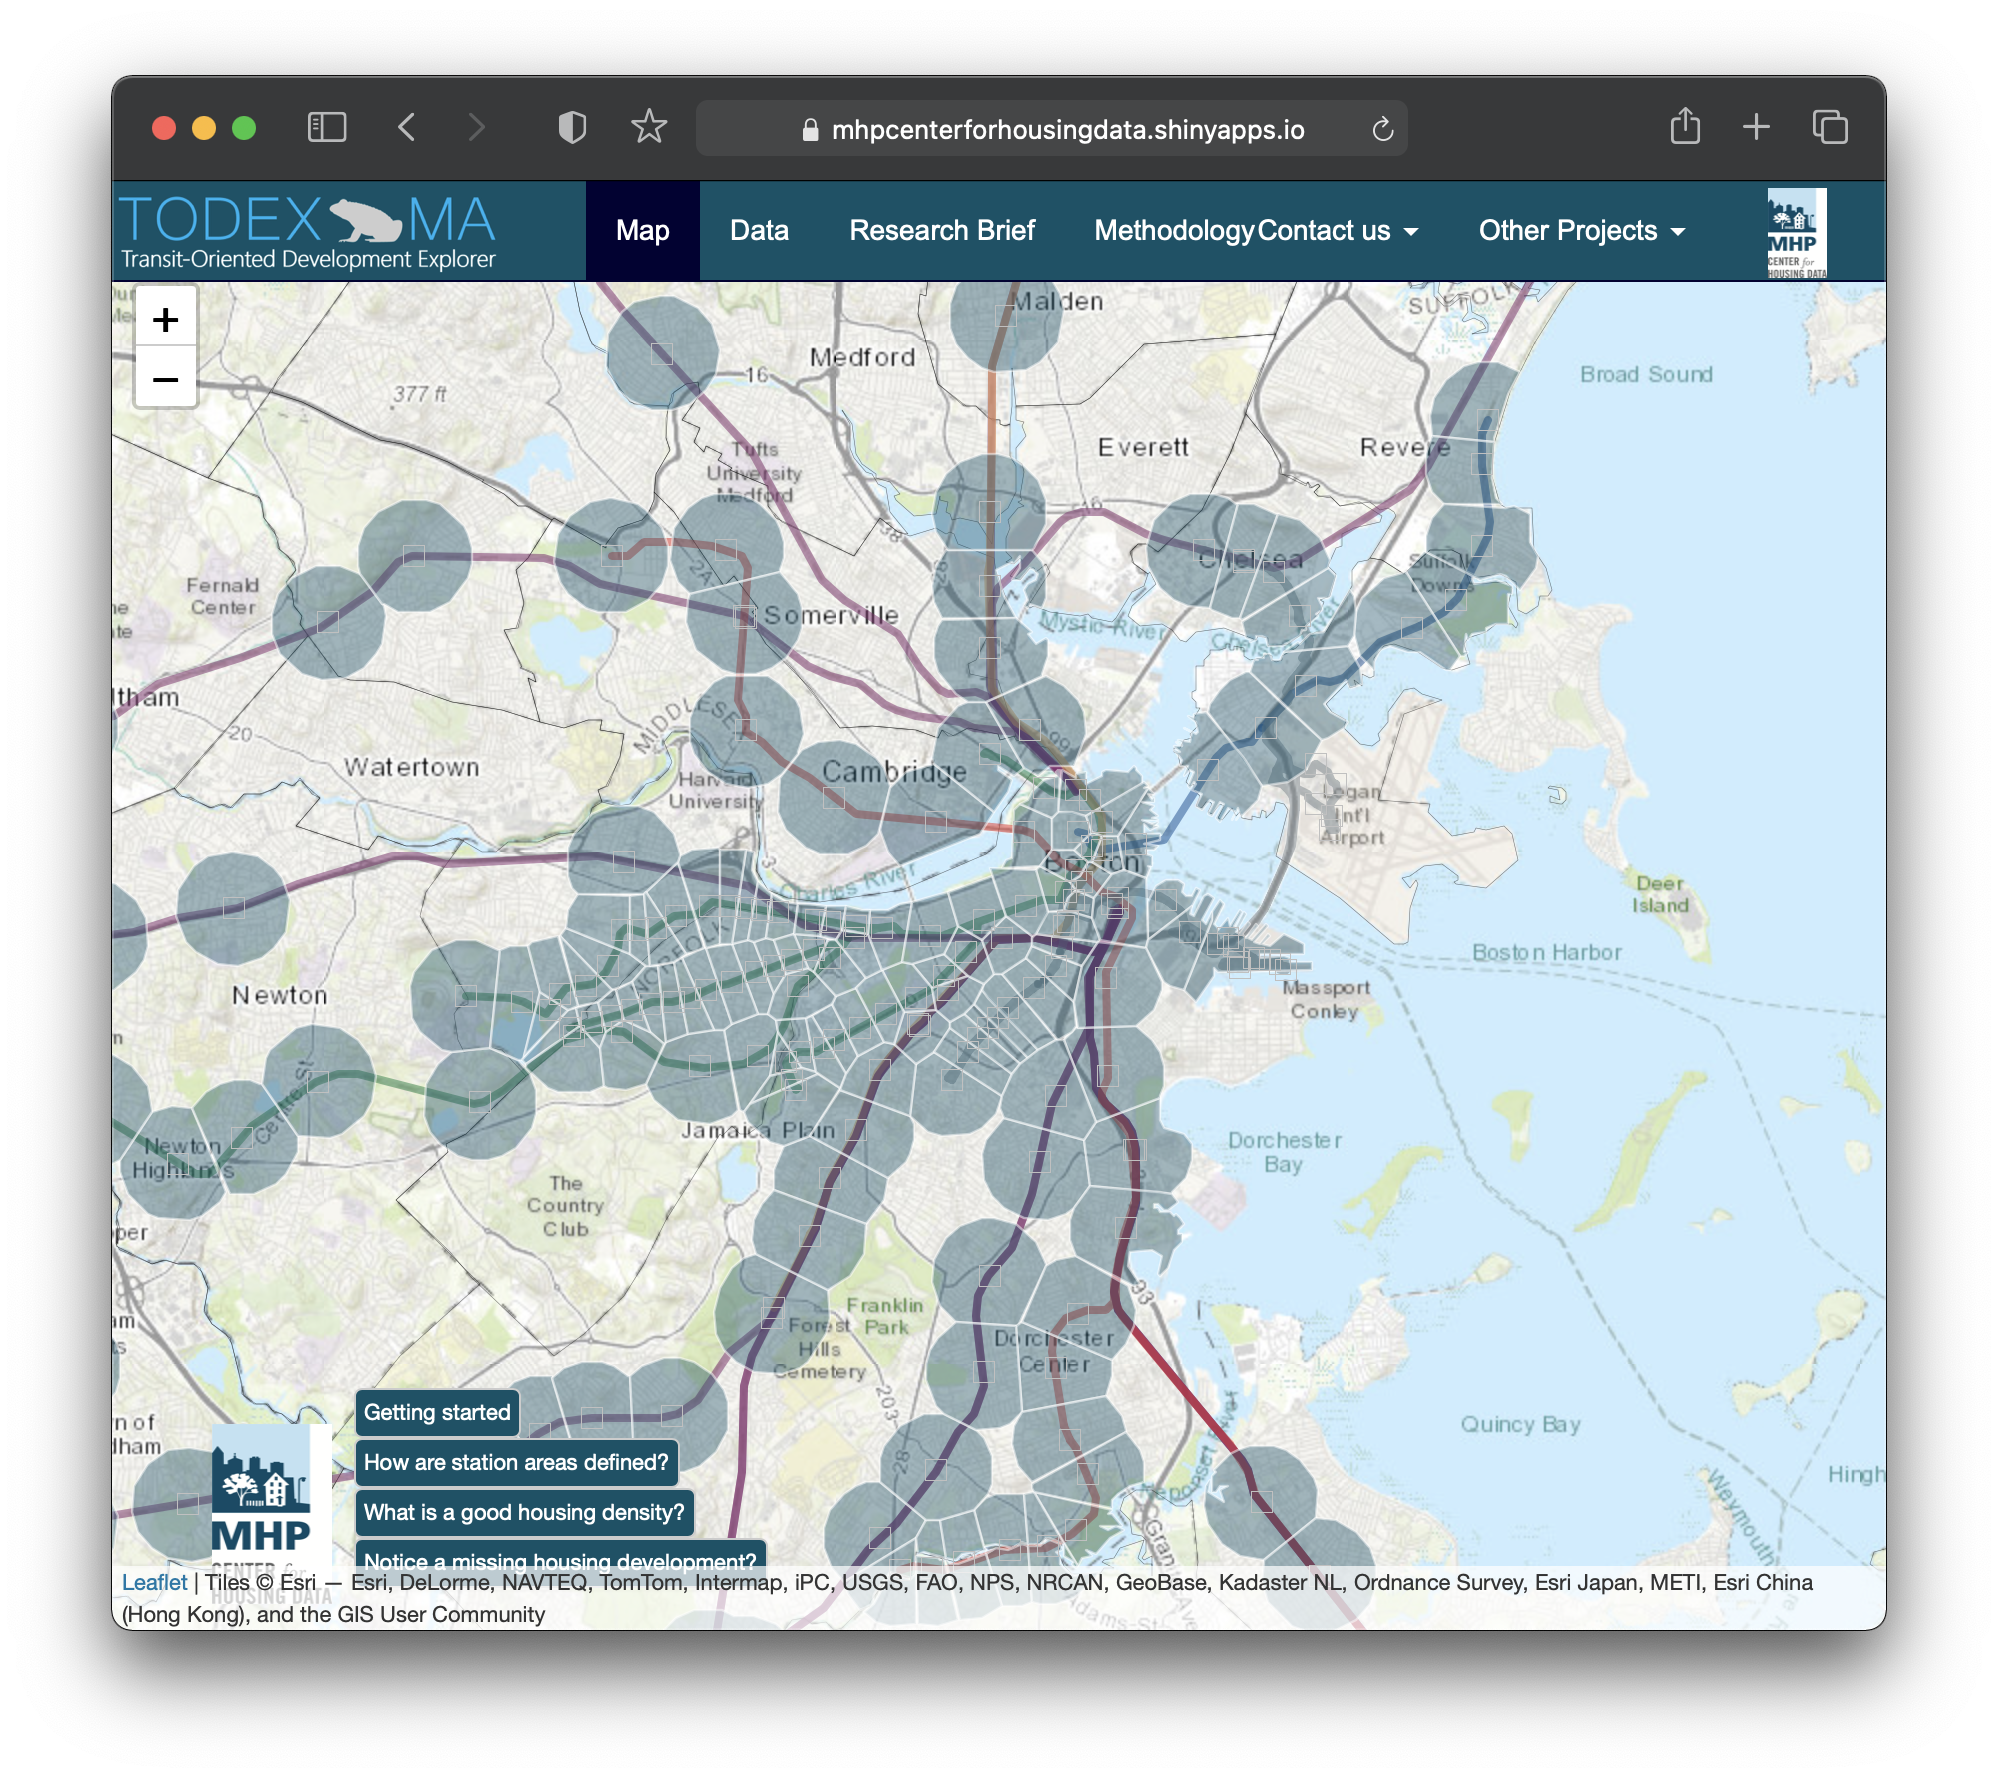
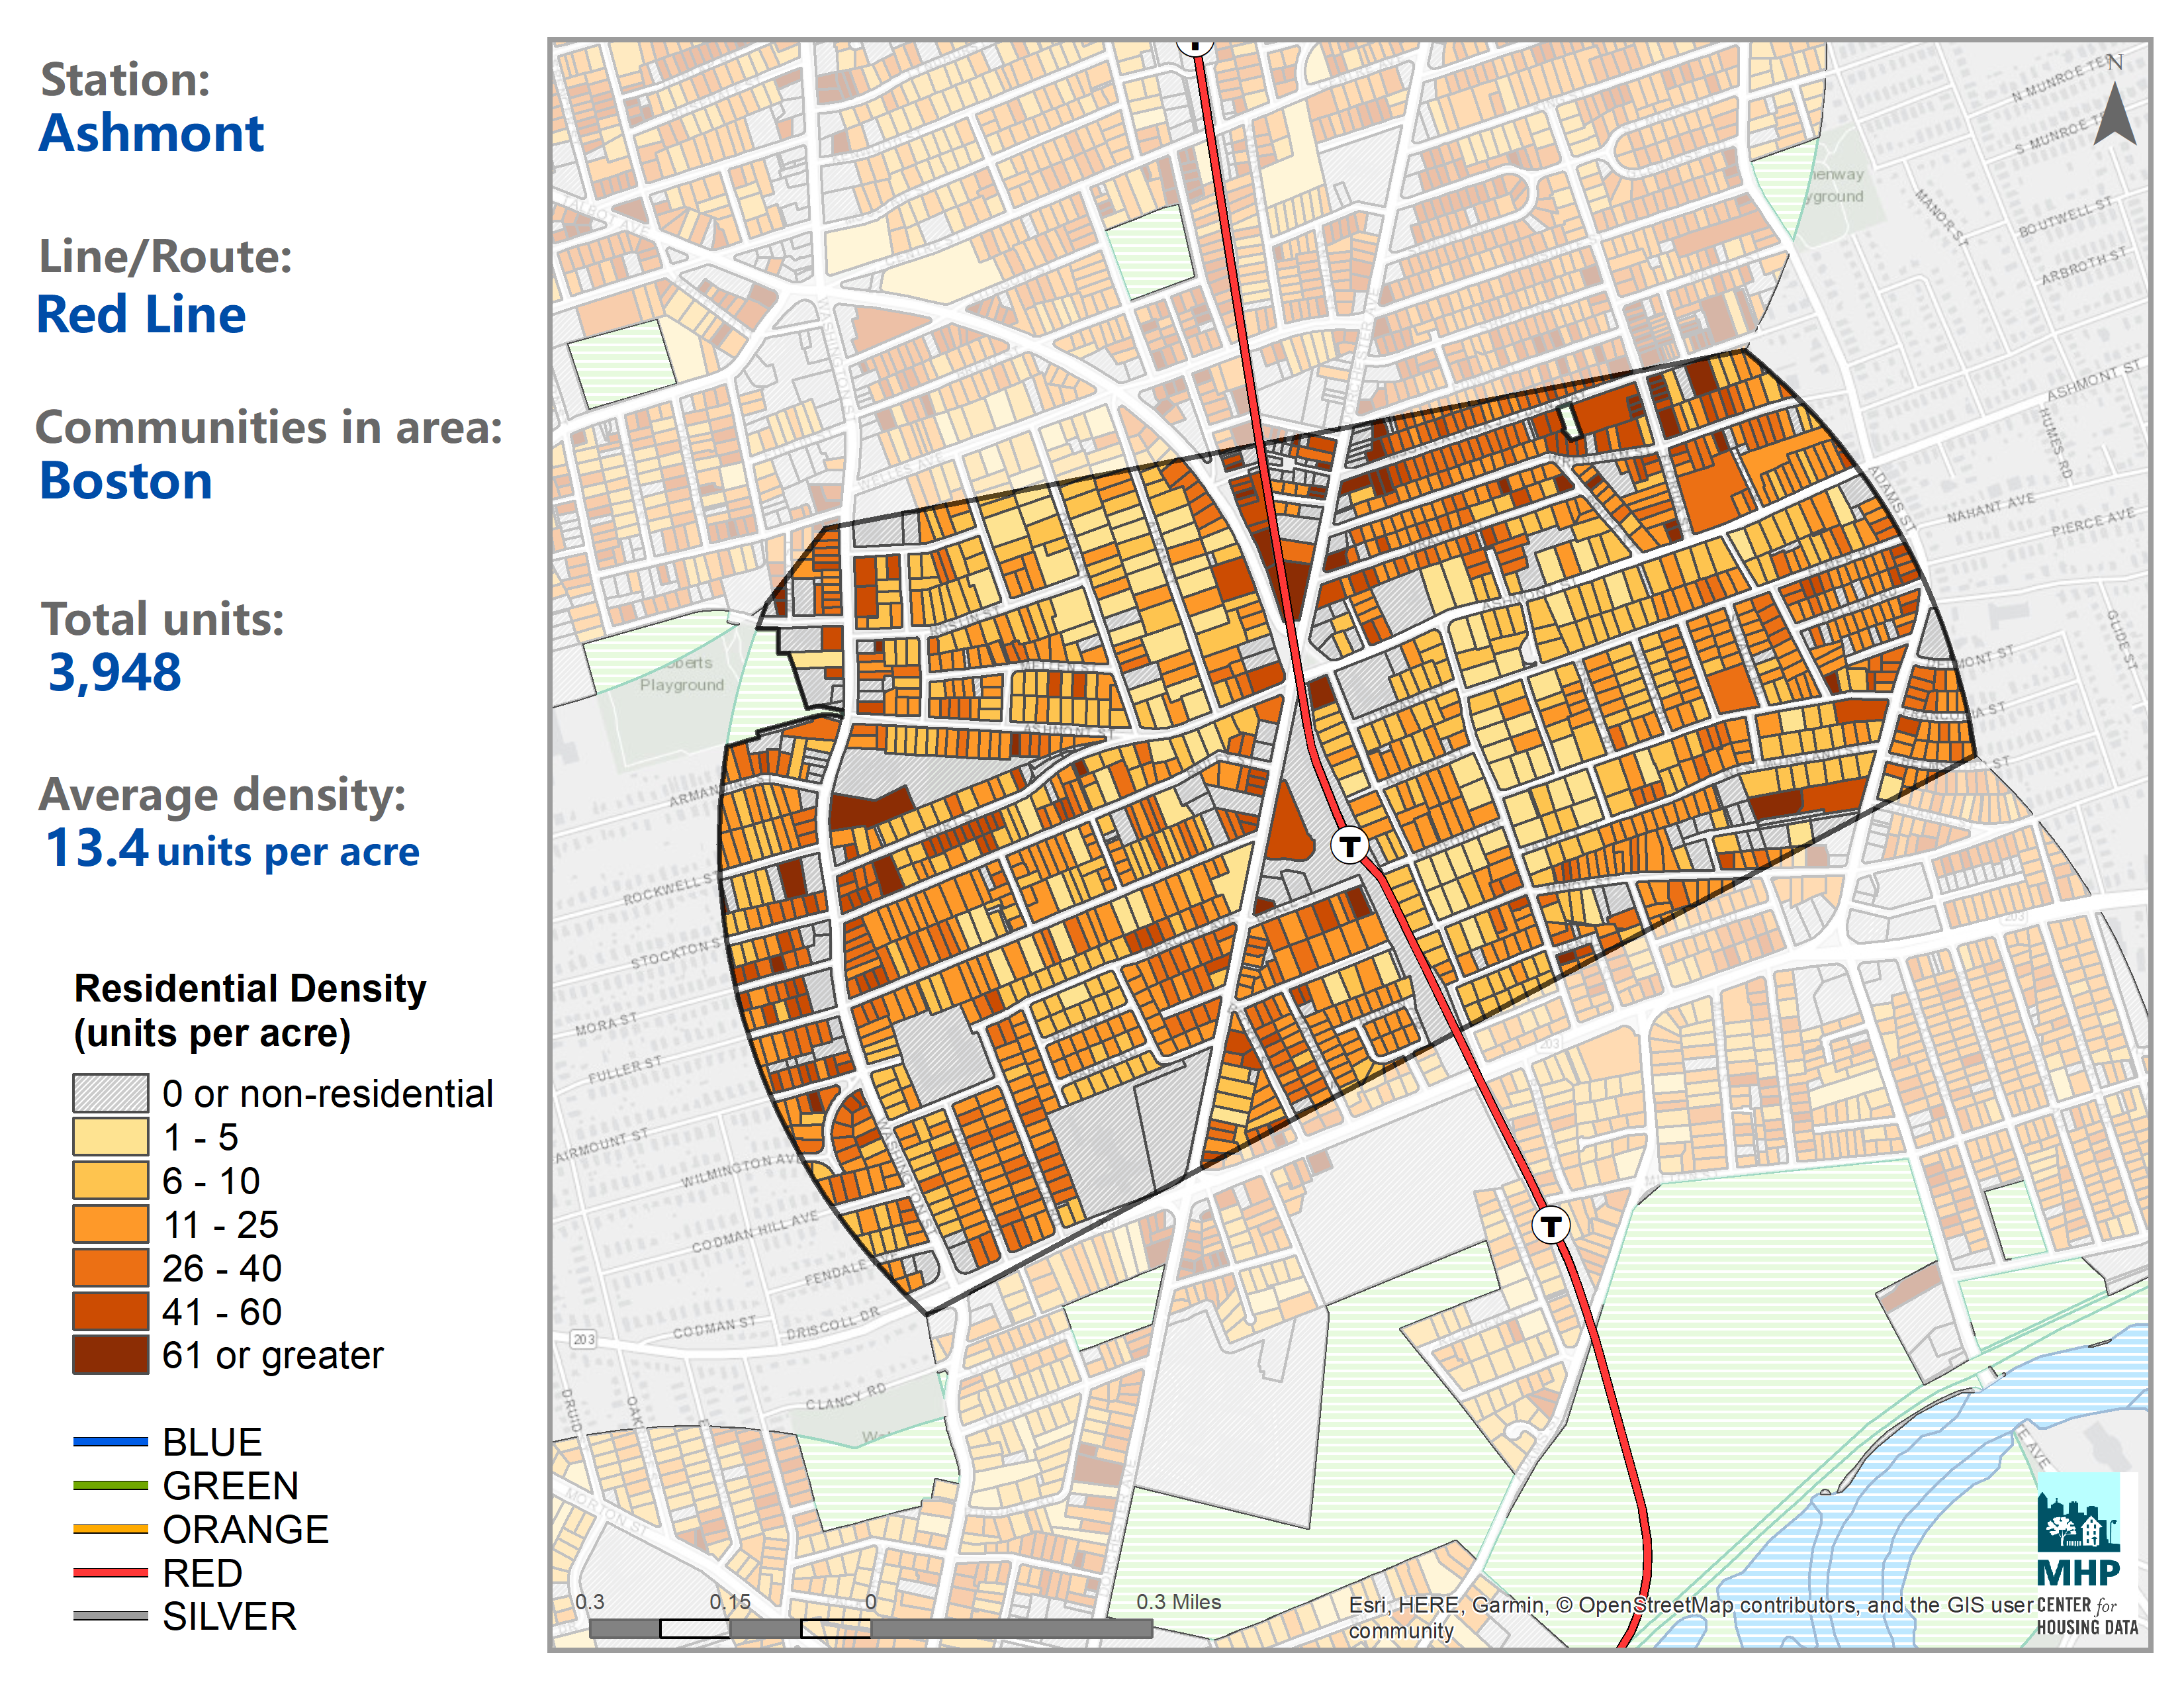
The TODEX map allows you to explore residential density along MBTA transit lines.
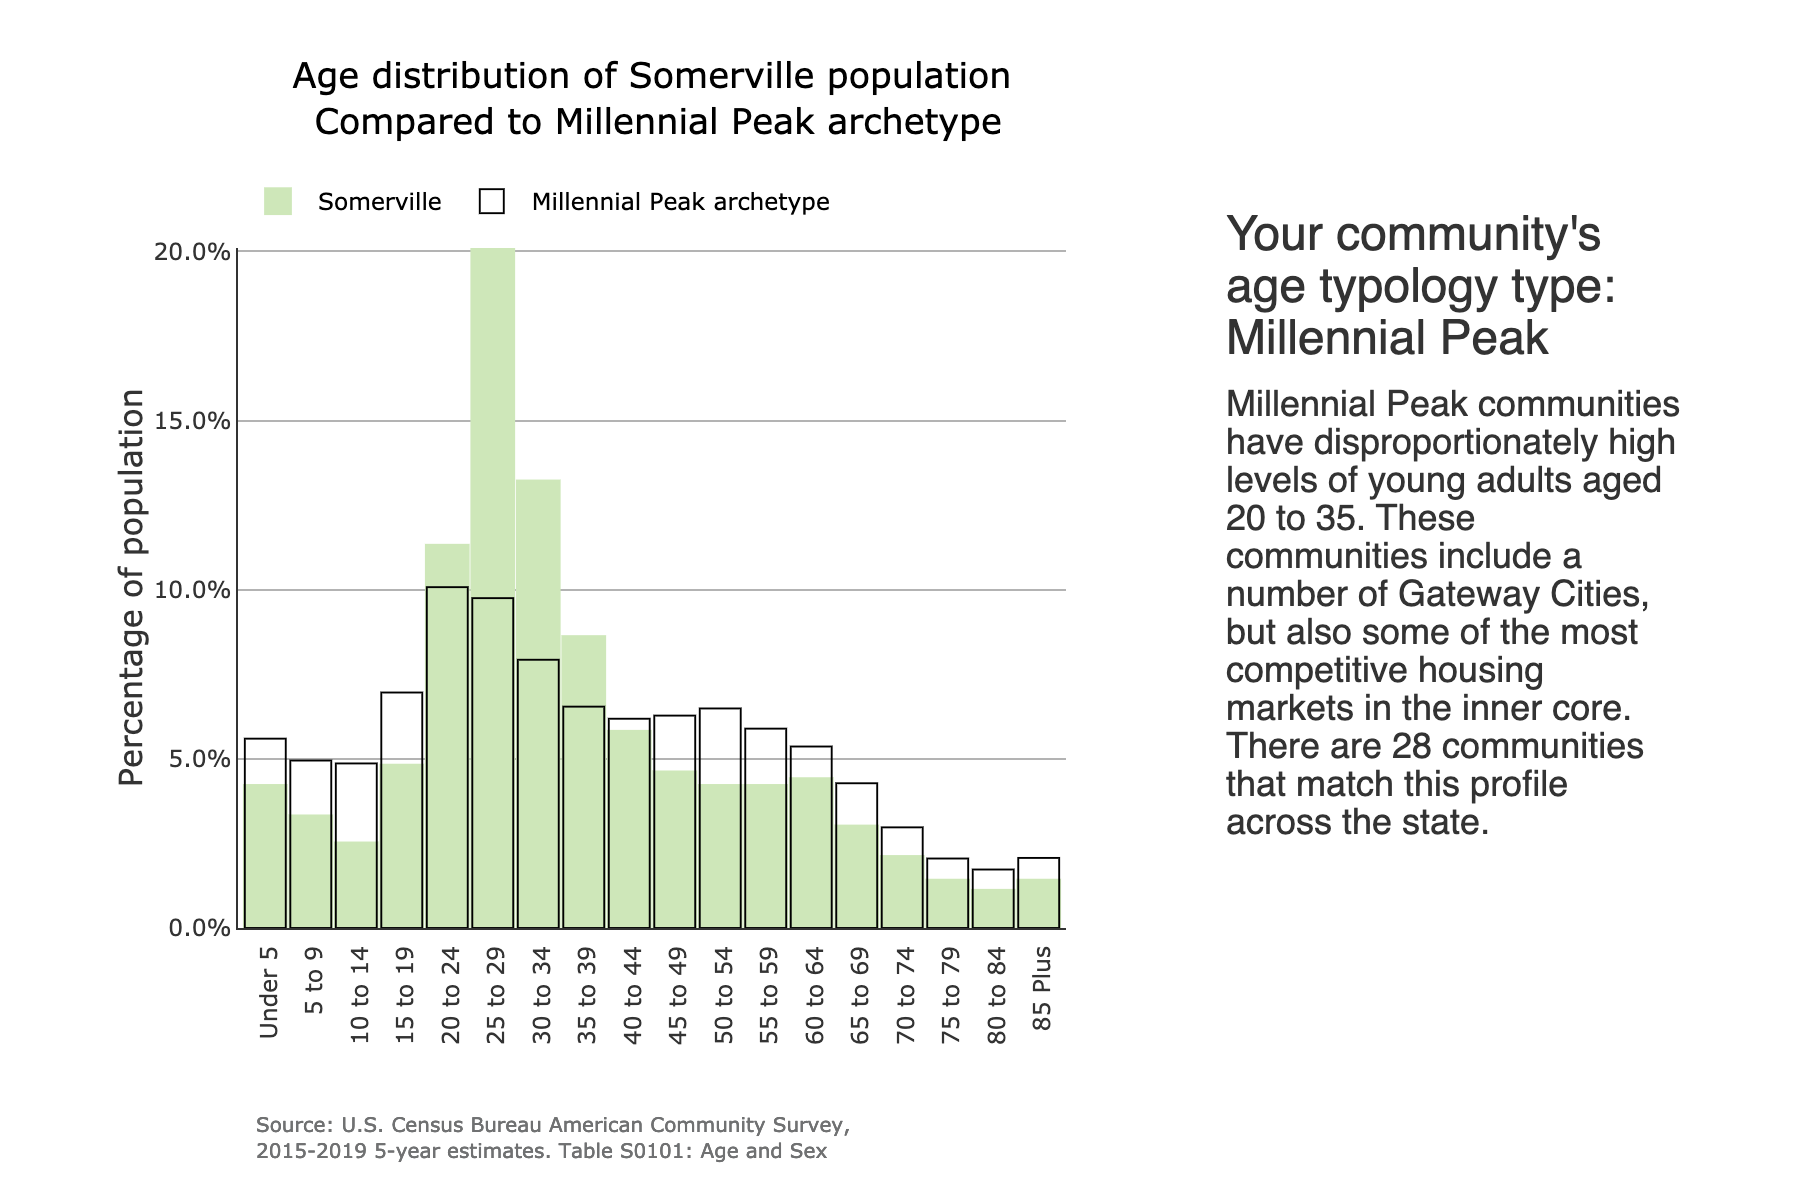
DataTown allows you to explore demographics on a town-by-town basis.
DataTown allows you to explore demographics on a town-by-town basis.
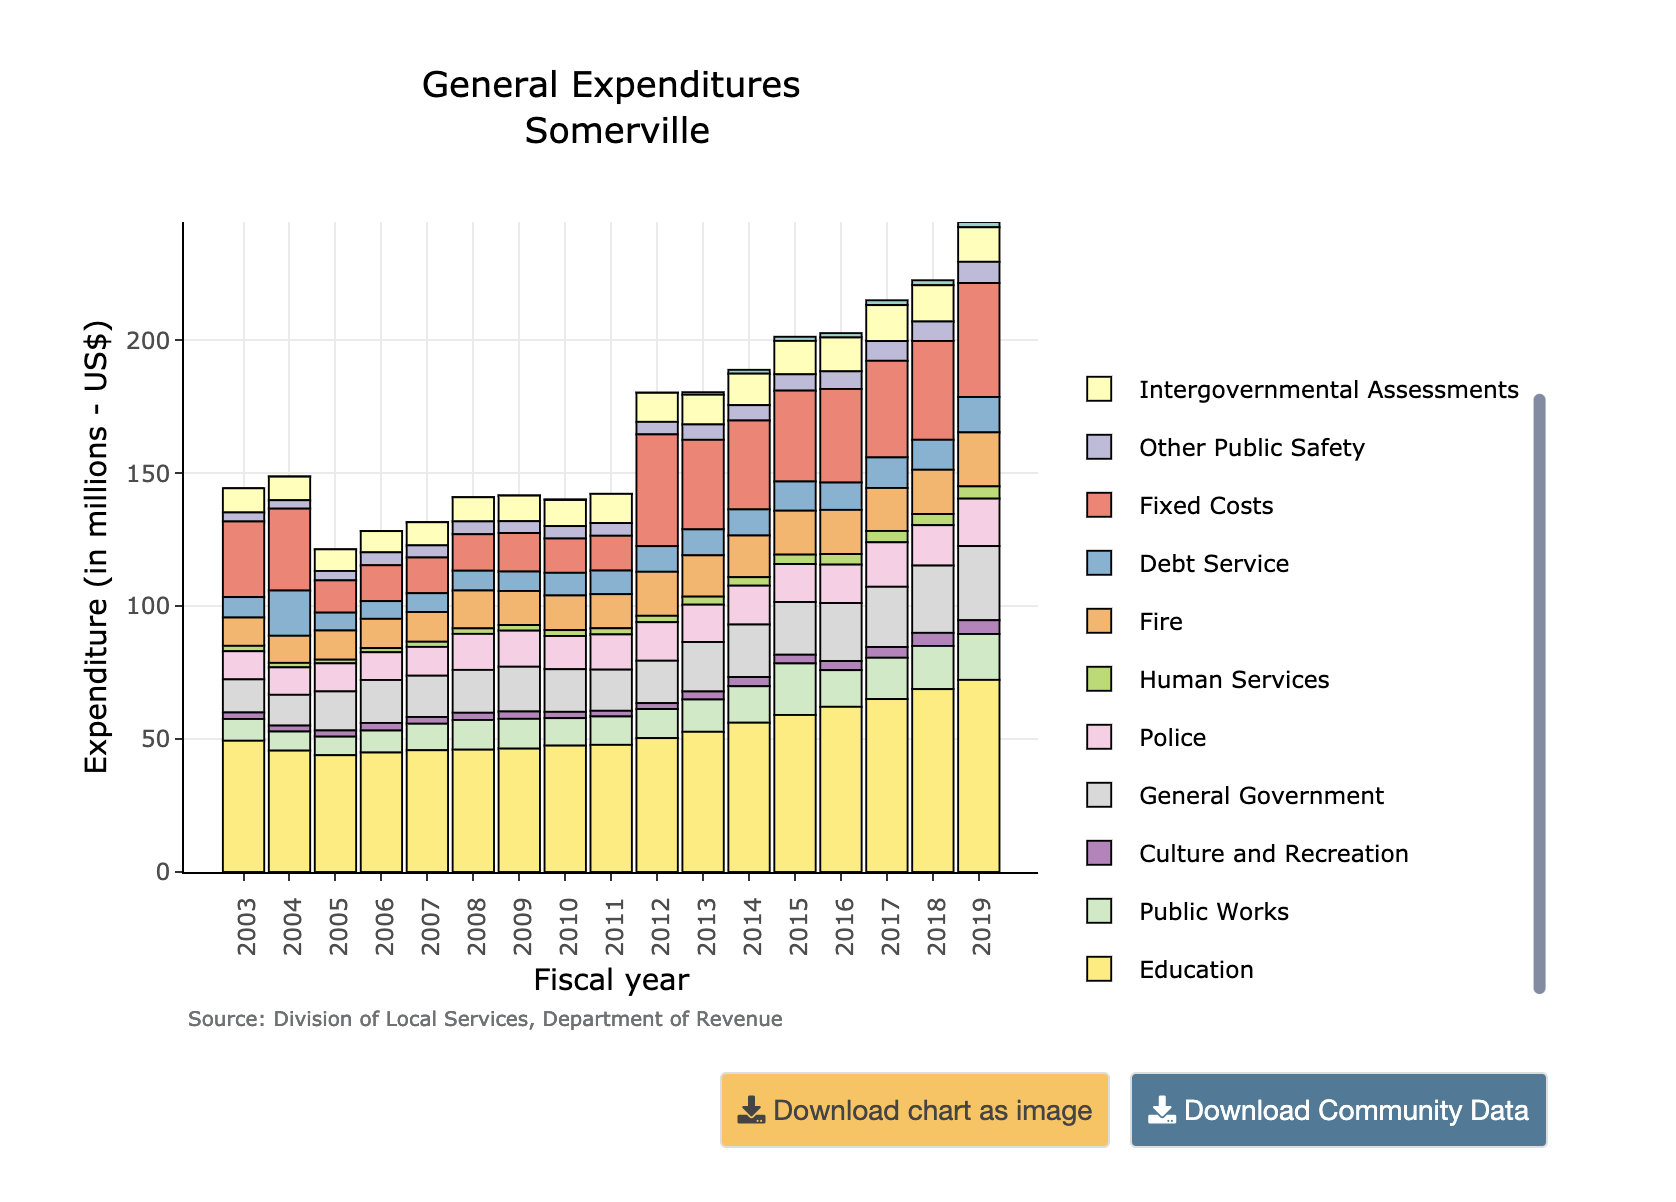
DataTown allows you to explore demographics on a town-by-town basis.
Each of these tools makes it easy (and, dare we say, fun!) to compare locations in Massachusetts, and investigate how various factors affect housing shortages in the state. We talked to Tom about the practical creation of these tools, the reasons why GIS and geography are so important when studying housing, and asked about how MHP sees their work as a public data provider.
Interview
The text of this interview has been edited lightly for clarity.
Belle Lipton: Would you like to introduce the Massachusetts Housing Partnership (MHP) and your work there?
Tom Hopper: Sure. MHP is a nonprofit, but we’re also quasi public, so part of state government. Although we’re not funded conventionally, like Massachusetts Department of Transportation might be, or the Department of Housing and Community Development, we are still part of the state apparatus for lack of a better word.
We do a lot at MHP. We finance affordable housing — large multi-family rental housing. We provide risk management and asset management for some of those properties after they’re built and occupied. We have a first-time home buyer program, called ONE Mortgage. We have a community assistance team that works with municipalities when they’re trying to create more opportunities for affordable housing, build new housing, and plan.
Finally, we have the Center for Housing Data where I work. The Center for Housing Data is a research team that tries to bring data and information to the public in a way that enhances conversations about housing needs and planning for housing in the future.
The Center for Housing Data is four years old. I’ve been at MHP for 15 years in two weeks. I was working in our rental financing team before that. And then moved more into policy and research work. But we’re relatively new in terms of The Center for Housing Data.
The Transit-Oriented Development Explorer (TODEX) and DataTown are two products that we’re really proud of. We’re proud of the way that we have been able to engage the public using these two tools, so I’m excited to talk with you about those today.
Behind the scenes, aside from our public facing work, we do work with other state departments and teams and provide almost like an ad hoc data team to some of those efforts. So we were involved in some of the Baker administration work like the housing choice legislation. We’re working now with some of the new multifamily mandate zoning that’s coming out, some of those guidelines as well.
BL: Thanks, Tom, that’s such a great introduction. I did have a few questions that are geared towards bringing our readers up to speed about your data work. Could you say a little bit about how the data work you do at MHP brings value to people who are interested in the topic of housing in Massachusetts?
TH: Sure. That’s kind of the impetus for some of the external facing products we’ve created. When we first began the Center for Housing Data, we received so many requests along the lines of, “Can you tell me how many housing units we have in Leominster?” And usually this is all information that is publicly available in datasets from the U.S. Census, and from a variety of other sources.
But sometimes that data needs a translator, right? And sometimes that data needs someone with expertise to collect it and communicate it to people who are practitioners who may not have data skills, for instance, advocates, local planners, and community members who want to know more about the community that they’re in and how to advocate for changes they want to see in their communities. So that’s the value I think we strive to bring, is to be that messenger, to take automation methodologies and knowledge about using surveys and margins of error and all those technical things, and to bring the raw data in formats that allow people to really use it.
We also have an interest in contributing to the research community. Research that informs other researchers and is part of the analytics community, and the learning community, but also centering practical applications of the data.
BL: That’s great. What are the main source datasets that the Center for Housing Data processes and interprets?
TH: We use a lot. Decennial Census and the American Community Survey, for sure. We use building permit surveys, those are the main U.S. Census Bureau datasets that we rely on the most. Federally, we also use Bureau of Labor Statistics (BLS) and Department of Housing and Urban Development (HUD) datasets. We also use some state datasets, mainly Massachusetts Department of Education, Department of Transportation, MBTA data. Anything you can think of that relates to housing or planning we look at for any intersections with housing.
BL: At the LMEC, we’re big fans of the TODEX map and DataTown, epsecially in light of how they allow for easy exploration of previously difficult-to-browse datasets. Could you walk us through the origin story of these projects? As you were getting requests for housing statistics or other localized information, what specific problems were you noticing with the source data which prompted you to want to share the results of your processing and analysis methodologies publicly?
TH: That’s a great question. And it was a little bit of stumbling into things, right? So we created this data center, and I can point to some reasons why we created it, but it was a lot of stumbling into and working through things. And sometimes, somehow, you land at a product, and find your identity by doing.
The MHP had been doing policy research and writing policy and white papers for years before the Center for Housing Data started. One of the things that really prompted the creation of the Center for Housing Data was when our Executive Director Clark Ziegler was invited to work on the housing choice legislation before it was housing choice. It was the Baker administration trying to get smart people in one room to talk about housing and what to do about our chronic under-supply.
It became quickly apparent that that group needed some data support and some research skills. And so another colleague and I were ready to do that because we had had some experience doing that already at MHP, you know, outside of our formal roles. I think that’s what got the center started. Once we were fully constituted and announced, the need for local data became so apparent, especially in housing where all zoning decisions, all housing decisions are made on the municipal level. We may have regional planning agencies, but they’re not authorities, right? They don’t mandate what gets built and where it gets built. All this is done on the municipal level, and we have 351 cities and towns in Massachusetts with different capacities, different staffing levels, different viewpoints, different things that matter to them.
Neighbors in Name Only, an exploration of municipal inequality in Massachusetts created by the LMEC’s Garrett Dash Nelson.
There weren’t a ton of very accessible data tools for municipalities to learn about their own communities. So you have planners that are coming up with housing production plans and reporting to federal agencies, and they’re doing it all from scratch. Anyone who’s worked especially with some of the ACS data knows that you don’t always know if you’re finding what you need, and it’s in a format that isn’t always helpful.
If you don’t understand how surveys are collected and how the data is interpreted and how margins of error work, then you might be making incorrect conclusions from that data, let alone factoring in the amount of time it takes to just download those datasets, clean them, and then put them into a chart or a map or something. People all around the state are doing this independently. So once we got our 12th data request, we said, geez, why not just do this once for every city and town, find a way to make that available so that people can grab it and go. And then we won’t have to feel guilty that it has been three weeks since we responded and instead, people can have the data at their fingertips.
That was the genesis of DataTown. It’s still evolving and still growing, but at the very least, we can get some basic information at the fingertips of people who need it.
BL: Let’s get into your processing workflows. What did you do to the original data? What software did you use? Are your workflows replicable and reproducible? I know you said you’re interested in contributing to the research community, so if researchers wanted to adopt your workflows, would that be straightforward? What languages are they written in? Are you thinking about things like accessibility, not only of the maps and the data, but the code and software environments used to generate the maps and data? Could you discuss your perspectives on these topics, with an eye towards audience?
TH: It’s a really good question. And we are learning out in the open. So, at first, we put something out there and wanted to see if people in our own circle liked it and responded to it, then expanded functionality based on input. And I think any considerations around sharing the methodology and some of the coding and all that work didn’t come until later. And I think we’re still trying to grow into that. But we do have a lot of data systems set up to do this. We write primarily in R. We’ve written code that grabs ACS tables from the Census Bureau’s API, processes the data, and kicks out a clean data set that we can then incorporate into our website and our website code.
One thing I wished the Census was better at is maintaining consistency from year to year. They change field names, they change coding, they change what’s in a table. So every year we go through this process of trying to run our code that pulls the data, processes it, and we have to do a ton of troubleshooting. We need to reorganize our code to get clean and consistent datasets so that data looks the same as it did last year on our website. We have created this level of management and oversight that maybe we didn’t recognize at the beginning just to keep the site up and running, which is just always the case. There’s a million things you never think of.
BL: After you have done all of this work, I am curious if data users from outside of Massachusetts have applied your methodologies to census data for their own states?
TH: No, they haven’t, and we’d love it if they would. And I think that’s part of why it’s important for us to think about putting this in a Github repository, or just putting our entire process out there so people can grab it. I think other research teams are doing similar things with scripts and APIs, and the Metropolitan Area Planning Council (MAPC) stands out as one that’s has done a lot. And they have a similar set of data tools on their DataCommon, which is fantastic. So we would like to share that information because if one person can do it, then everybody could share that process, and not have to duplicate that work.
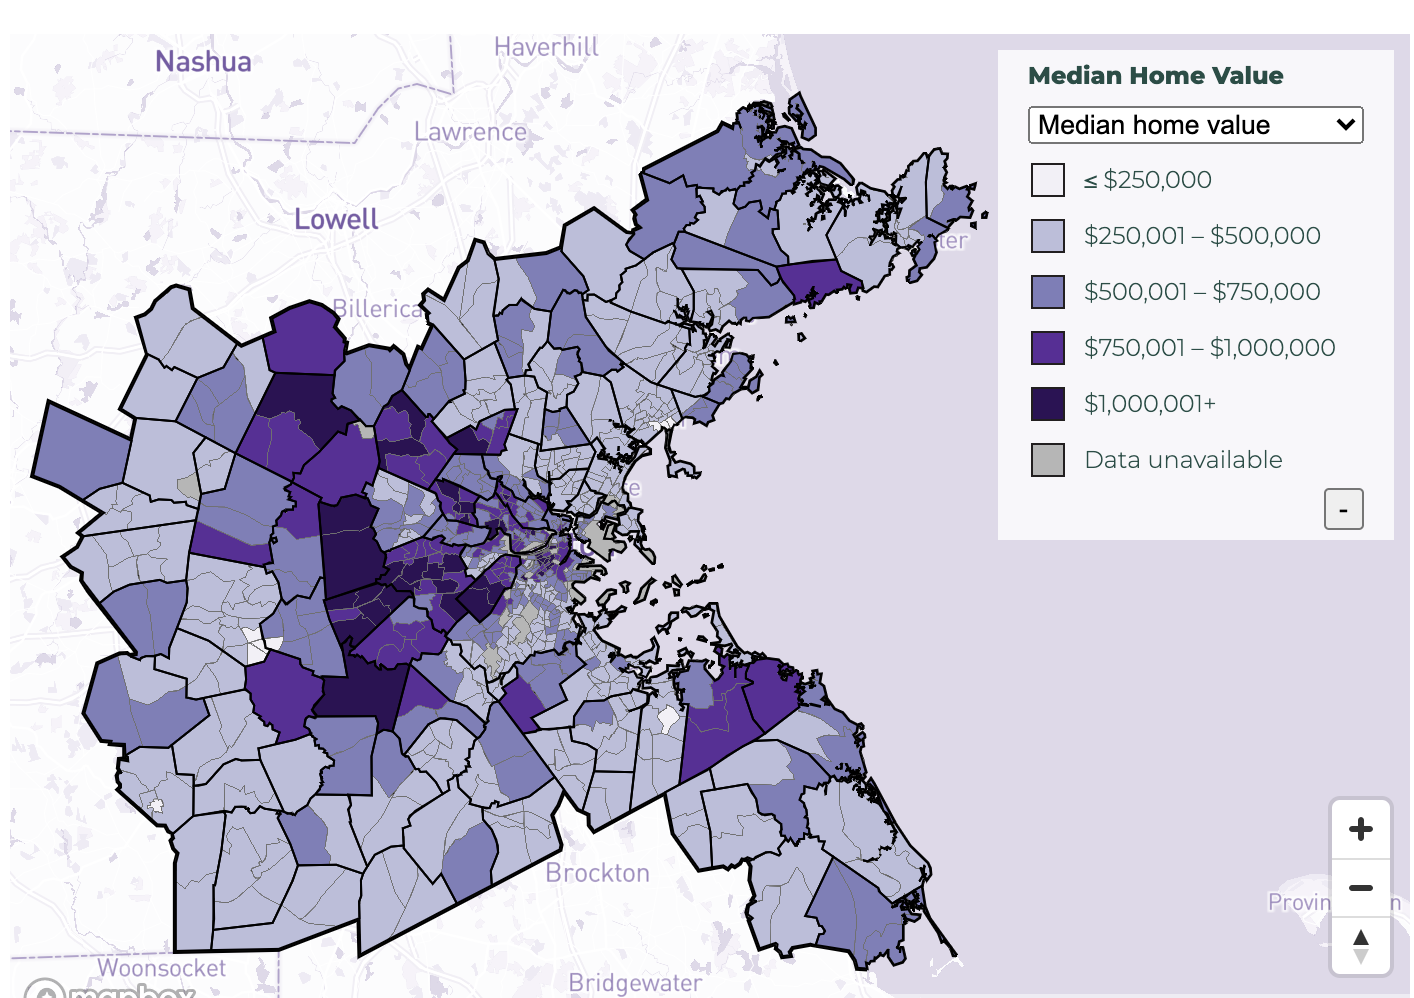
“Exploring the Housing Markets in Greater Boston” data visualization from the Metropolitan Area Planning Council (MAPC)’s DataCommon
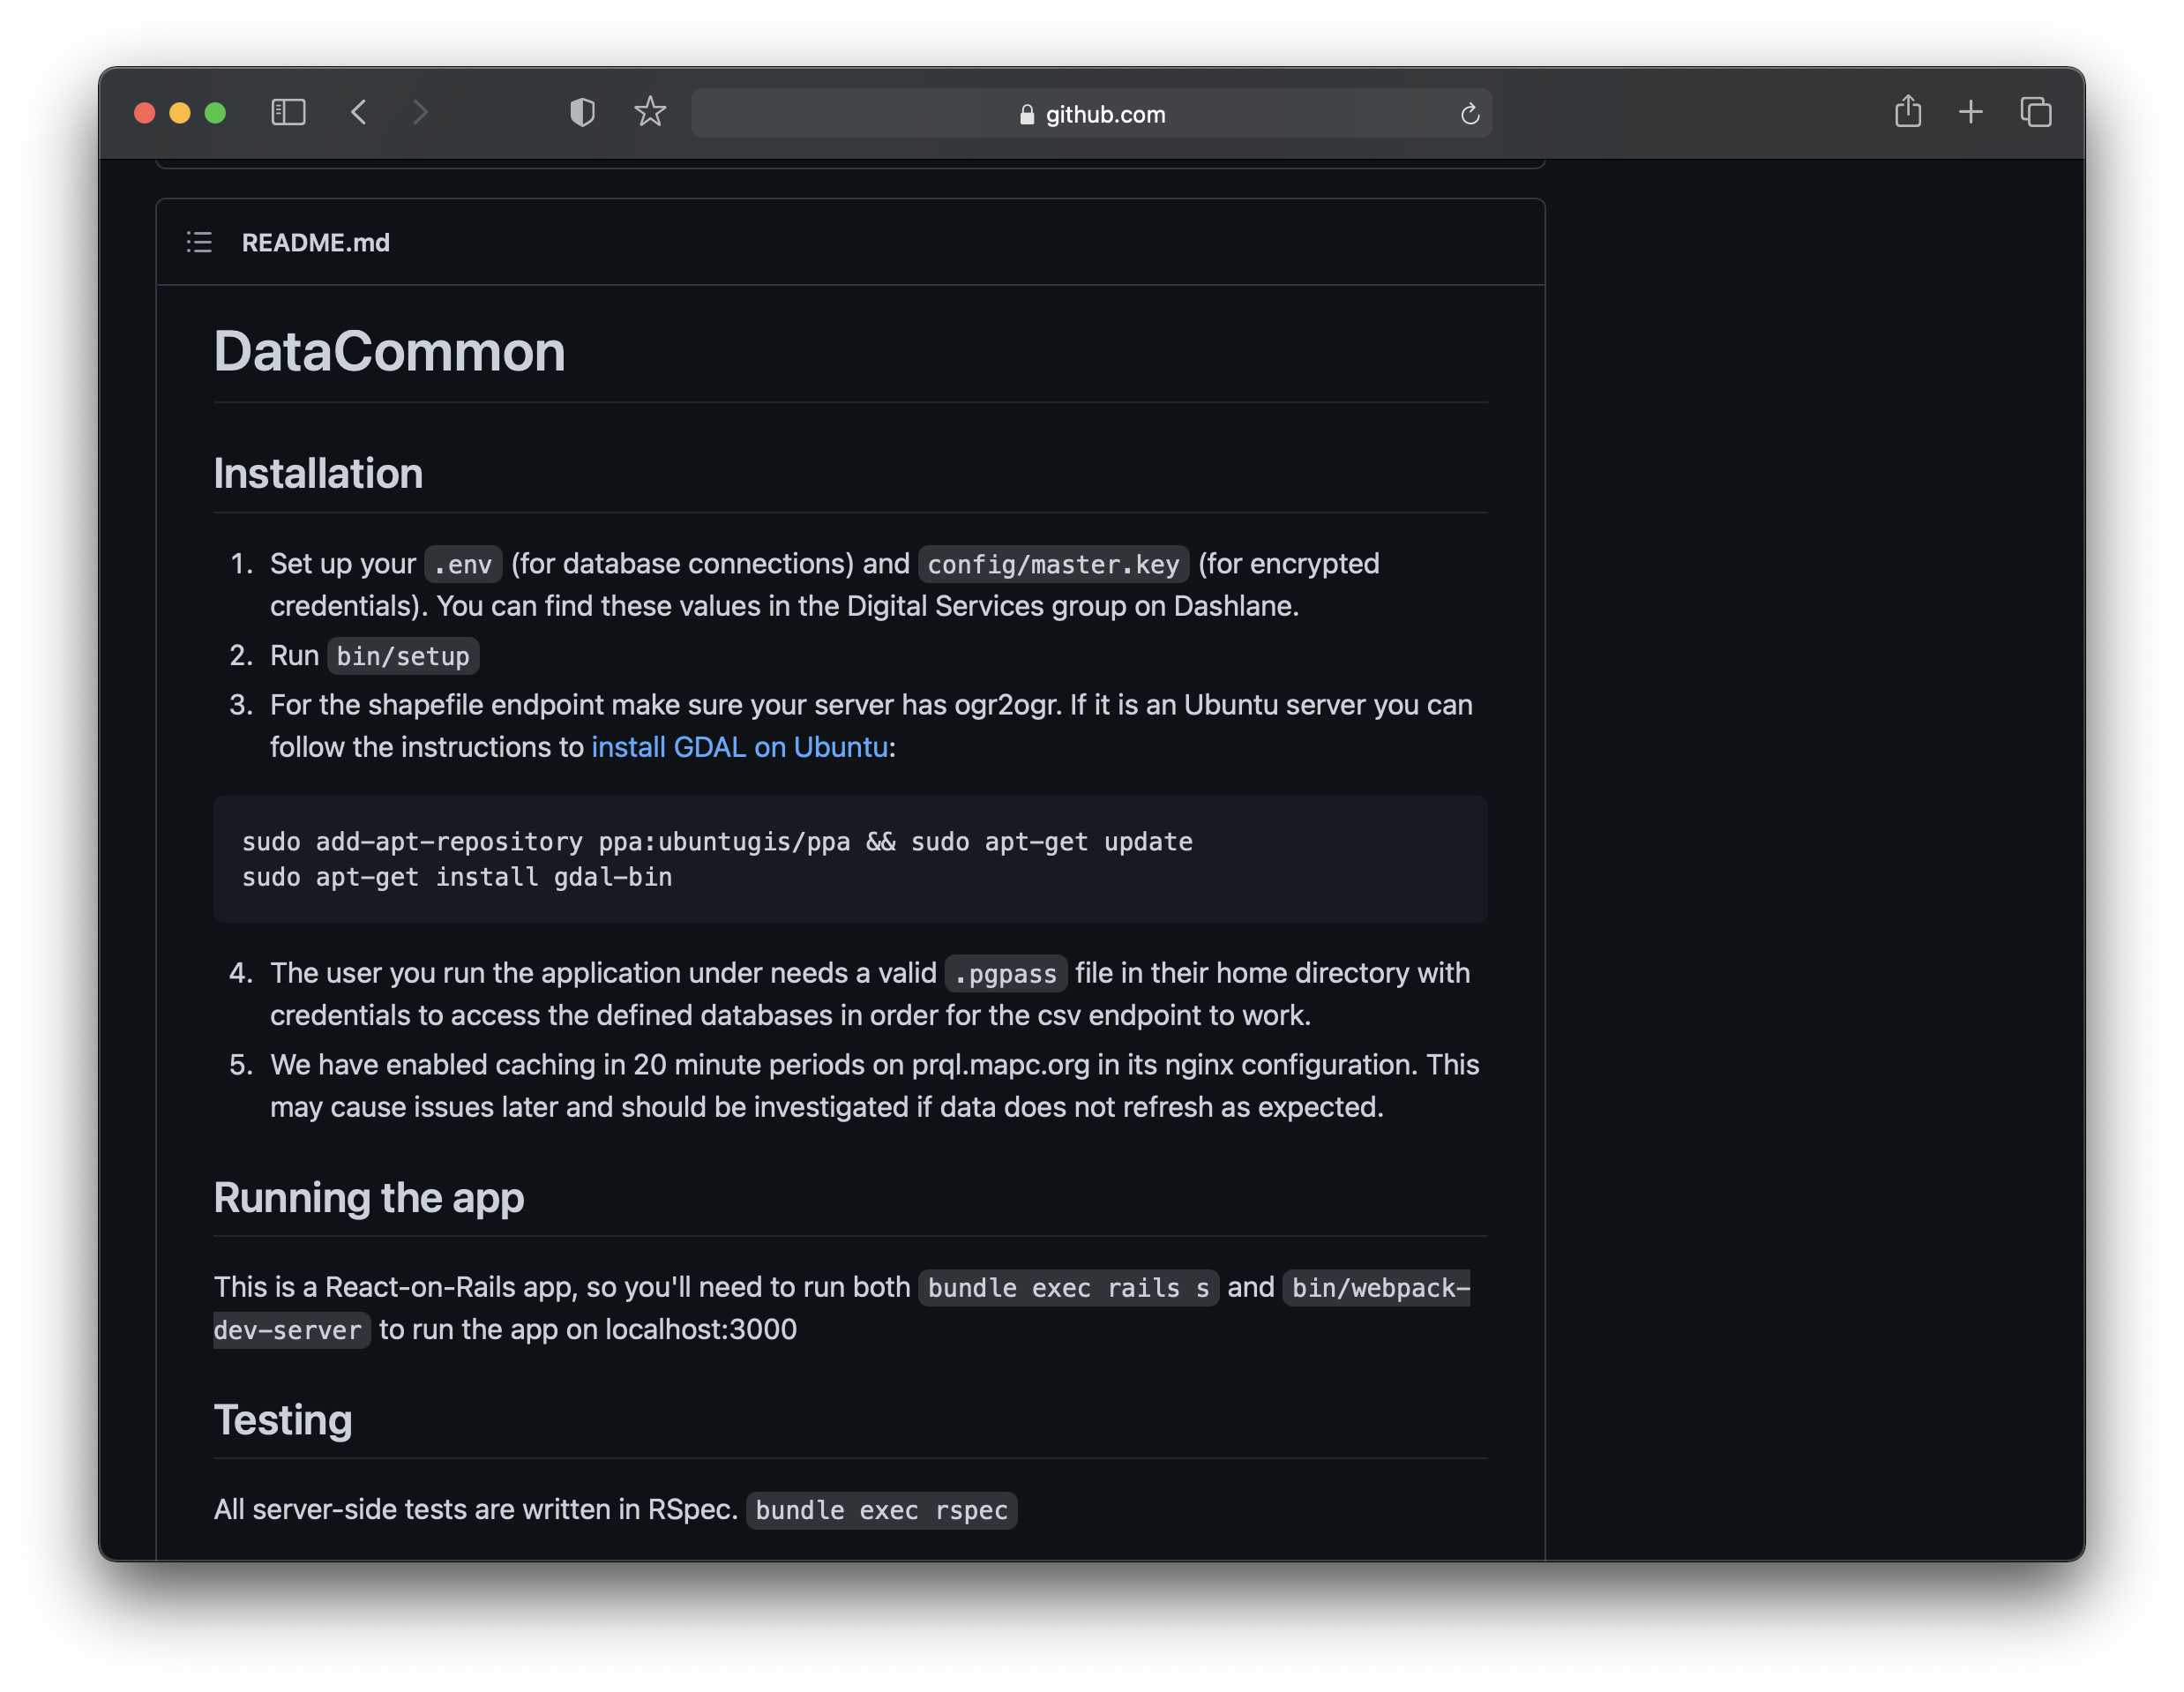
MAPC makes well-documented code for DataCommon publicly available.
BL: Thank you. Let’s talk now about how geography and GIS play a role in the interpretation of housing data. Why does geography matter? Why are the spatial components so important here from your perspective?
TH: Yeah, and this is also a great opportunity to talk about equity and race, because housing is one of the primary ways that we’ve embedded racism and segregation into our physical spaces. We’ve manifested that into physical separation. So if we’re not talking about geography, and we’re not talking about that spatial separation of demographics and housing needs, then we’re missing the point.
Geography is an incredibly integral part of our analytical work. It’s apparent in tools like DataTown, where we’re analyzing data on a municipal level and highlighting attributes like racial composition. But it’s also really important in tools like TODEX, which is our Transit Oriented Development Explorer, where we’re looking at station areas and housing volumes and residential density and different neighborhoods across the entire Eastern Massachusetts region. Being able to point out the differences between where we’ve been able to develop housing, where there are housing opportunities, and where there’s been resistance to housing with very little density and opportunity for finding a home — highlighting that suburban/urban divide is such a key and core principle in housing analysis. We rely heavily on spatial data to tell that story.
BL: Thank you. I did notice the anti-racist commitment statement on your website, and I’m really interested in how this comes up in your actual work with the data. With your background and experience working with all these disparate federal and state data sources, what are some things that you’ve come across in how these datasets have been structured or encoded that makes it difficult to draw out or elucidate the key problems we’re facing as a state when trying to address issues of racial segregation and housing?
TH: When we’re thinking about bias in data collection and bias in data interpretation, you have to move along that spectrum from start to finish. Especially because so many of the data sources that we rely on are survey-based. You have to be critical of how surveys are conducted and how they’re rolled out. Some example questions you might ask: are you making the surveys available in multiple languages? Are you getting a representative sample? Are you doing stratified or random sampling?
All of these decisions play into the kinds of responses you get and how meaningfully representative they are. Then, how you code those responses is also so impactful. Racial and ethnic categories in the census are really important, but we also have to recognize what they don’t give us. They might give us diversity across some of those categories, but not within. So responsible research will look at those intersections between race and other indicators that might tell more of a story that racial categorizations might not do on their own. It’s so important to recognize what’s not in that data and what’s not represented in that coding.
BL: As you’re working on the local level, are you finding that there are issues that people would like to be able to respond to in a data-driven ways, for which there is just not available data, or the data we have is structured in a way that makes it not useful?
TH: One of the things that we often come up against is the granularity of that data, especially when we’re talking about demographic data and place. Because of small sample sizes, and not being able to isolate certain indicators on a neighborhood level, sometimes at the census tract level there are really high margins of error. When you don’t have a lot of racial diversity, what do you do with that information? That is a frustration, even though we all understand why we don’t have very granular data, and don’t want to be able to identify people and put people’s identities at risk. But from a research perspective, that’s a challenge.
It’s a challenge for working with people who are not data professionals who want that information. So many people operate on anecdotes, for example: “This new housing development was developed down the street, and so now we have too much pressure on our schools.” And it’s this conflation of a personal experience with a broader occurrence or trend. It’s really hard to disprove those notions when you don’t have highly specific data that can actually address the very specific thing that that person is presenting to you. So, I think that is a huge challenge — knowing what the limitations of the data are and complementing data-driven strategies with other strategies. Case making strategies, qualitative research, all of these other things that might be able to complement the story you’re seeing in the data, but may not be able to communicate effectively to someone else.
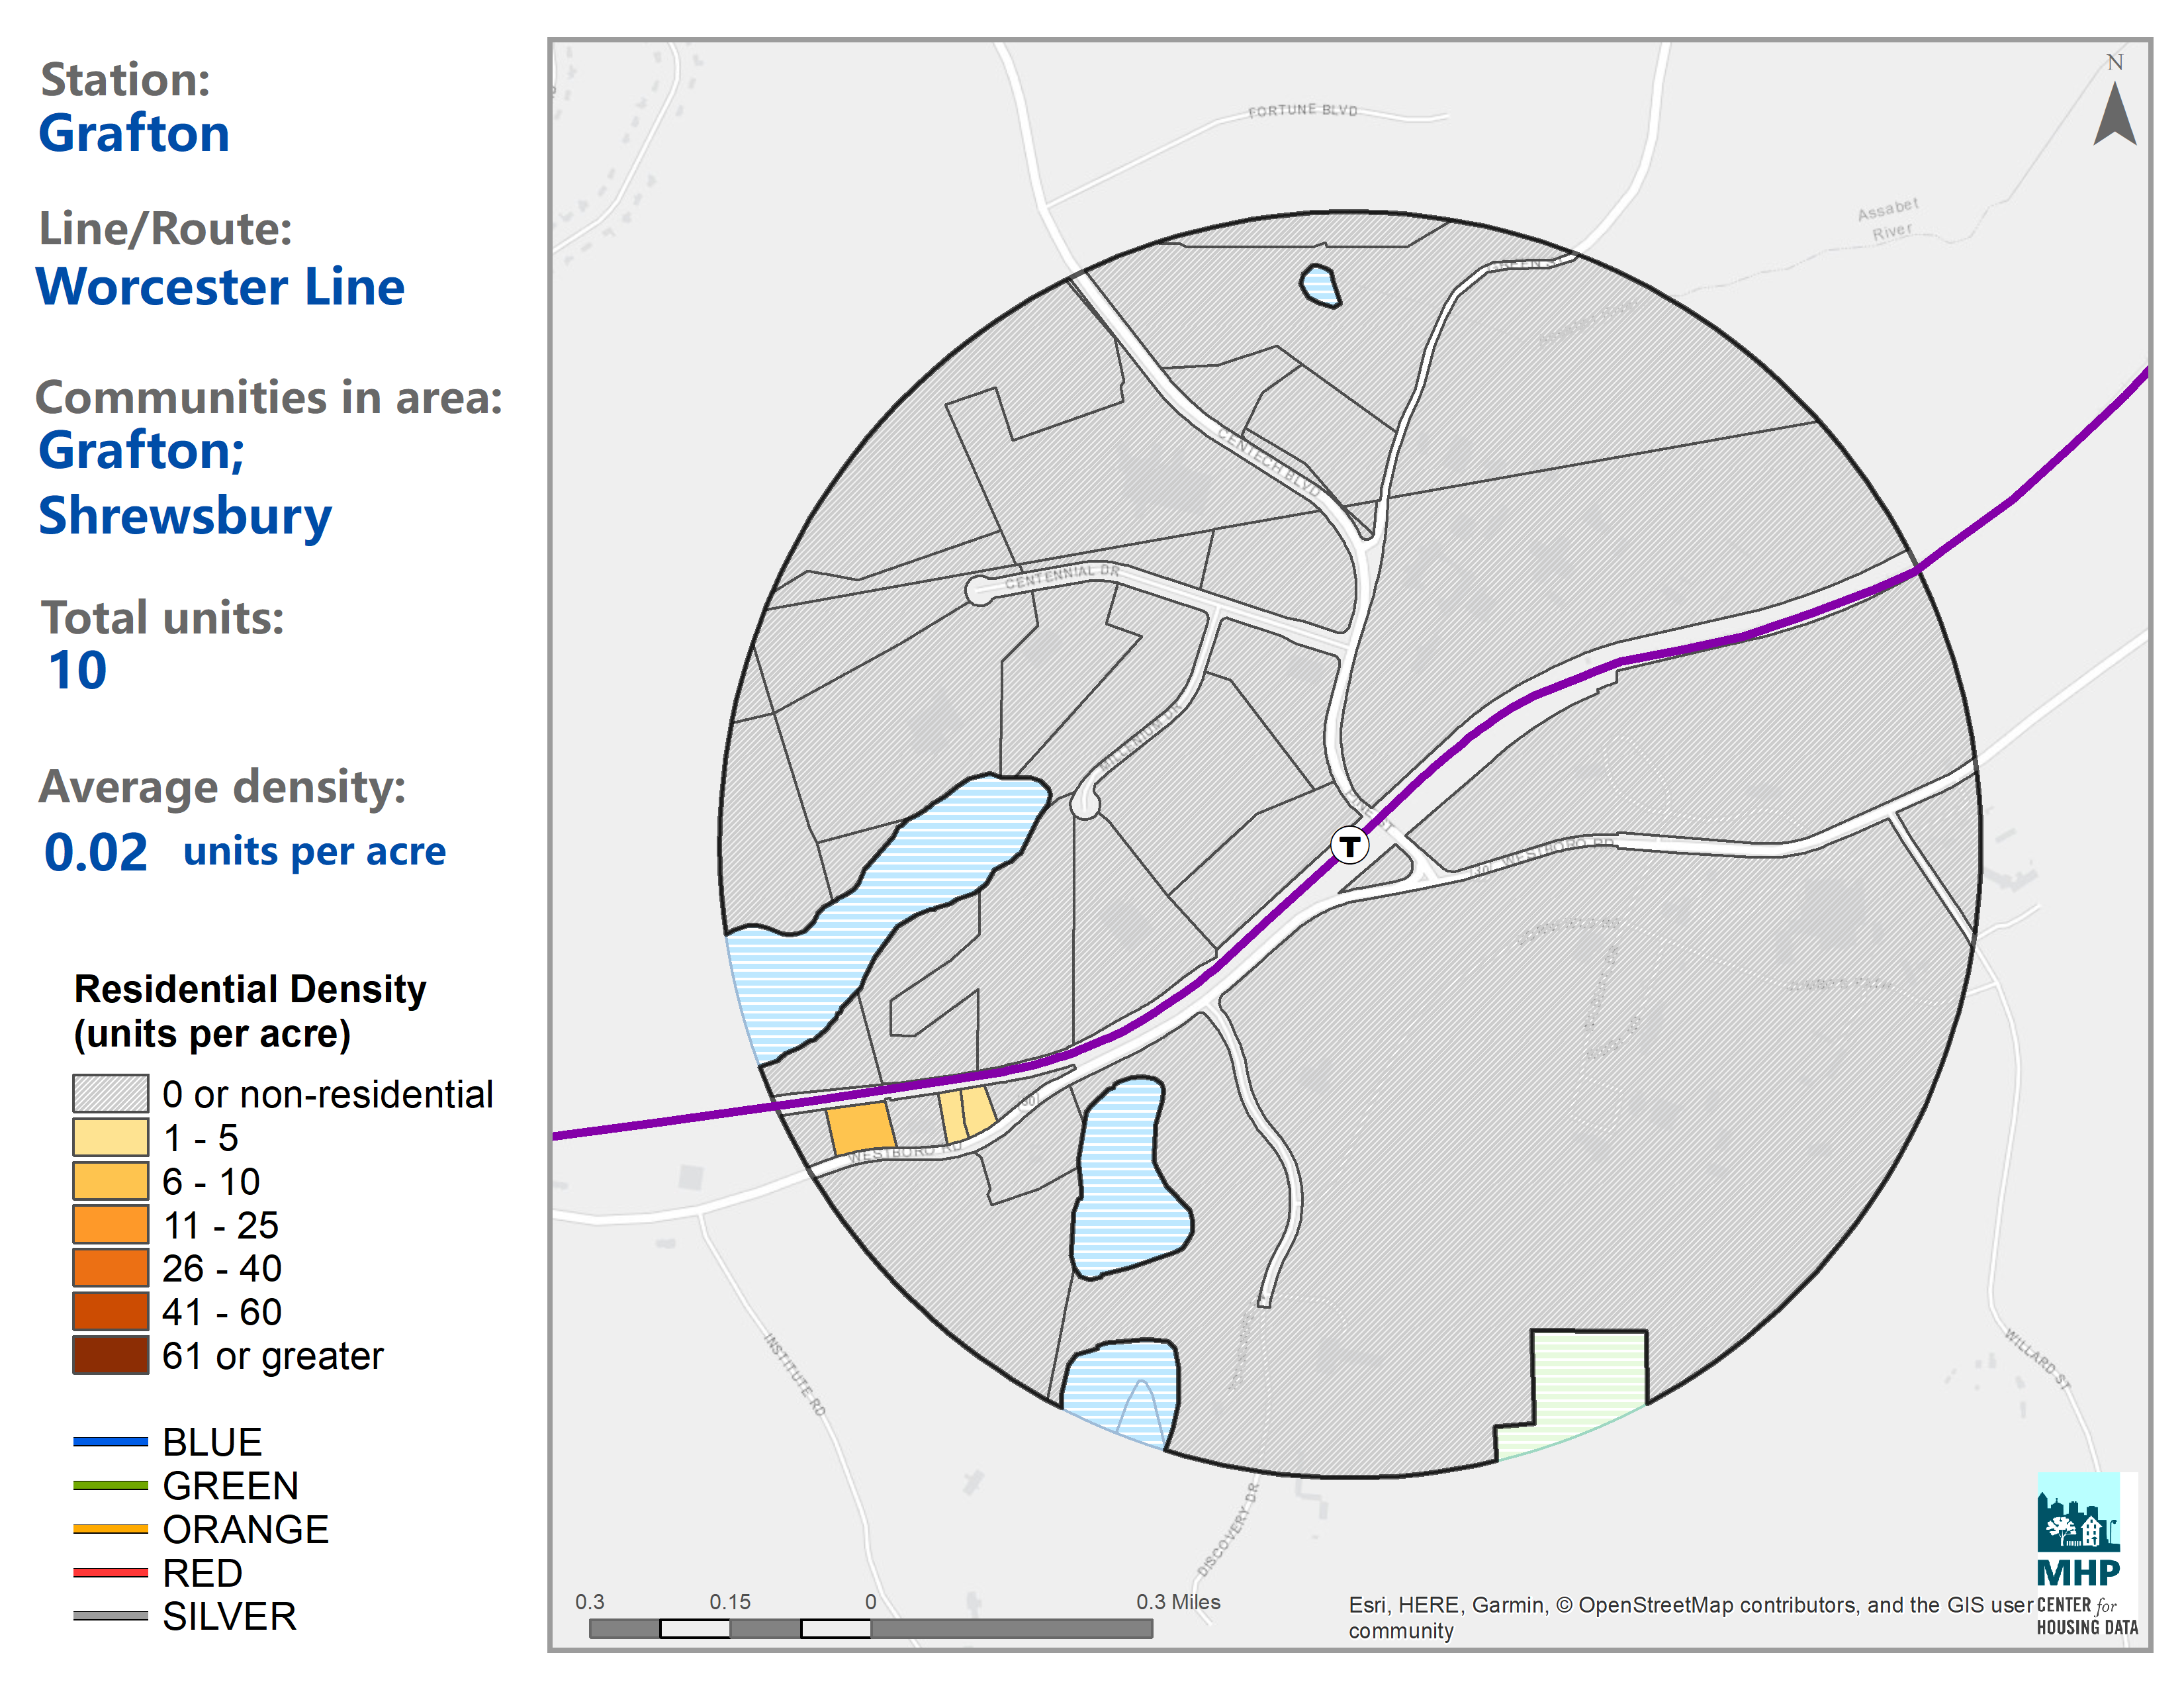
TODEX allows you to download maps showing density around each transit station.
TODEX allows you to download maps showing density around each transit station.
Explore stations near you with the Transit-Oriented Development Explorer (TODEX).
BL: Let’s talk about the really awesome rendered maps that come with the TODEX tool, showing housing density around transit stations. Could you talk about what caused you to want to make these maps? What are the narrative or rhetorical benefits of having them on the site, and how does this type of communication tie into the larger mission of the work that you do at MHP?
TH: TODEX was a labor of love. It actually started as me trying to prove to myself that it was possible because we were getting questions like, how much housing do we have around transit? How can we can answer that question with any degree of specificity or certainty? We took some imperfect datasets, combined them together, tried to overcome the shortcomings of each with the others to create a new methodology for estimating residential units at the location level, which didn’t exist to our satisfaction. So this was our way of experimenting with that methodology and answering that research question — how well have we placed housing around some of our key rail transit infrastructure?
Once we were done with those efforts, we were like, this is kind of cool. We’ve done the research. It was really important to us to put it out into the world in a way that would solicit the most interaction and engagement, because we wanted to learn from people who know these communities really well and go to that station and commute from that station, or have worked on a development project in that station to tell us we’re wrong or tell us our methodology missed something. But it was also important to us to have an apples to apples comparison between very different communities. We wanted to be able to compare a metrics like Grafton residential density around Grafton commuter rail station to Ashmont residential density around Ashmont station and be able to say, well, Grafton has 10 housing units, which I think is an actual statistic, and near Ashmont station there are thousands of housing units at this particular density.
We want to be able to start a conversation about why has that happened. Is it centrality? Is it proximity to jobs? Is it exclusionary zoning? To start to name the things that cause these differences and to have two images that you can point to and say, look, I can see the difference. Now let’s talk about why that difference exists. That was our goal. I think we used a shiny app through our development to communicate that information, because that was the tool that was available to us in our skillset. I think what we would have loved to be able to do is have people interact even more with those data points and click on a parcel and see that information live and be able to navigate around a map and draw circles where they want to.
That’s something that we’re trying to work towards in the future, but, I hope that answers your question. I think maybe one way to extend this notion is how thrilled we were and how proud it made us to see the interaction that we got from the site. We made so many new connections with people working on the community level or, transportation advocates, groups that we had never worked with before now are partners of ours because we were able to engage on the nexus of our housing infrastructure and our rail infrastructure in a way that resonated with them. And we stumbled into it a little bit. But we’ve learned so much through those interactions. We’ve had people who’ve said, “Oh, I looked at your map for Quincy Center, and I found these 12 properties that your methodology missed.” Great, perfect. We’ll add them to the database. It’s this cool relationship we’ve had in deploying the tool where we’ve brought it to a place that allows people to evaluate it and reference their own reality, and echo it back to us so we can iterate on that project and make it better.
That may not be what we intended to do initially, but it’s what we got. And it was a huge learning experience and is influencing the way we think about our research and the way we deploy tools in the future.
BL: What is one thing you wish the public knew about your work?
TH: I wish people knew that there aren’t a ton of datasets that are very housing specific. We wind up using datasets that are for other purposes, like for example, TODEX is built on assessor’s data. It’s not a housing issue dataset, it’s used to tax properties. It’s not meant for public policy analysis. So, research questions that seem simple are really hard and they require not just a lot of data work, but creativity in the way we combine datasets that are for completely different purposes, in order to get some kind of insight into the issue that we’re exploring. It’s never perfect.
Learn More
If you enjoyed this interview with Tom Hopper from the Massachusetts Housing Partnership, please find some of our more recent data-related programming, such as:
- Our GIS data-themed Angles on Bending Lines lecture series, available to watch on Youtube
- Our new follow-along digital textbook for getting started Making Sense of Maps and Data
- Interactive tool by LMEC curator, Garrett Dash Nelson, for exploring inequities across Massachusetts town borders, Neighbors in Name Only
Our articles are always free
You’ll never hit a paywall or be asked to subscribe to read our free articles. No matter who you are, our articles are free to read—in class, at home, on the train, or wherever you like. In fact, you can even reuse them under a Creative Commons CC BY-ND 2.0 license.