Because the word ‘global’ has become an almost expected addition to much of what we discuss in the 21st century, we can fail to realize the significant and overlapping distances which are fundamentally embodied in our landscapes and implicated in our lives. These distances can be literal—the many thousands of miles of communications lines or shipping lanes which belt the world—as well as more abstract, such as the distances that connect the almost unimaginable number of people and processes involved in the construction and subequent use of just one of Boston’s hundreds of high-rise buildings.
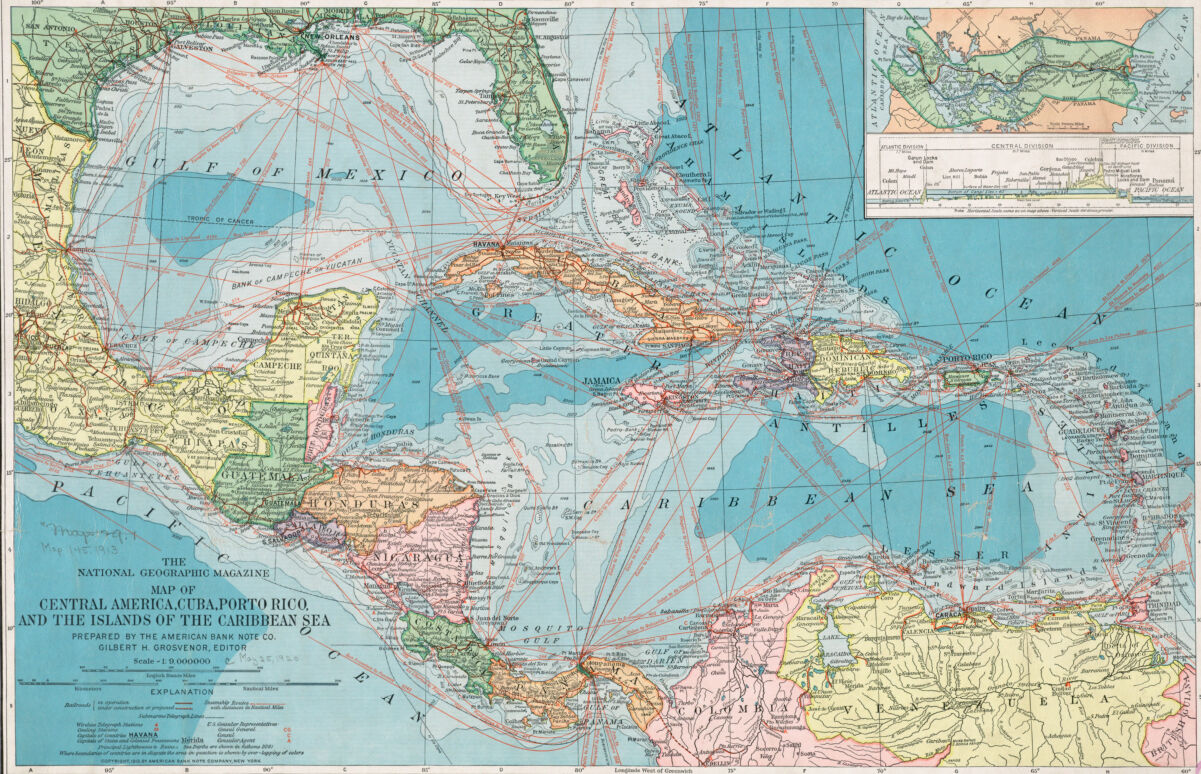
This 1913 map of Central America and the Caribbean Sea prominently shows the dense criss-cross of steamship routes linking cities and disparate countries.
“Almost” unimaginable is the caveat which saves our careers here at the Leventhal Center; a large part of the value in the quarter million items in our collection lies in their ability to encapsulate these distances and represent them in a form that can be visualized at a surface level. On one hand, a world map concentrates in one image the broadest possible expanse of literal distance and all of the billions of lives, places, and experiences contained therein. Conversely, increasingly detailed and technical maps—such as the fire insurance or real estate atlases in our collection—condense the emerging complexities of an increasingly industrializing and urbanizing world into a simple set of easily legible and striking graphical symbols.
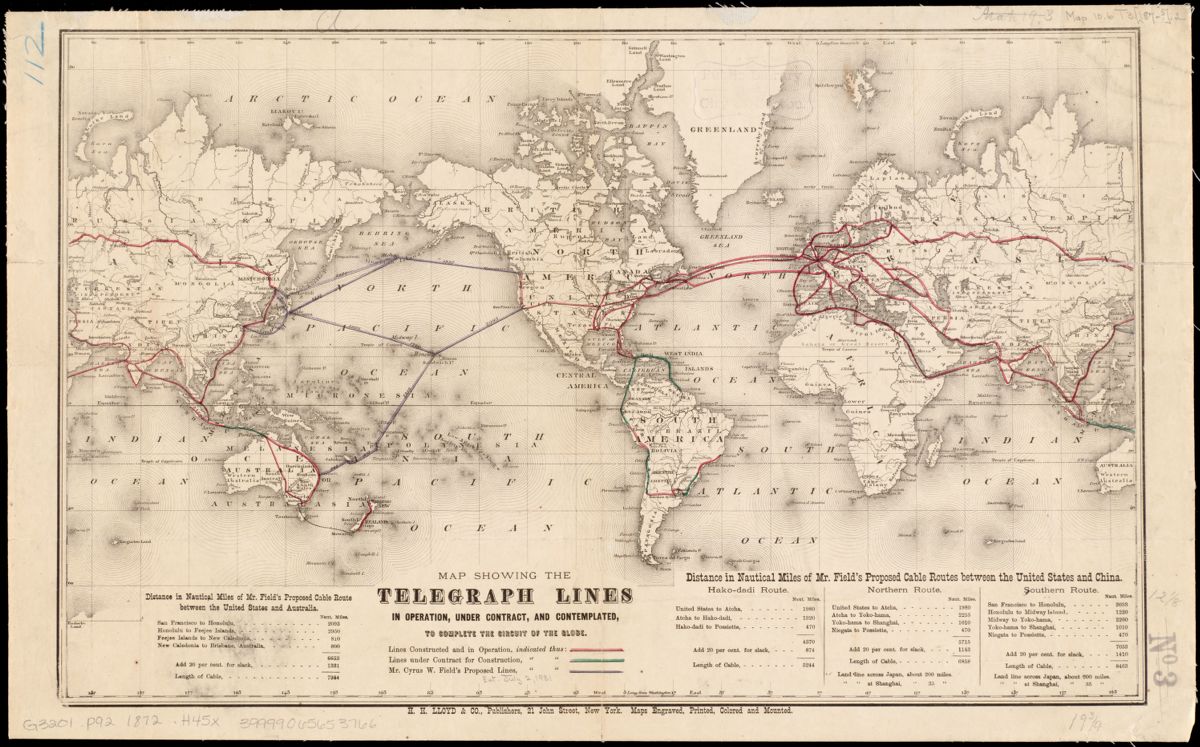
This 1872 world map depicts completed and in-construction telegraph lines at a time when the "circuit of the globe
There is no deliberate deception here; simplification and representation are a basic part of the map-making process. But there is always a risk of accepting the world presented by the map at the surface, of failing to realize the countless very real and very human implications of the distances and data points presented to us. A type of investigative rigor is demanded in order to recognize the omissions and distortions of the medium we are working with, and to recognize the map as a document both influencing and being influenced by the living dynamics of economic growth and exploitation across increasingly vast expanses.
The birth of an urban world, with new types of buildings and businesses, new types of employers, workers, and landowners, brings about an industry of publishers, cartographers, and printers translating the world into a new cartographic language to meet the information needs of new economic interests. The urban atlases made to satisfy the emerging needs of the real estate and insurance industries, are peppered with the names of corporations and individual landlords, and are dense with technical information on construction materials and municipal data. As the maps grow denser and more detailed, each rigidly demarcated parcel of land and each carefully labeled landowner hides an increasingly larger number of individual lives and lived experiences; the growth of this urban world always demanding more and more workers and tenants.
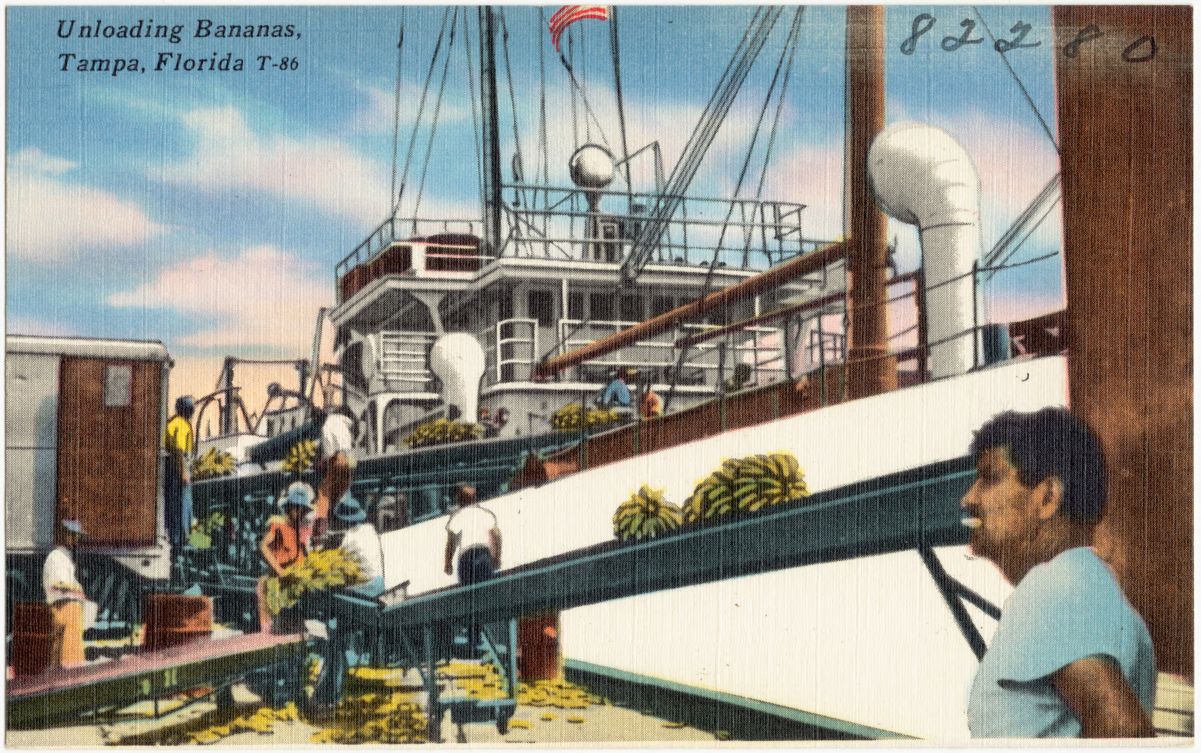
This postcard (ca. 1930-1945) depicts workers unloading bananas in Tampa, Florida.
Uncovering the humanity hidden in the thousands of maps of Boston in our collection is a central goal of the Leventhal Center. But for however many maps of Boston we have in our collection (~1,500 digitized), there is a much more powerful omission that occurs simply thanks to the margins of the page. The seemingly isolated world we are presented with dramatically transforms itself into the skyscrapers, businesses, and factories of 20th century Boston. Meanwhile, well past the limits of the map’s gaze, the means of creating the markets, generating the profits, and acquiring the resources required by industrial modernity, are occurring in equally dramatic fashion across the globe. Here we have distance in all of its forms: in the thousands of miles between a Boston sugar refinery and the cane fields of the Caribbean or a Colombian banana plantation and the kitchens of America; as well as between the countless invisibly linked individuals working, producing, and purchasing on either end of these expanses.
All of these distances are present, though translated and obscured, within the outwardly accessible and visually striking language of the maps which are so implicated in the creation of modern Boston. I don’t think it’s possible to fully uncover what is basically an infinitude of shifting relations which span the globe, but by focusing on individual strands and seemingly disconnected artifacts, as they orbit around the city of Boston and the field of cartography, I think it’s possible to tease out a greater understanding of the processes and relationships built across immense distances which have created our present reality.
Boston Bananas
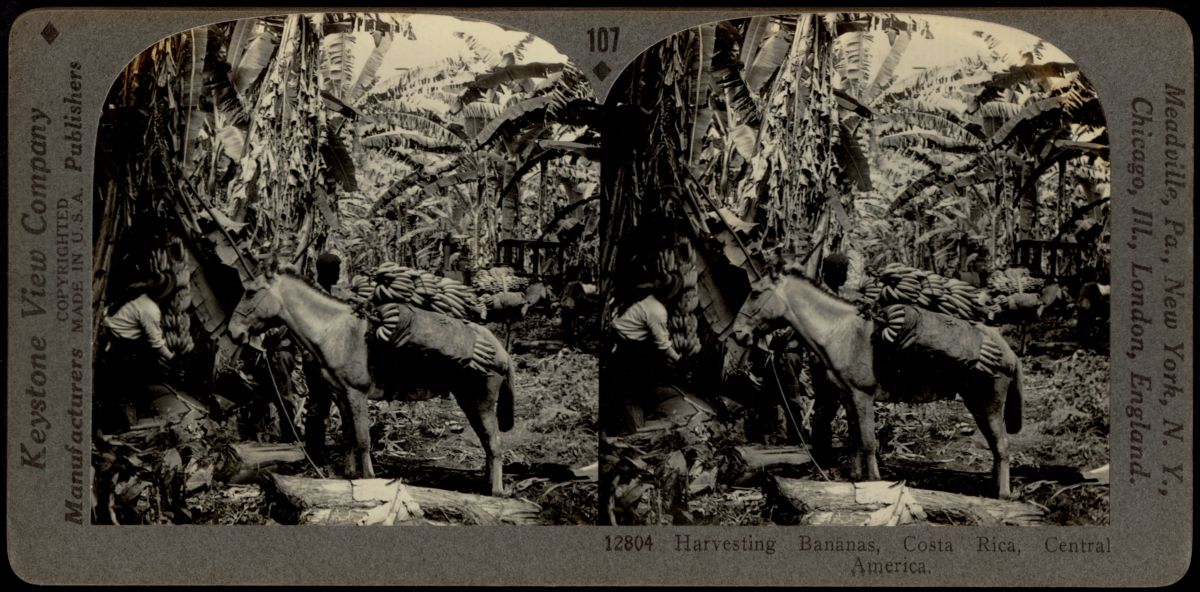
This stereograph (ca. 1879-1930) depicts a banana plantation in Costa Rica. The reverse side gives a short description: “The little ‘banana railroad’ that we see in the distance is owned by the United Fruit Company whose great refrigerator steamers carry vast quantities of this fruit…Today the people of the United States and Canada alone consume 50,000,000 bunches of bananas in a year.”
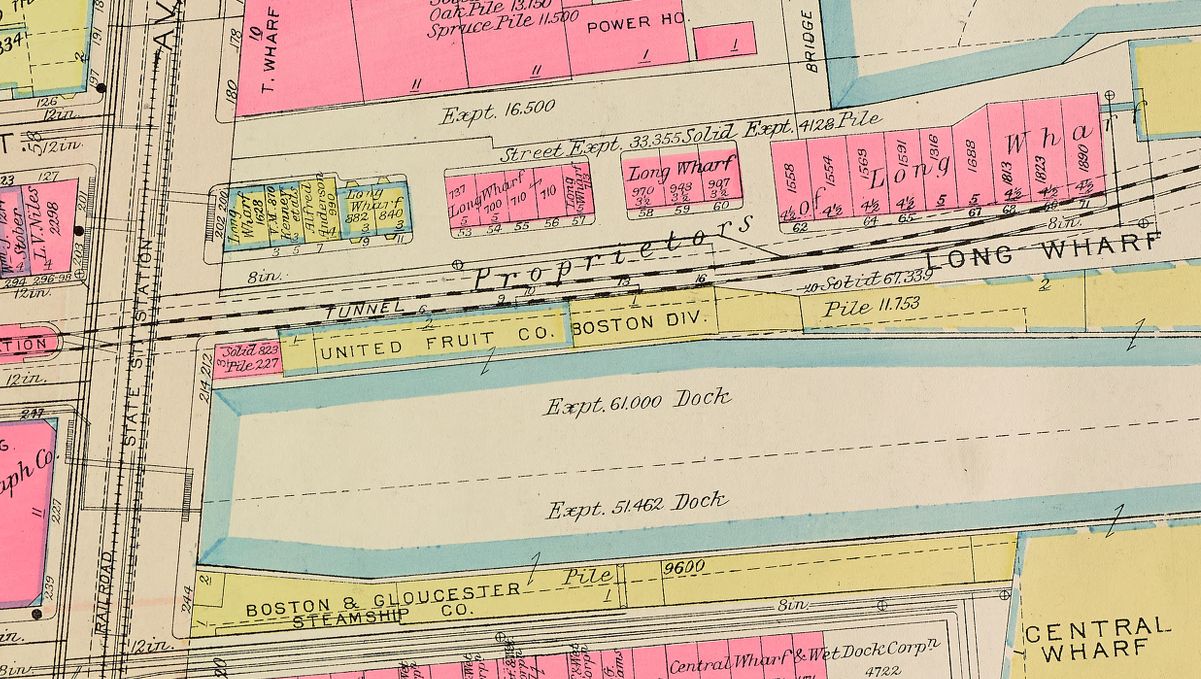
This 1928 Bromley Atlas carefully lists building owners, railway gauges, property sizes, and many other technical details.
However two-faced the visual language of maps can be, I’ve always thought the written language of documents and records can be equally deceptive. On a 1928 Bromley Atlas, the simply listed name: "United Fruit Co. Boston Div." on a row of wooden buildings on Boston’s long wharf, outwardly promises little alongside the symbols and details of an urban atlas. The same name, in the same year, on a short telegraph to the secretary of state, plays an outsize role in a document whose tone could not be doing more to elide its content:
Sir: With reference to my previous reports concerning the Santa Marta strike…I have the honor to report that the Bogota representative of the United Fruit Company told me yesterday that the total number of strikers killed by the Colombian military exceeded one thousand. I have the honor to be, Sir, Your obedient servant.
Telegraph from Jefferson Caffery, Ambassador to Colombia
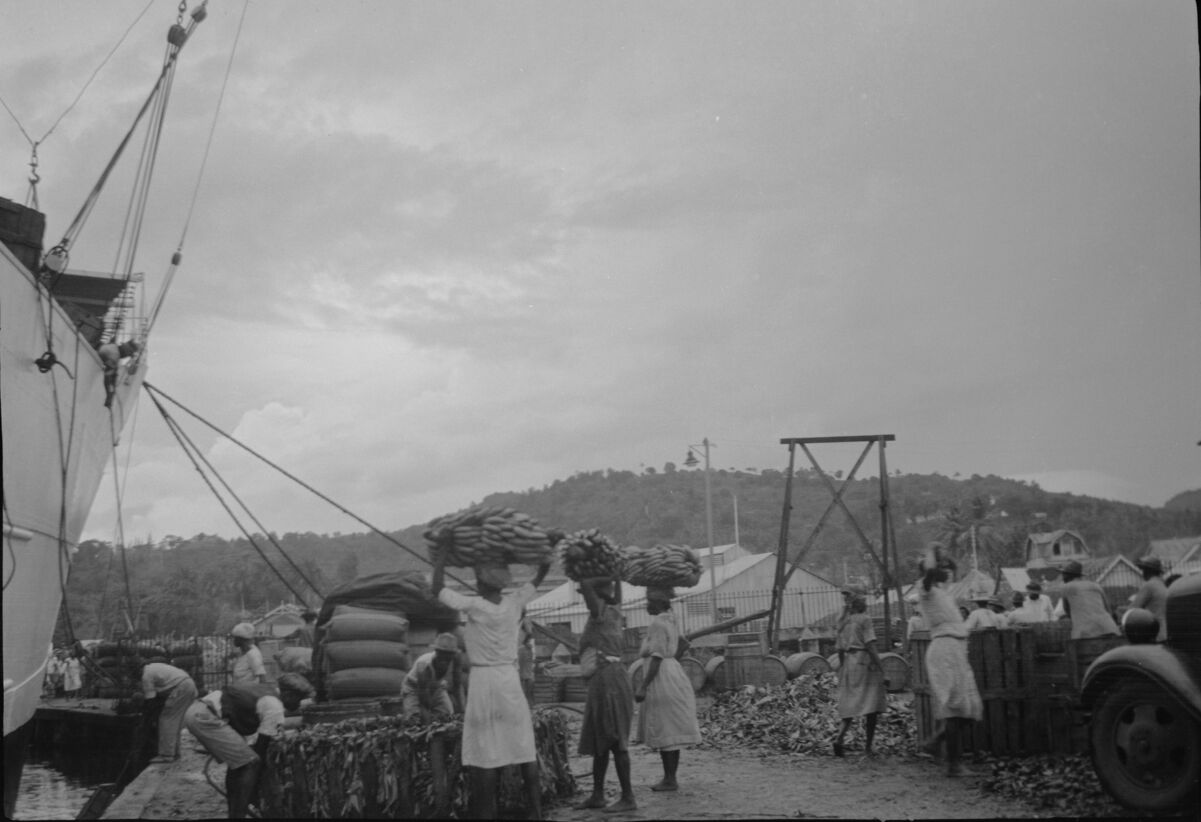
This 1936 photograph depicts workers loading bananas onto a United Fruit Co. ship docked on the island of St. Lucia.
The path traveled by this telegraph, across the Caribbean to the burgeoning east coast of the US, followed a route which by 1928 was a busy thoroughfare for North American dollars in every conceivable form.
In Colombia, following the lucrative model of Banana growing which had begun in Central America and the Caribbean, North American interests invested in the construction of railways, communications lines, and other infrastructure by securing land grants, tax exemptions, and security guarantees from local governments. Banana growing plantations would sprawl from this base, drawing in thousands of workers and fundamentally reshaping local communities and economic landscapes.
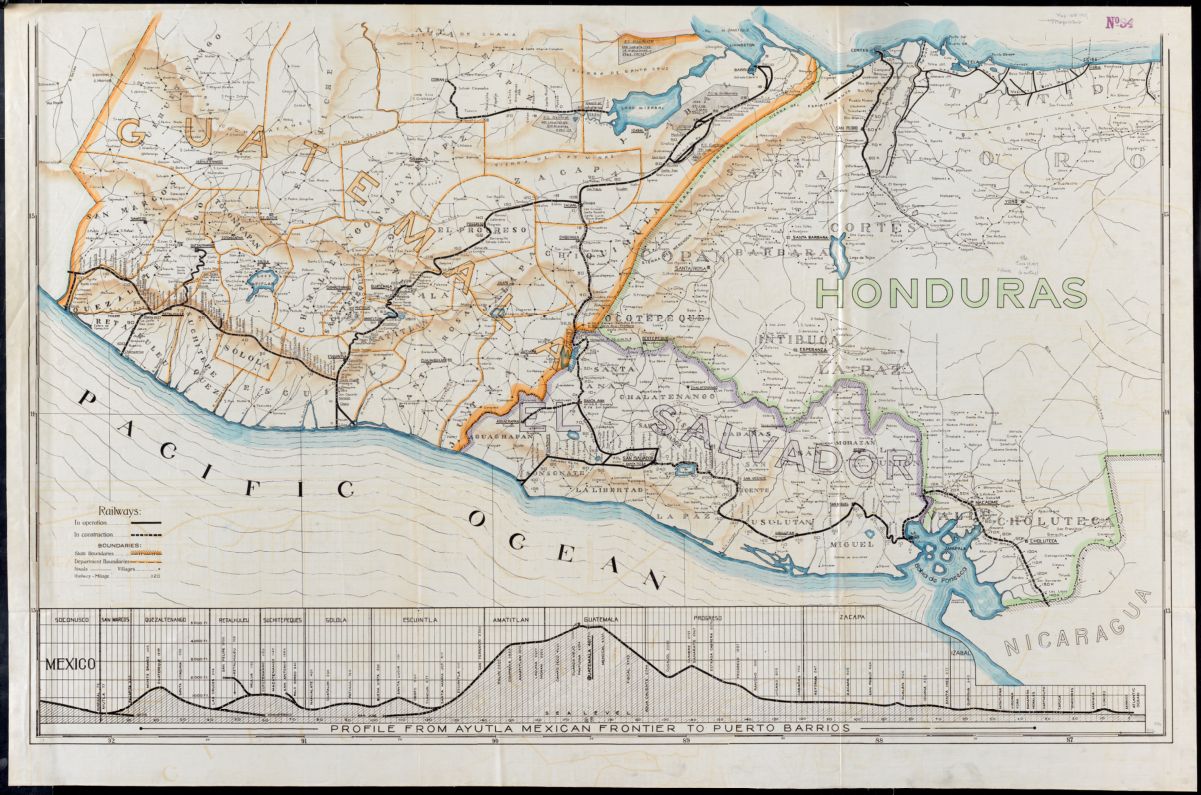
This 1917 map of Guatemala, Honduras, and El Salvador, is based on a drawing by "Internation Railways of Central America" and shows their extensive railroad holdings across this large swathe of Central America. The IRCA was a US-based company which fell under the control of the United Fruit Co. in 1936.
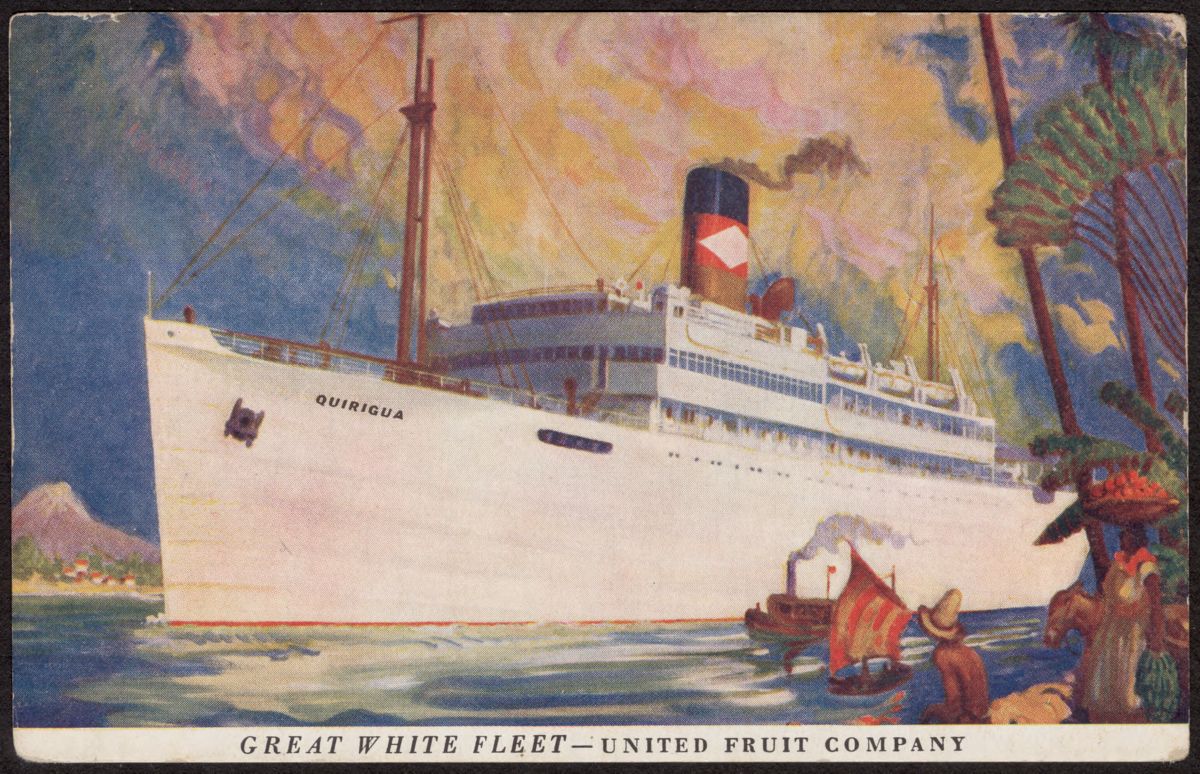
This postcard ca. 1896-1980 depicts a steamer of the United Fruit Company's "Great White Fleet", here shown in an exotic setting, dwarfing the native surroundings.
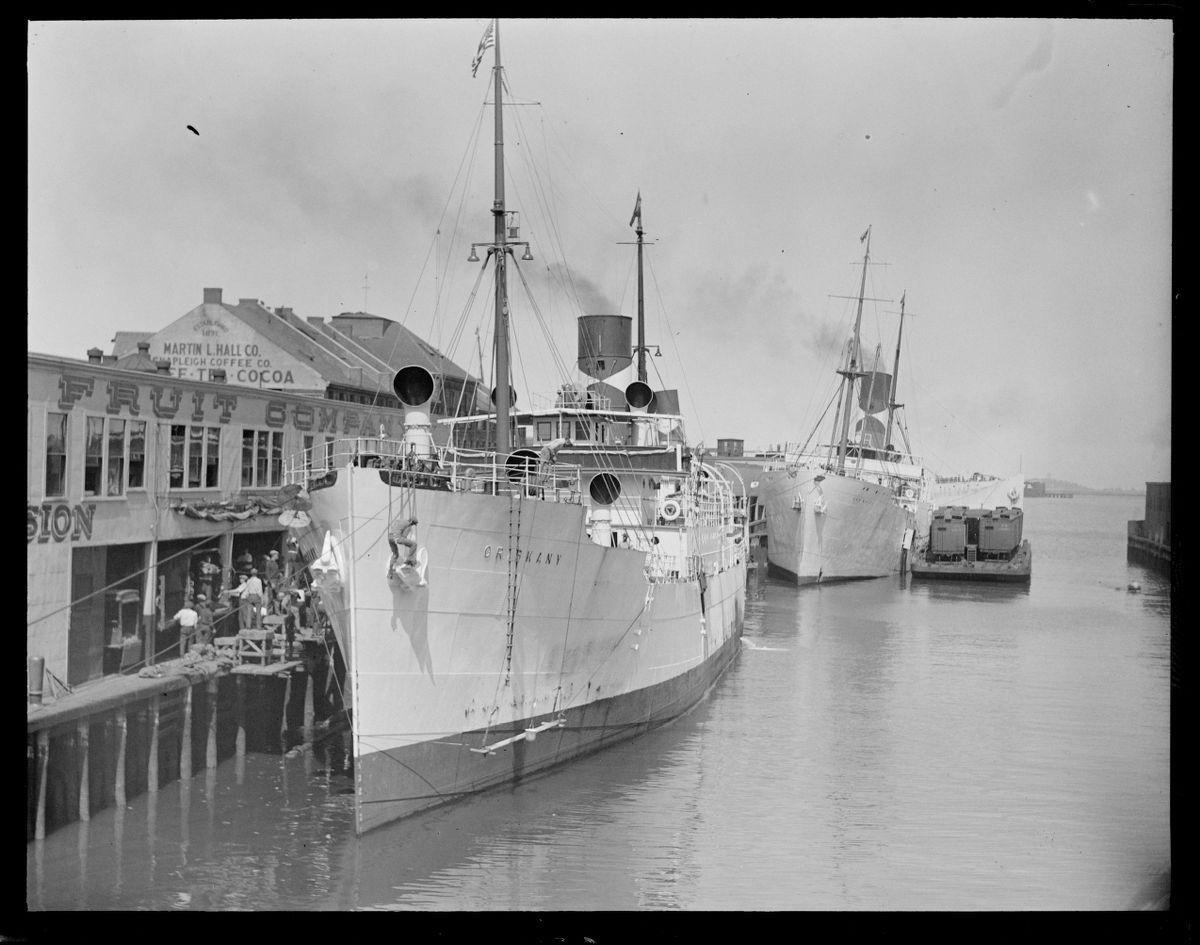
This photo from around 1930 depicts one of the United Fruit Co.'s shipping vessels docked alongside Boston's historic long wharf.
This was one end of a multi-million-dollar fruit-growing empire which included not just the 25,000 workers who would go on strike in Colombia in 1928, but hundreds of thousands of acres of land, miles of railway line, telegraph wire, the world’s largest private fleet of shipping vessels, and all of the political interests contained within. This tangle of relationships seeps between national boundaries and invisibly links together a host of unique developments: the transformation of the Banana in North America from a rarity to an everyday good, the shifting fortunes of North American financiers and the metropolises which house them, and the often-violent history of government and labor in Latin America.
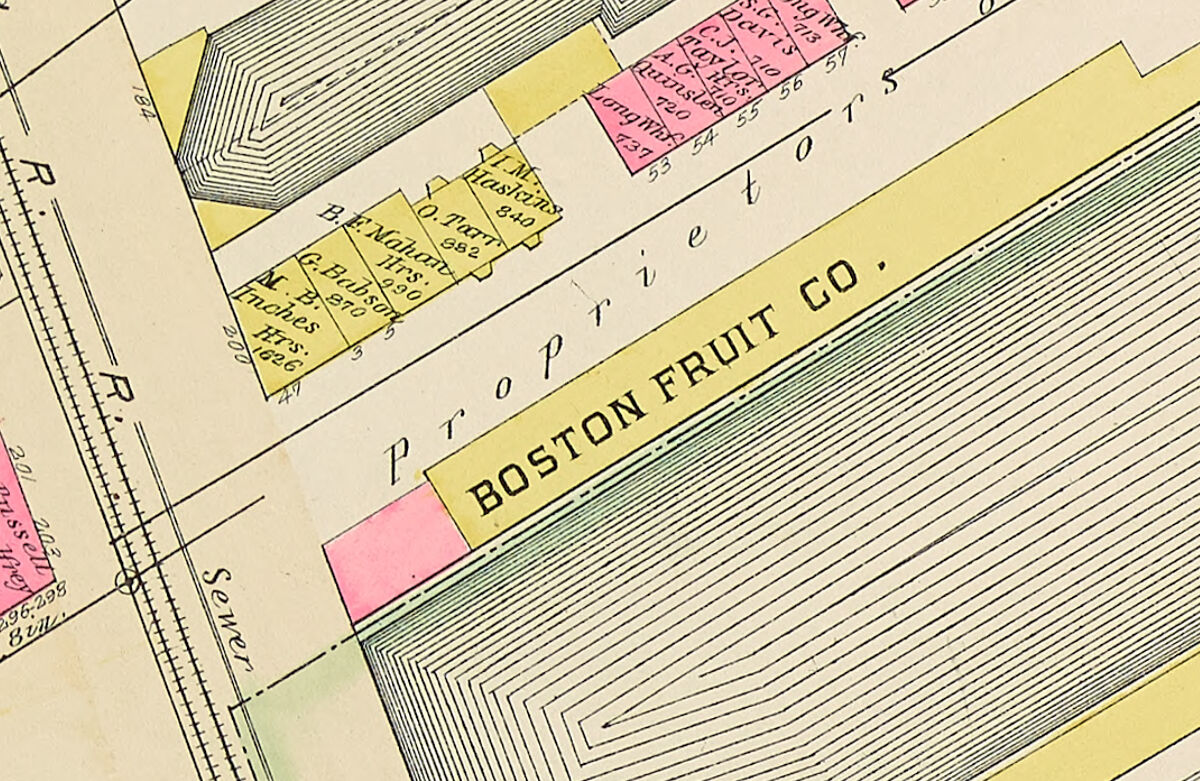
In Boston, the tremendous profits of these international ventures accompany the growth of the financial district and the development of the city. In 1890 a group of Boston-based merchants and businessmen leveraged their existing investments in the Caribbean to form the Boston Fruit Company, visible on Long Wharf in an 1895 Bromley Atlas.
By 1902, it is the United Fruit Company which exerts increasingly larger ownership over the wharf, as the Boston Fruit Company’s primarily Caribbean interests merged with the Central American and Colombian interests of Boston-based railroad magnate Minor C. Keith.
This would mark the beginning of the increasingly powerful near-monopoly of United Fruit, which exerted control over every aspect of the Banana trade from the amenities in plantation towns to fruit distribution in the US and just about everything in between.
These massive economic interests across the Americas would coincide with both US military interventions in the region (between 1890 and 1930 to varying degrees in Cuba, El Salvador, Panama, Honduras, Guatemala, the Dominican Republic, Haiti, and Nicaragua) as well as the making of East Coast high-rise prosperity (Boston’s own Exchange building, Ames Building, South Station, and Custom House tower each built in 1891, 1893, 1899, and 1913 respectively).
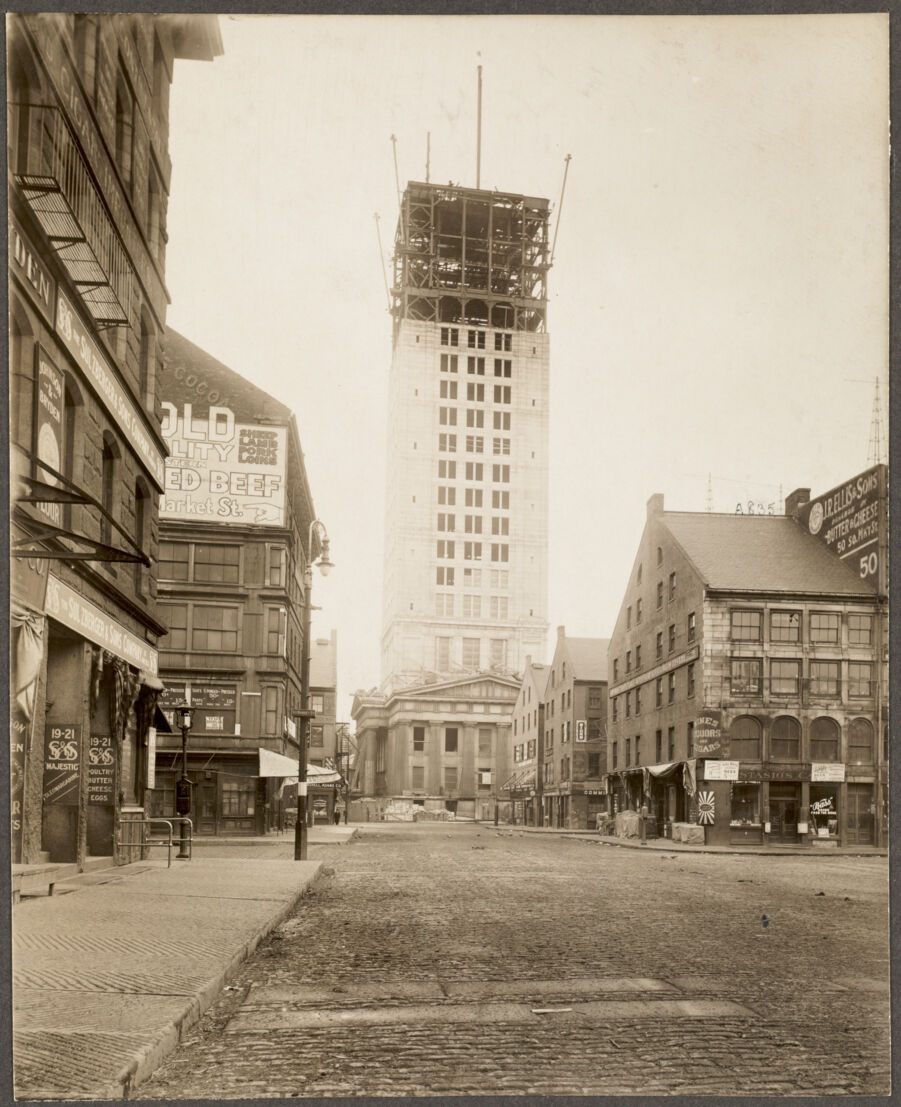
This photograph (ca. 1913-1915) shows the streets of Boston as the now iconic Custom House Tower is constructed.
Sweet City of Boston
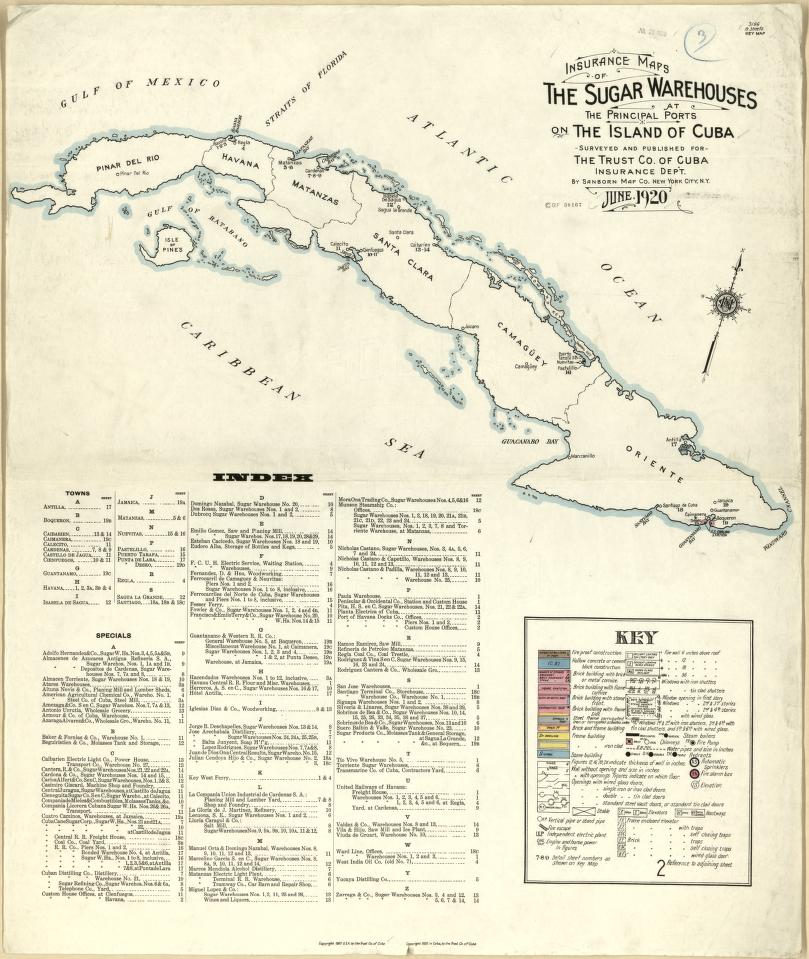
The index page for the Sanborn "Insurance Maps of the Sugar Warehouses at the Principal Ports on the Island of Cuba"
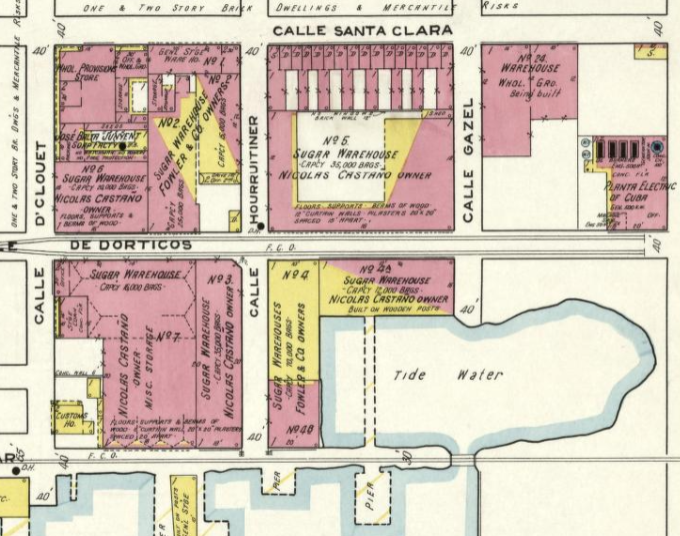
Detail showing precise measurements and technical specifications, down to the interior level of some buildings.
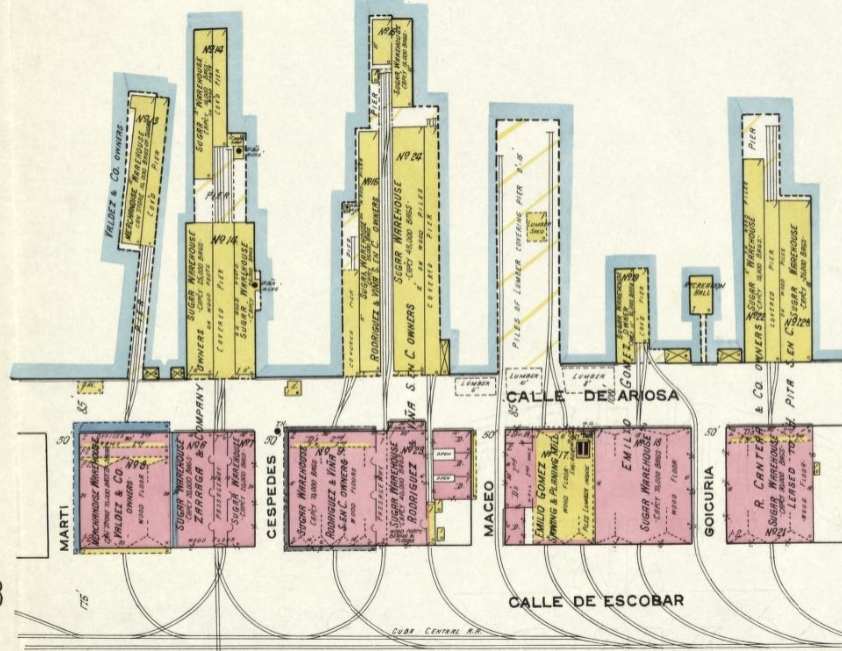
Detail showing the strategic placement of sugar warehouses, connected by rail to the sugar cane fields and mills, and by sea to eager markets.
An industry with an even greater significance to Boston offers a unique example of maps as markers of economic significance which can fold together the opposite ends of these increasingly broad expanses. By 1920 the importance of the sugar industry to the US economy, and the scale of its investments abroad, brought about one of the few instances of a Sanborn fire insurance atlas being made of a territory outside the boundaries of the US. This document depicts in meticulous detail the sugar warehouses and associated railway depots and shipping docks of twenty-one Cuban towns, with an eye towards technical details like loading capacity and building material.
This is the same visual language almost exclusively used by map-making companies to depict urban cities like Boston. Here, the margins of the page have followed the money, and now a Cuban warehouse can be mistaken for one in Boston, thousands of miles away. More importantly, it can be appraised and administered with the same ease as an asset in the home country. Critically, the margins of the page stop just short of these direct economic assets. The maps rarely stray more than a few hundred feet in from the coastline.
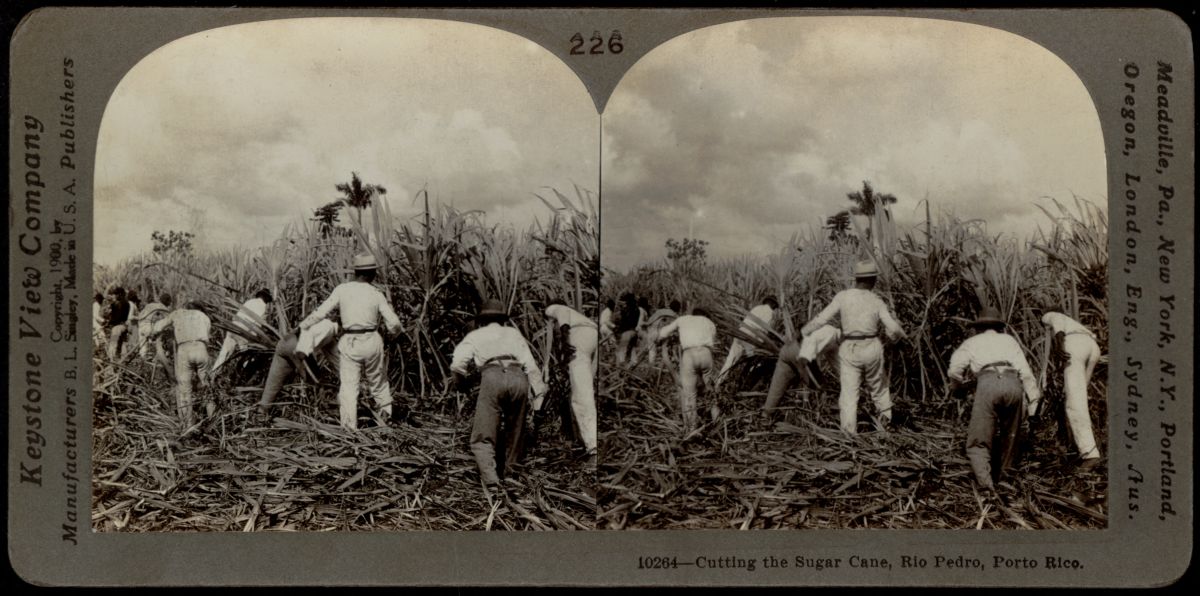
This stereograph from around 1910 depicts the sugar cane harvest in Rio Pedro, Puerto Rico.
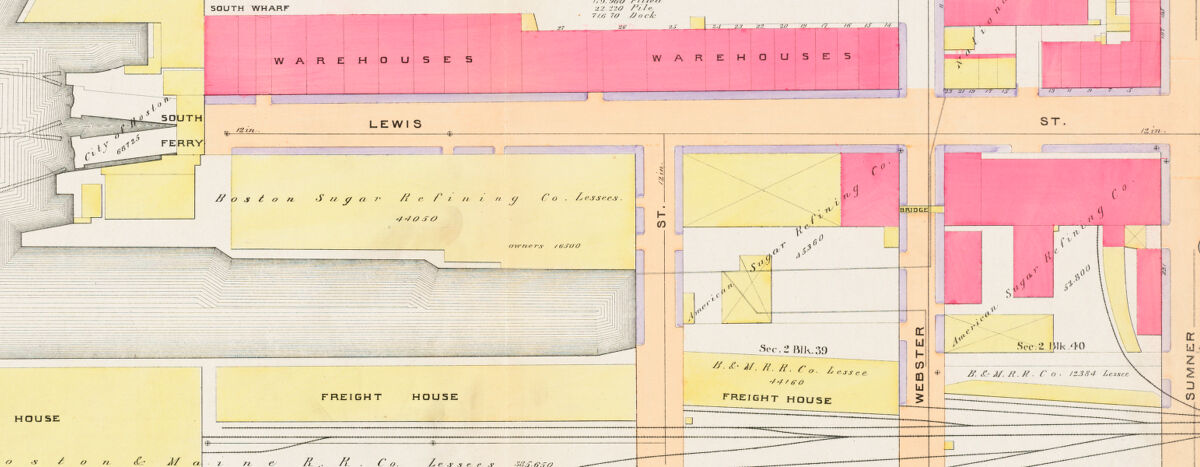
This 1892 Atlas of East Boston depicts the holdings of the Boston Sugar Refining Company along the harbor in East Boston.
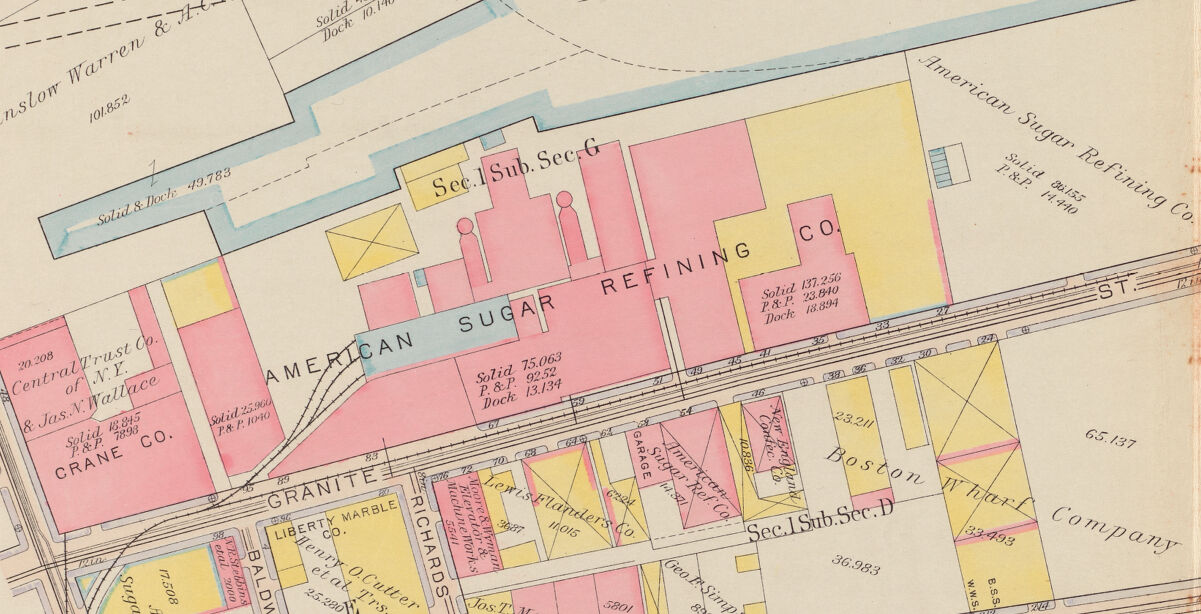
This 1919 Atlas of South Boston depicts the American Sugar Refining Company's large sugar refining complex along the Fort Point Channel
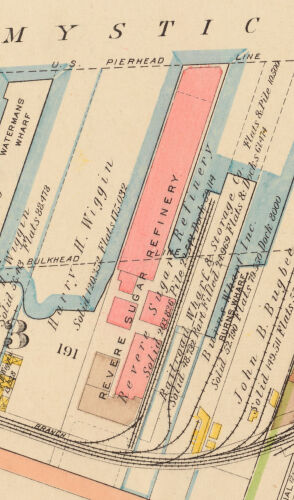
This 1922 Bromley Atlas of Charlestown depicts the Revere Sugar Refinery along the Mystic River.
Thousands of miles from that coastline, the equivalent fire insurance atlases in Boston directly show the growing physical influence of what would be the largest manufacturing industry in the city by 1900. In East Boston, by 1892 the Boston Sugar Refining Company controls two city blocks and a stretch of the wharf. In 1919 along the Fort Point Channel in what is now the Seaport district, the American Sugar Refining Company dominates a considerable stretch of the waterfront. And in 1922 the Revere Sugar Refinery is visible along the Mystic River in Charlestown.
Between the consumers with a growing taste for sweetness, the sprawling refineries along Boston’s waterways, the ships needed to transport the raw sugar from the tropics where it grows, and the workers who harvest it to begin with—we are again faced with a web of relations stretched across vast distances.
As it happens, by 1887 the Boston Sugar Refining Company was a subsidiary of the American Sugar Refining Company, commonly known as the Sugar Trust. The trust represented the concentration of nearly all sugar manufacturing on the East Coast into one immensely powerful entity which aggressively undermined competition and secured its interests at all levels of production.
If that isn’t enough déjà vu, the Revere Sugar Refinery served as a subsidiary of the United Fruit Company, which would use its tropical holdings to dabble in adjacent industries. In a manner characteristic of this region and time period, the sugar industry represented a concentration of North American investment and profit with historic consequences for local communities on both ends of this relationship.
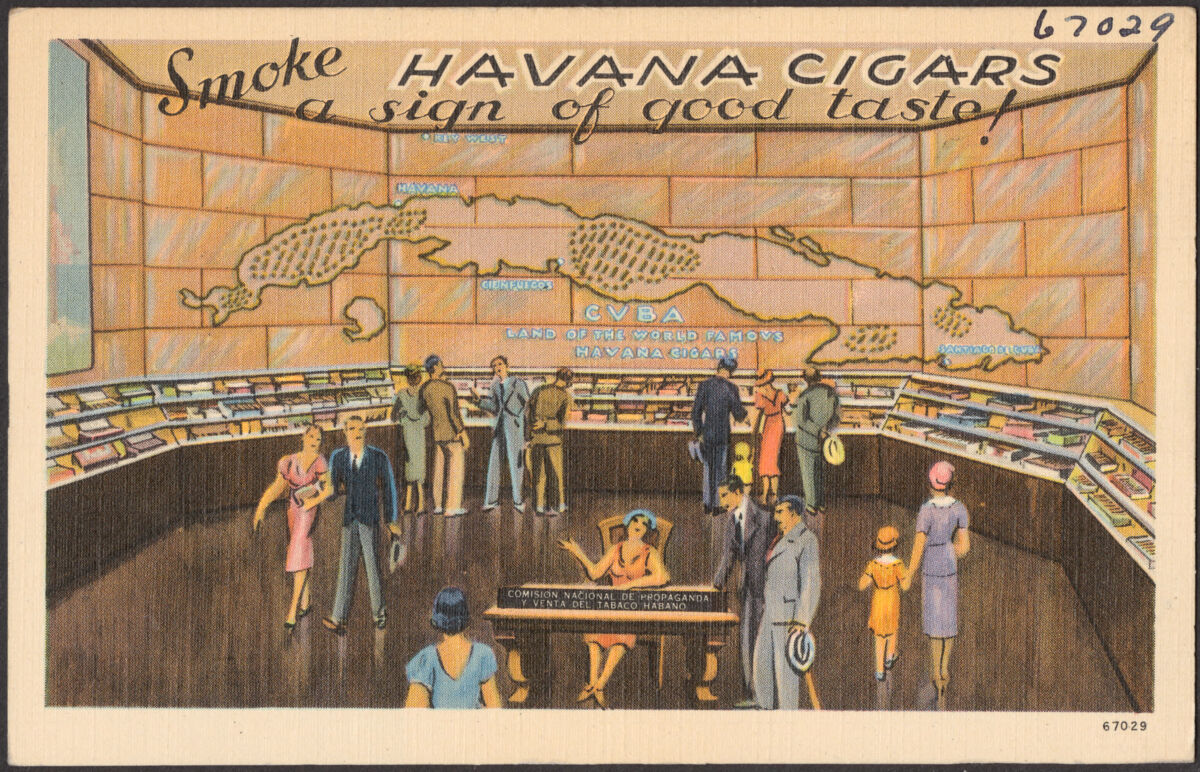
This postcard (ca. 1930-1945) advertises to an American audience another significant Cuban luxury good: Tobacco. The reverse side cheerily states: "Cuba is a good neighbor. 75% of its imports are from the United States."
Starting in 1898 with the Spanish-American War, which would firmly place Cuba and Puerto Rico in the USA’s sphere of influence, and continuing with two further military interventions to defend economic interests in Cuba in 1906 and 1917, the sugar industry tightly bound the government and economy of sugar producing nations like Cuba to the demands of the North American market. Roads, railways, and communication lines expanded and brought cane fields, sugar mills, and warehouses to every corner of the country. Meanwhile, the undiversified nature of the local economy meant that American imported goods could find an easy market. While Cuba became dependent on US imports and the raw extraction of goods to be sent north, the sugar industry reaped enormous profits and helped cement the financial and commercial significance of cities like Boston.
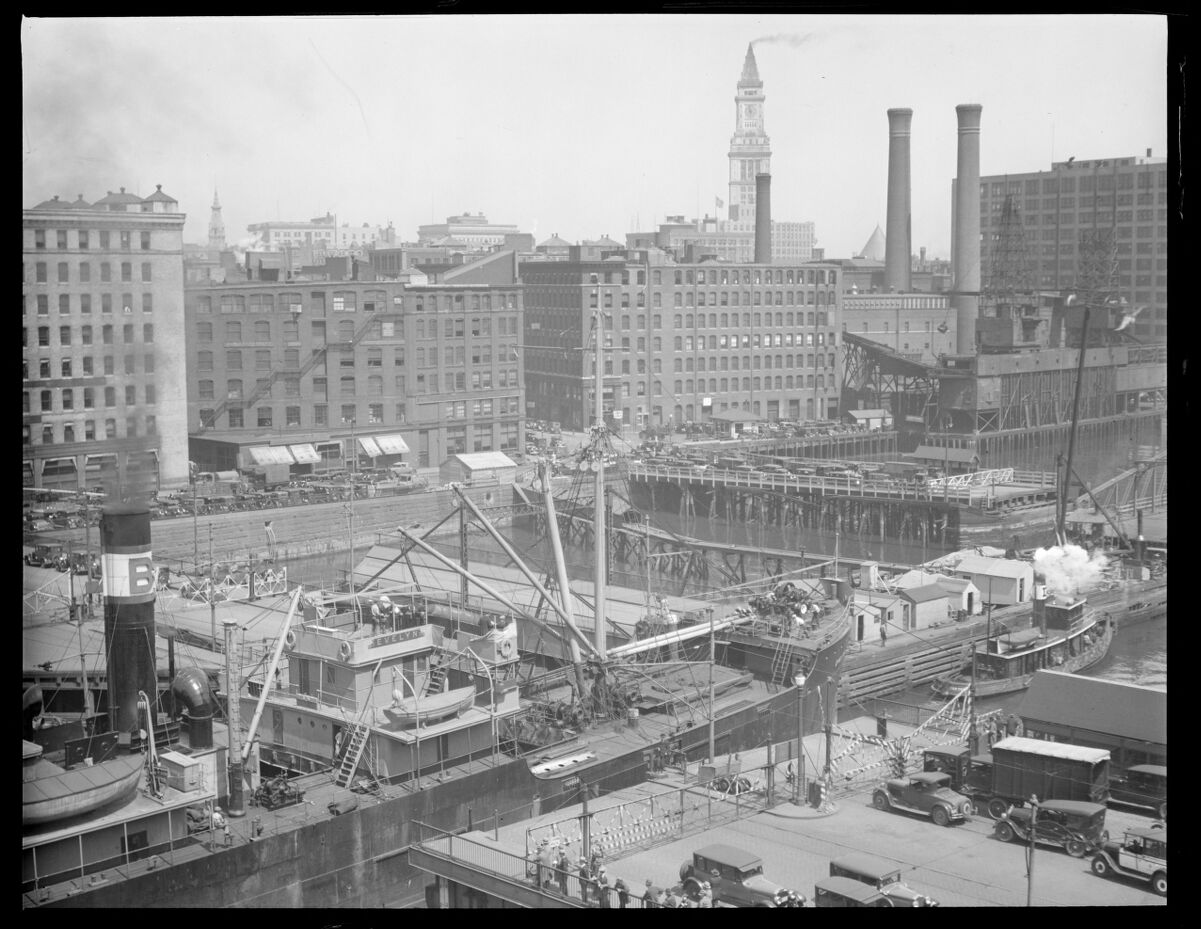
This 1929 photograph depicts a "sugar boat
These events have continuity with the present not just through the literal reshaping of cityscapes and countrysides, but also in creating the now ubiquitous model of transnational corporations and economic relations which encapsulate the globe. The easiest proof of this is simply the continuing influence of the two main corporate entities mentioned here: the United Fruit Company lives on in its succesor, Chiquita Brands International Incorporated; the American Sugar Refining Company lives on through its most prominent brand, Domino Sugar.
Our articles are always free
You’ll never hit a paywall or be asked to subscribe to read our free articles. No matter who you are, our articles are free to read—in class, at home, on the train, or wherever you like. In fact, you can even reuse them under a Creative Commons CC BY-ND 2.0 license.