On March 1, we hosted From The Vault: Women in Cartography! From The Vault is a biweekly event series showing collections objects selected by Leventhal Center staff. For this edition of the series, we took a closer look at maps related to women’s history and works from women cartographers throughout time. As leaders in the world of Geographic Information Systems (GIS), women are active in all aspects of cartography today and it’s incredibly important to recognize their contributions to the field.
Anna Beeck, Plan de la ville de Bouchain situé sur les rivieres de la Sensette, et de l'Escaut, dans le comté de Hainaut (1711)
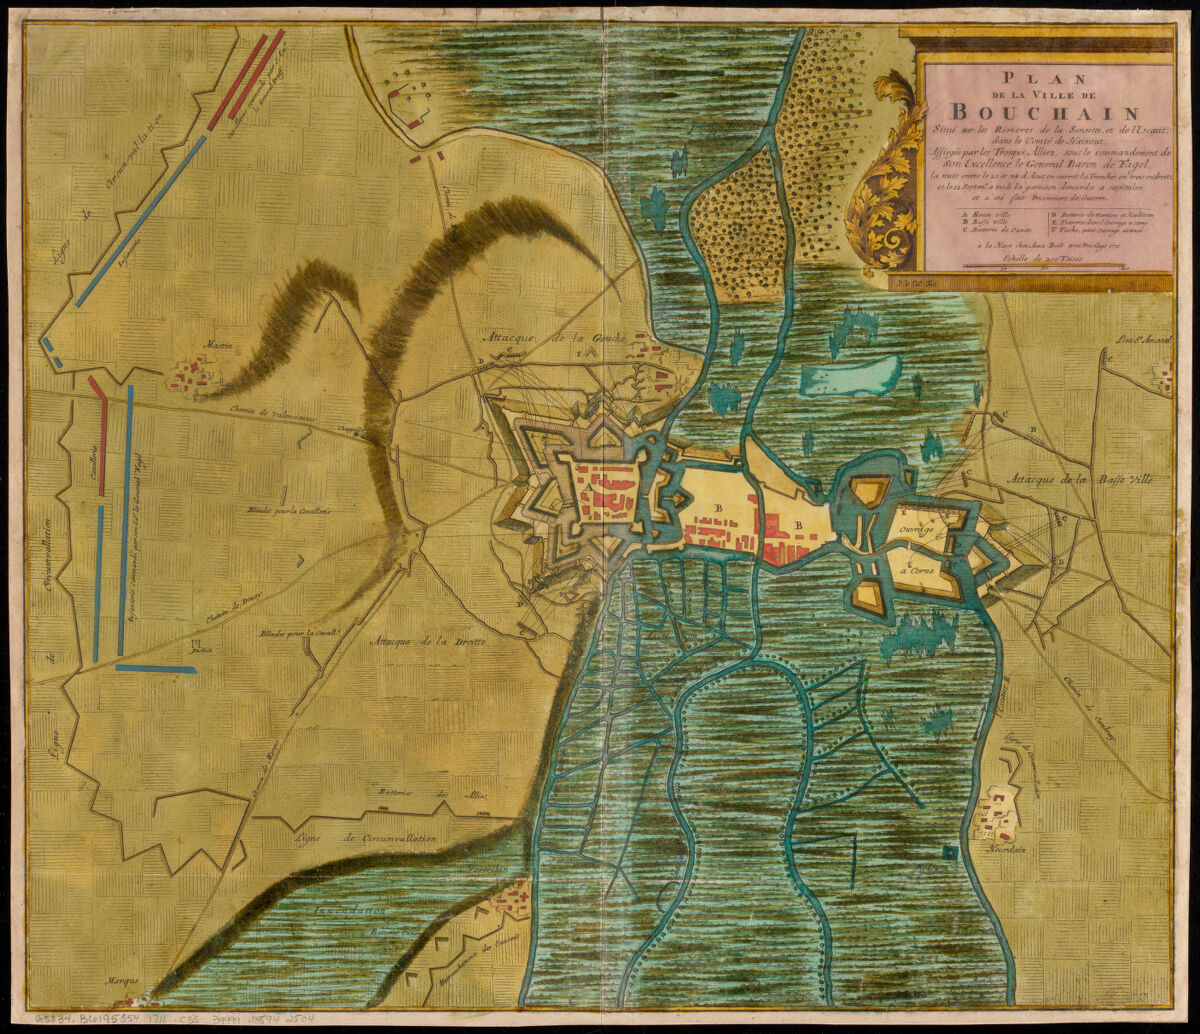
This map is published by one of the earliest female publishers/cartographers and shows military positions and lines of attack during the siege of Bouchain in 1711. Beeck was a prolific mapmaker, printer, and publisher in a time when women were rarely involved in these trades.
Mary E. Johonnot, United States (1822)
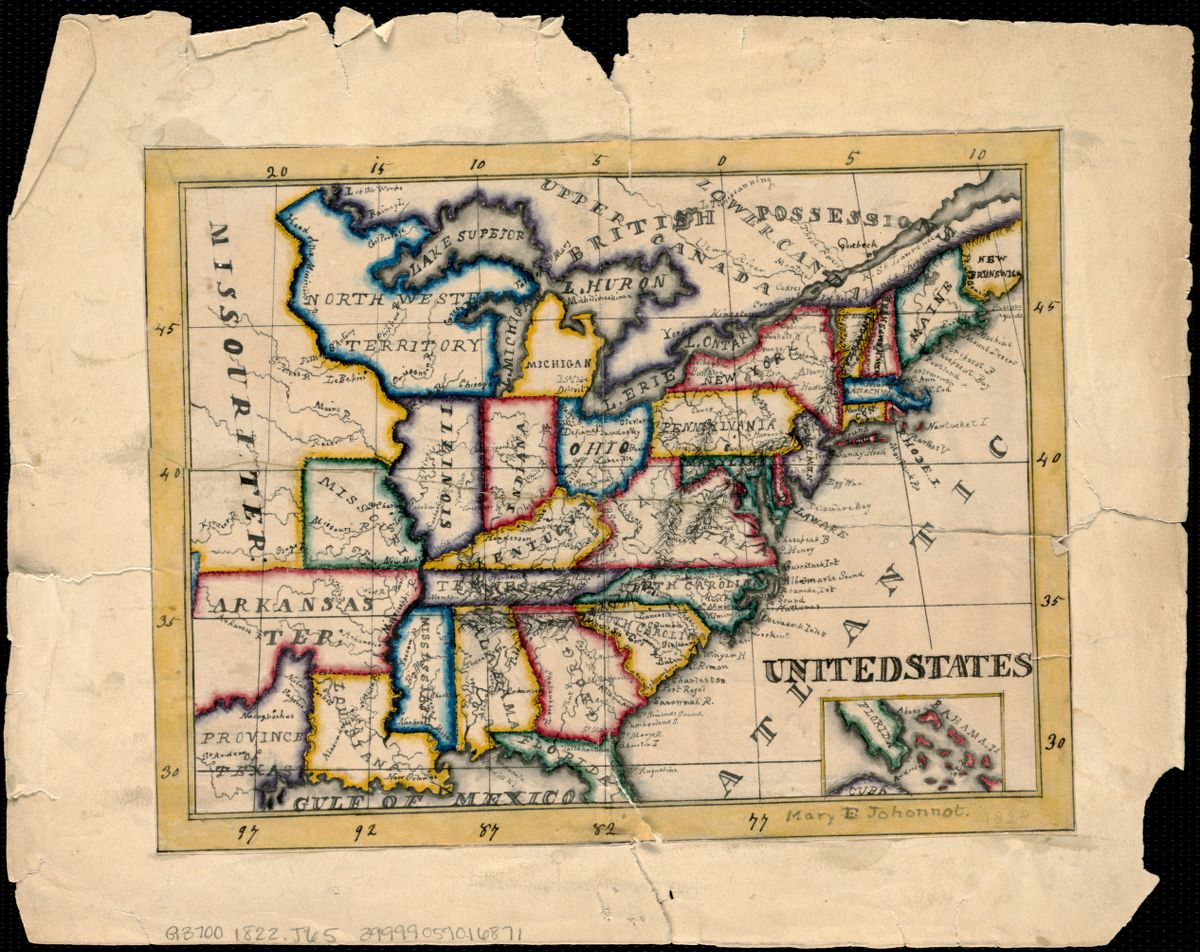
During the late 18th and early 19th century, it was common practice for American female students attending private academies to prepare maps of various parts of the world by copying maps from books or atlases. Most often, girls were taught by female instructors, who drew maps themselves to demonstrate geographic, artistic and design skills to their pupils. This map of the United States, drawn by Mary E. Johonnot of Boston, was most likely compiled in the 1820s as a school geography project, and was based on an earlier map as evidenced by the missing borders of Arkansas and Missouri.
National Woman Suffrage Pub. Co., Inc., Victory Map (1918)
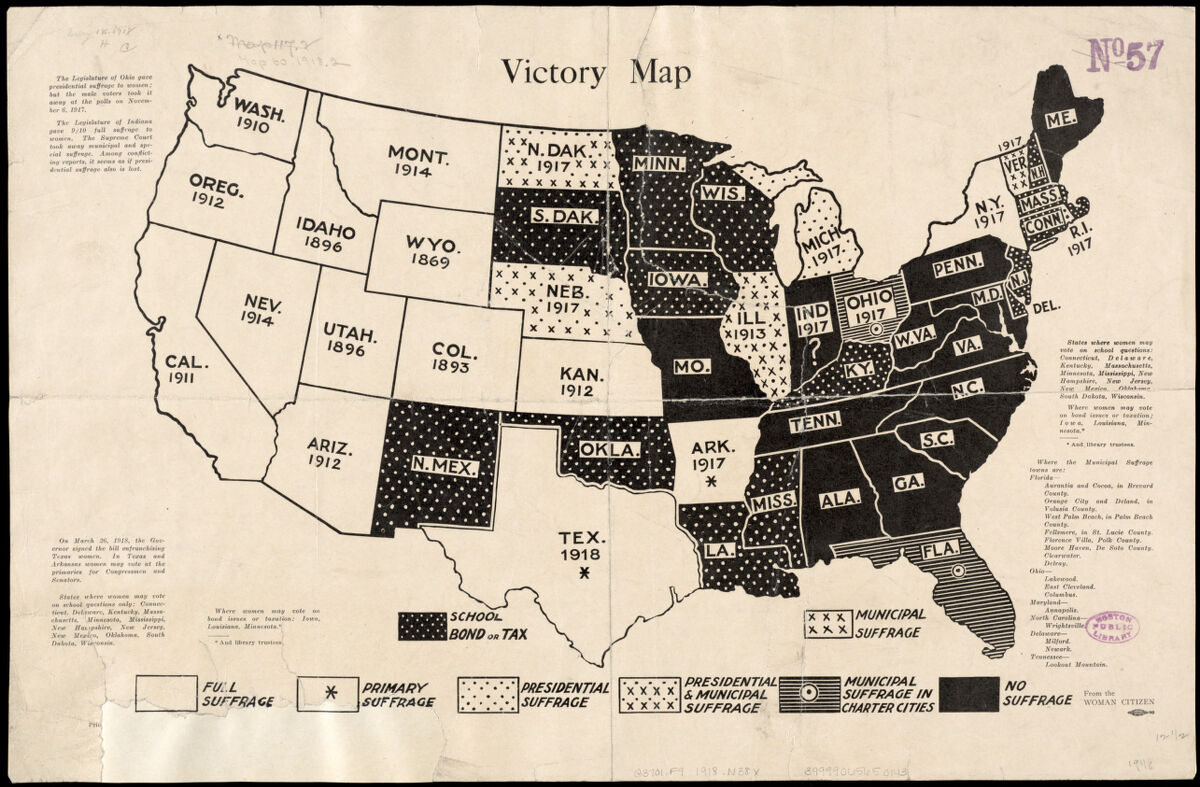
This outline map of the contiguous United States shows the status of woman suffrage in each state circa 1918, just 2 years before the 19th amendment granted women the right to vote. It’s important to note that while the 19th amendment was passed in 1920, many women were barred voting access until the Voting Rights Act of 1965.
Elizabeth Shurtleff and Helen F. McMillin, A Map of the Bermuda Islands (1930)
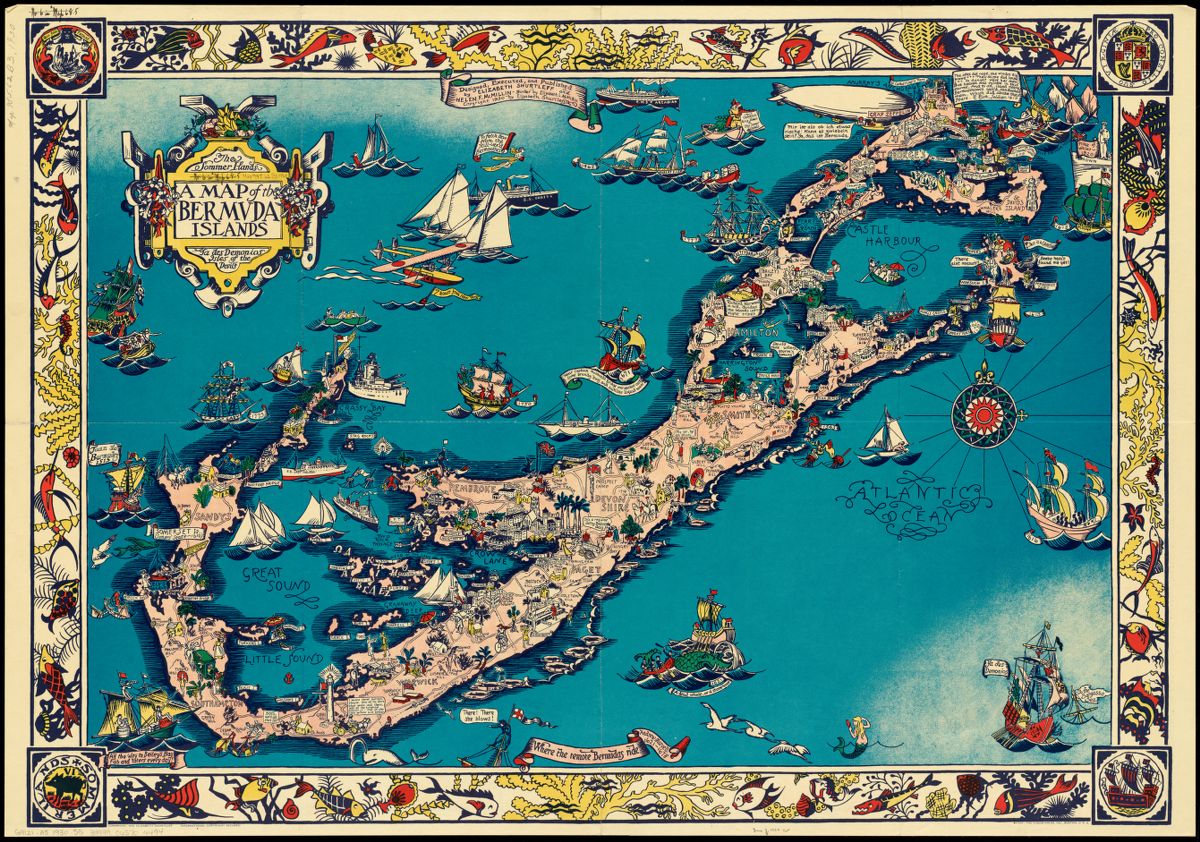
Women were very active in the production of pictorial maps in the early 20th century. These whimsical maps frequently focused on travel and tourism. Bordered by a ribbon of ocean creatures, this 1930 map of Bermuda illustrates various methods of transportation from horse-drawn carriages to pirate ships and airplanes. On shore, tourism reigns with beaches, golf courses, tennis courts, shooting ranges and historic forts. Designed by Elizabeth Shurtleff and Helen McMillin, who studied at the Boston Museum School of Fine Arts and Wellesley College respectively, this map encourages visits to the island by promoting recreation and history.
Marie Tharp and Bruce Heezen, Physiographic Diagram of the Western Pacific Ocean (1971)
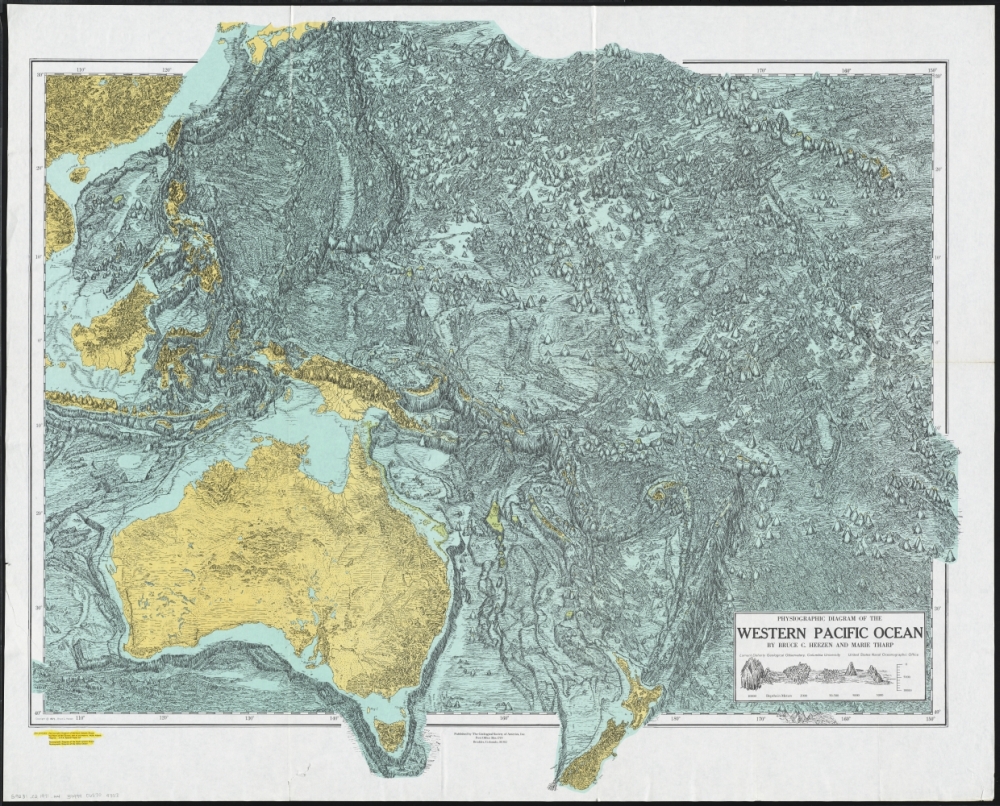
Oceanographic cartographer and geologist Marie Tharp, along with her research partner Bruce Heezen, created the first map of the entire ocean floor. Heezen was credited solely for their work for years, and only later on did Tharp gain her rightful place in the cartographic world (though Tharp credited as a contributor in the BPL catalog). Early editions of ocean floor mapping feature an informal sketch style, while later final editions were sophisticated physical maps with color and shading, applied to reveal the dramatic mid-ocean canyons highlighting the continental divisions of the globe. Numbers on the map indicate depth of the ocean floor and elevations of individual undersea mountains.
Valerie S. Goodwin, City Grid IV (2007, Reproduction, 2015)
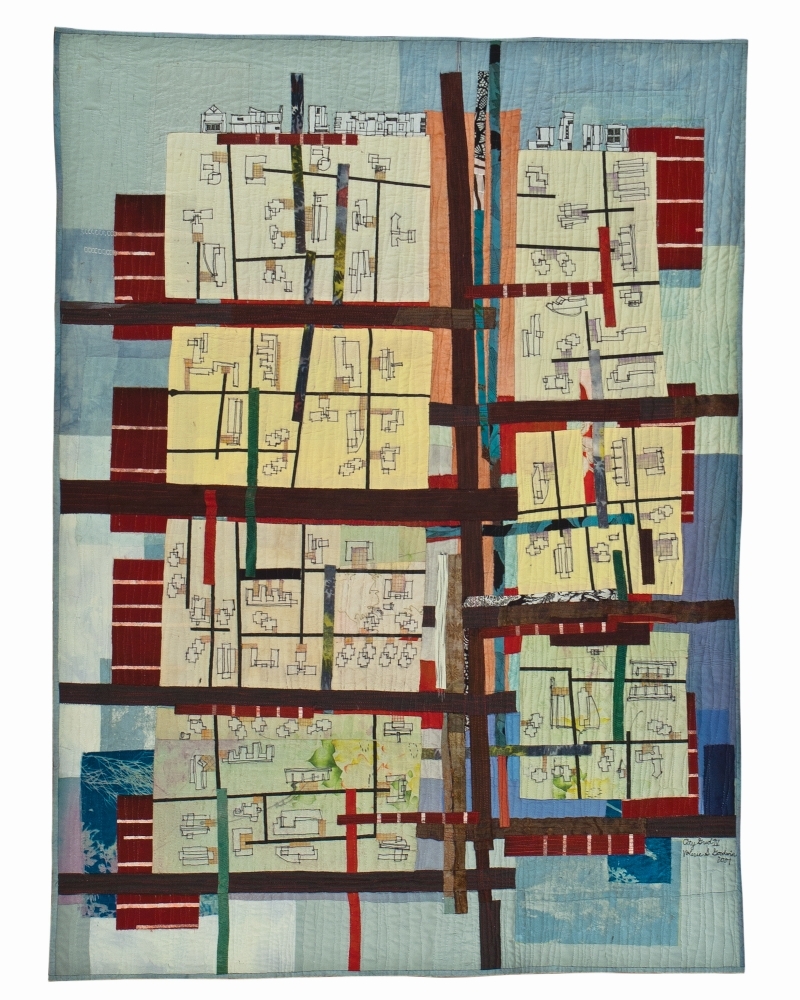
As an architect and artist, Valerie Goodwin creates quilts inspired by building and urban design, and maps of real and imaginary places. She has used maps since her youth, and remembers that as a child she was fond of them and their visual representations. Goodwin uses color dramatically in her work, and emphasizes line and density by layering fabric. City Grid IV is an art quilt that focuses on the organization of an imaginary place. Goodwin experiments with two points of view in this quilt – one from above, and another from the side.
Linda Loubert, PhD; Morgan State University, Making History – GIS and Women (2014)
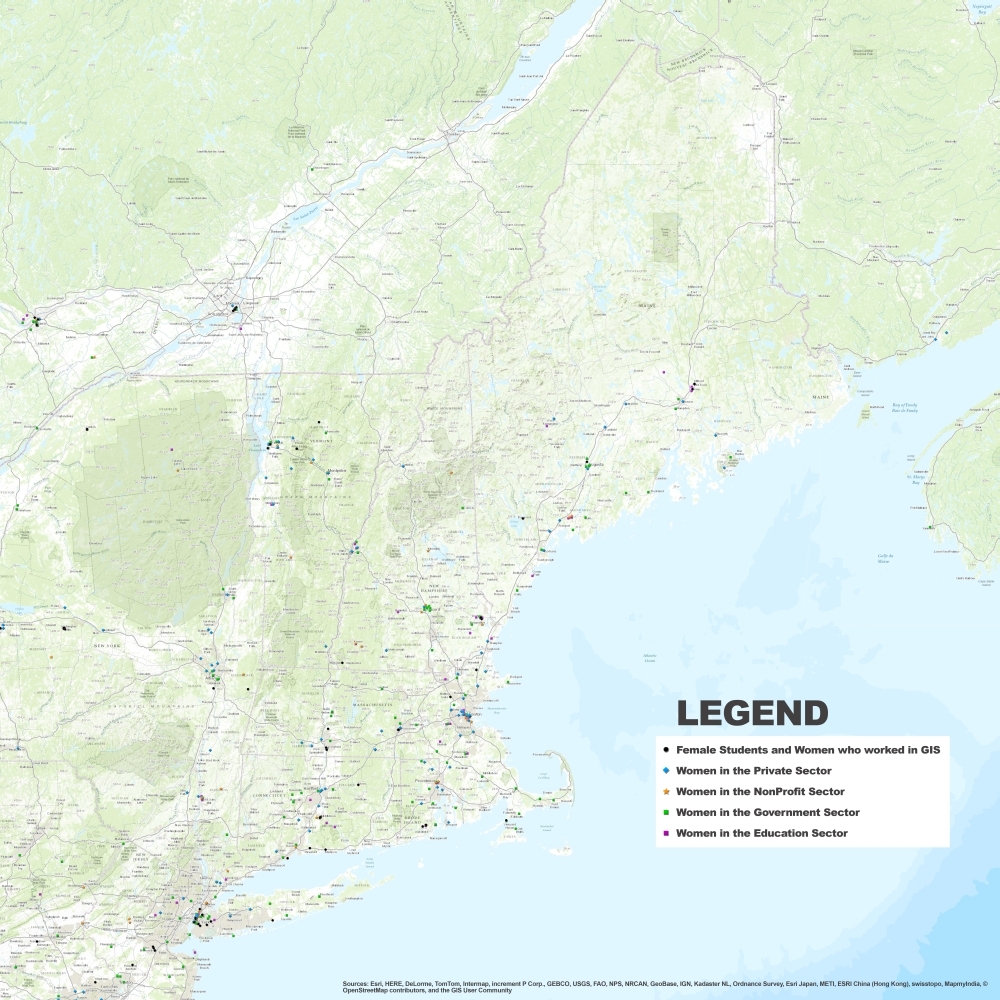
In her work as professor of economics at Morgan State University, Linda Loubert teaches GIS to her students, using the technology in her classroom and in most of her research projects. In 2014 Dr. Loubert built a crowdsourced web map to “recognize women for the role they play in GIS.” This digital project asked women to contribute their professional affiliation and location to the web map, in an effort to visually document 10,000 women currently working in the GIS field around the globe. Female GIS professionals can still contribute to the online map.
Our articles are always free
You’ll never hit a paywall or be asked to subscribe to read our free articles. No matter who you are, our articles are free to read—in class, at home, on the train, or wherever you like. In fact, you can even reuse them under a Creative Commons CC BY-ND 2.0 license.