On May 26, we hosted From The Vault: Mechanical Maps! From The Vault is a biweekly event series showing collections objects selected by Leventhal Center staff. For this edition the series, we looked at objects from our collections that move!
James T.B. Ives, Historical Map, Showing the Successive Acquisitions of Territory by the United States of America (1897)
The boundaries of the United States transformed during the 19th century. Mapmaker James Ives created this mechanical map to help people, especially students, visualize these changes. The base map labels the tribes that occupied different regions, while the upper layers represent the territorial growth of the United States. The mechanized pieces of this cartographic puzzle include the colonies in 1776, the Louisiana Purchase in 1803, and the Gadsden Purchase in 1853. The map told a story of the seemingly inevitable process of expansion and emphasized nation-building by treaties rather than the violence of war. The map consists of several layers attached to cut-tin pulleys activated by levers, which then creates movement.
Jeu magnétique geographique (1880)
Anyone up for a round of jeu magnétique geographique? This French board game could be thought of as a 19th-century Quizlet. Prompting 60 geography questions and answers, La Géographie would have been a useful study tool for students or the perfect pastime for fellow geography nerds like us. So, how does it work? The outer rings feature color-coded geography facts. Each fact matches up to a questions from a spinner of the same color. All the spinners contain special magnets, and the figure in the center of the board is magnetized, so when you line up a question on the spinner, the figure moves to the correct answer!
United States East of the Mississippi River (1960)
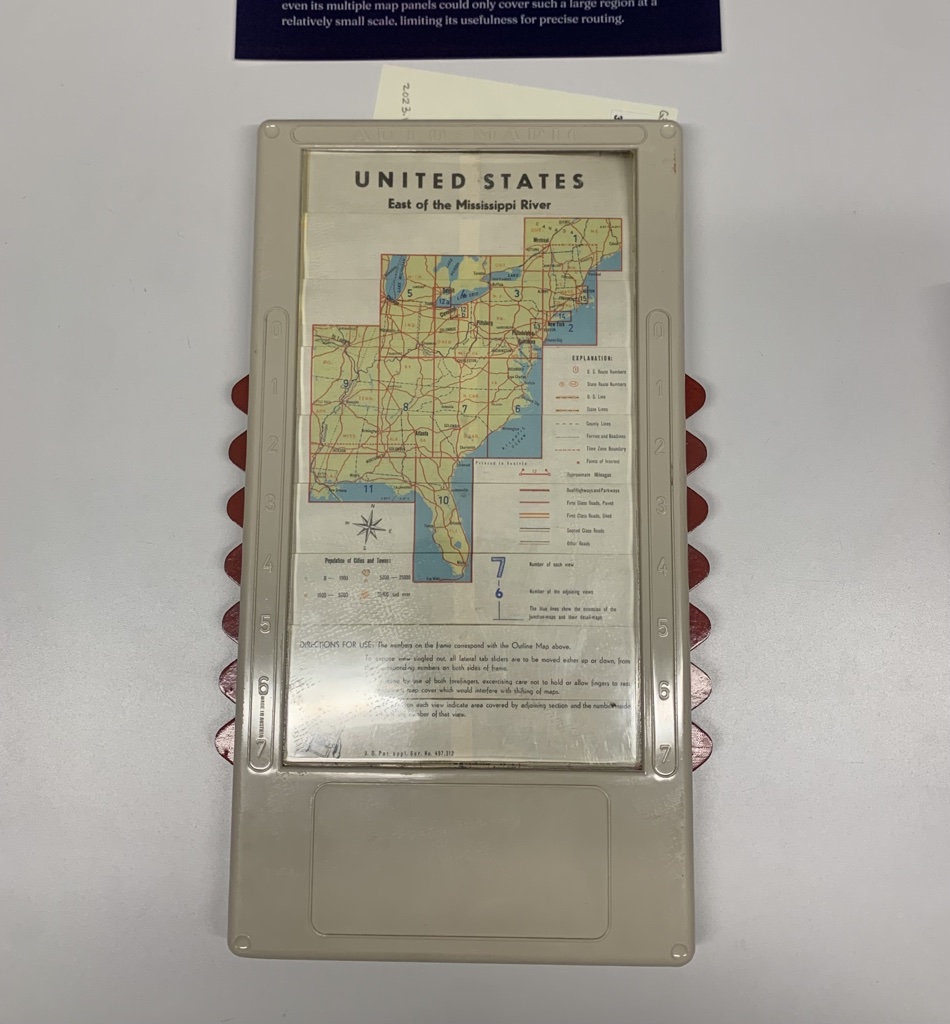
Sliding the tabs on both sides reveals more than a dozen sectional maps of the eastern United States.
This little plastic box with a series of sliding map panels inside was invented in an era before GPS displays on car dashboards, and it was trumpeted as “a permanent solution to the road map problem.” The Auto-Mapic was designed so that a motorist could use it while sitting in a driver’s seat, theoretically eliminating the need for oversized fold-out maps or bound atlases. By sliding the tabs on both sides, the user could reveal more than a dozen sectional maps of the eastern U.S. (Auto-Mapics were also made for many other locations, including Europe). Despite what must have seemed like a futuristic Jet Age device in the 1960s, the Auto-Mapic never caught on, perhaps due to the fact that even its multiple map panels could only cover such a large region at a relatively small scale, limiting its usefulness for precise routing.
Hearne Brothers, Hearne Brothers Official Polyconic Projection Map of Greater Boston and Vicinity, Massachusetts (1986)
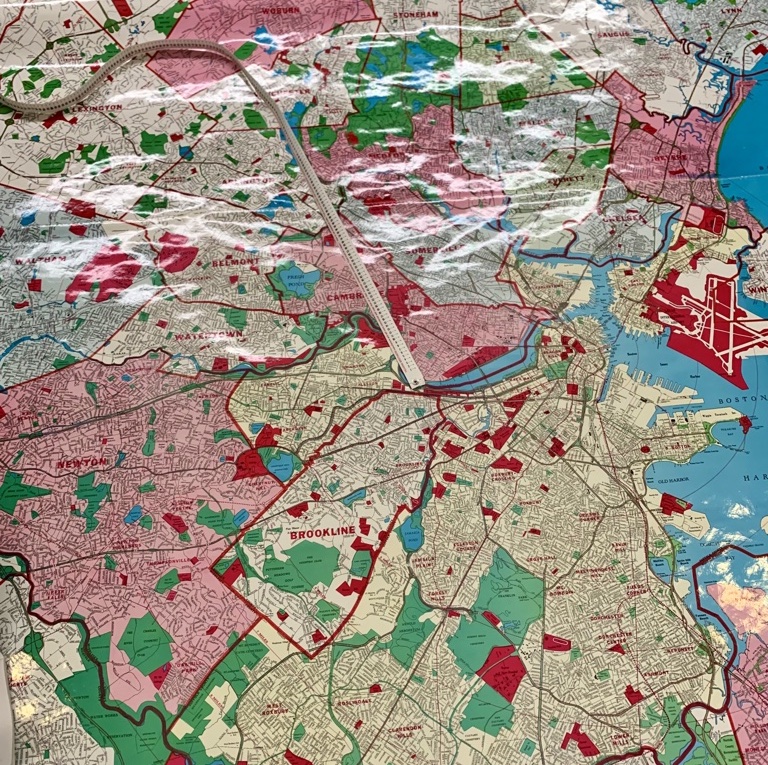
Have you ever used a tape locator index system?
This giant roll-down wall map offers an intriguing mechanical method for looking up geographical features at a moment just before computer databases and interactive maps began to take over that function. The accompanying pamphlet includes an index of street names and features of interest (they’re organized by county, so make sure to start by flipping through to Essex, Middlesex, Suffolk, or Norfolk sections). Each entry is marked in the index by two numbers. The first shows where to pull the central “clock hand” indicator on the numbered margin surrounding the map. Once you’ve pulled the indicator to the right margin mark, use the second number to measure along the indicator’s ruler. The arrow should point right at the feature in question!
Makelangelo and AxiDraw plotting robots
At the core of modern computer mapping systems—including the maps on your phone—are thousands of shapes that are encoded in coordinate systems. When your phone “renders” a map, it takes coordinates which represent roads, neighborhoods, locations, and more, and draws them on your screen in a few milliseconds. These two drawing robots do the same thing, but they do it much slower and mechanically, which offers an interesting visual demonstration of how computer data is used to create visually rendered maps. The plotting robots’ motors are programmed to take x and y coordinates, which control a pen that inks these shapes onto a piece of paper. Before the advent of inkjet and laser printers, “pen plotters” were a common piece of equipment in computer mapping systems.
Our articles are always free
You’ll never hit a paywall or be asked to subscribe to read our free articles. No matter who you are, our articles are free to read—in class, at home, on the train, or wherever you like. In fact, you can even reuse them under a Creative Commons CC BY-ND 2.0 license.