Every month when I look at our collections to decide what to share on social media, I do a search of the titles of our maps for the name of the month. This always gives me a really interesting look at the variety inherent in our collections! Here’s a roundup of some April-related maps from the 19th century.
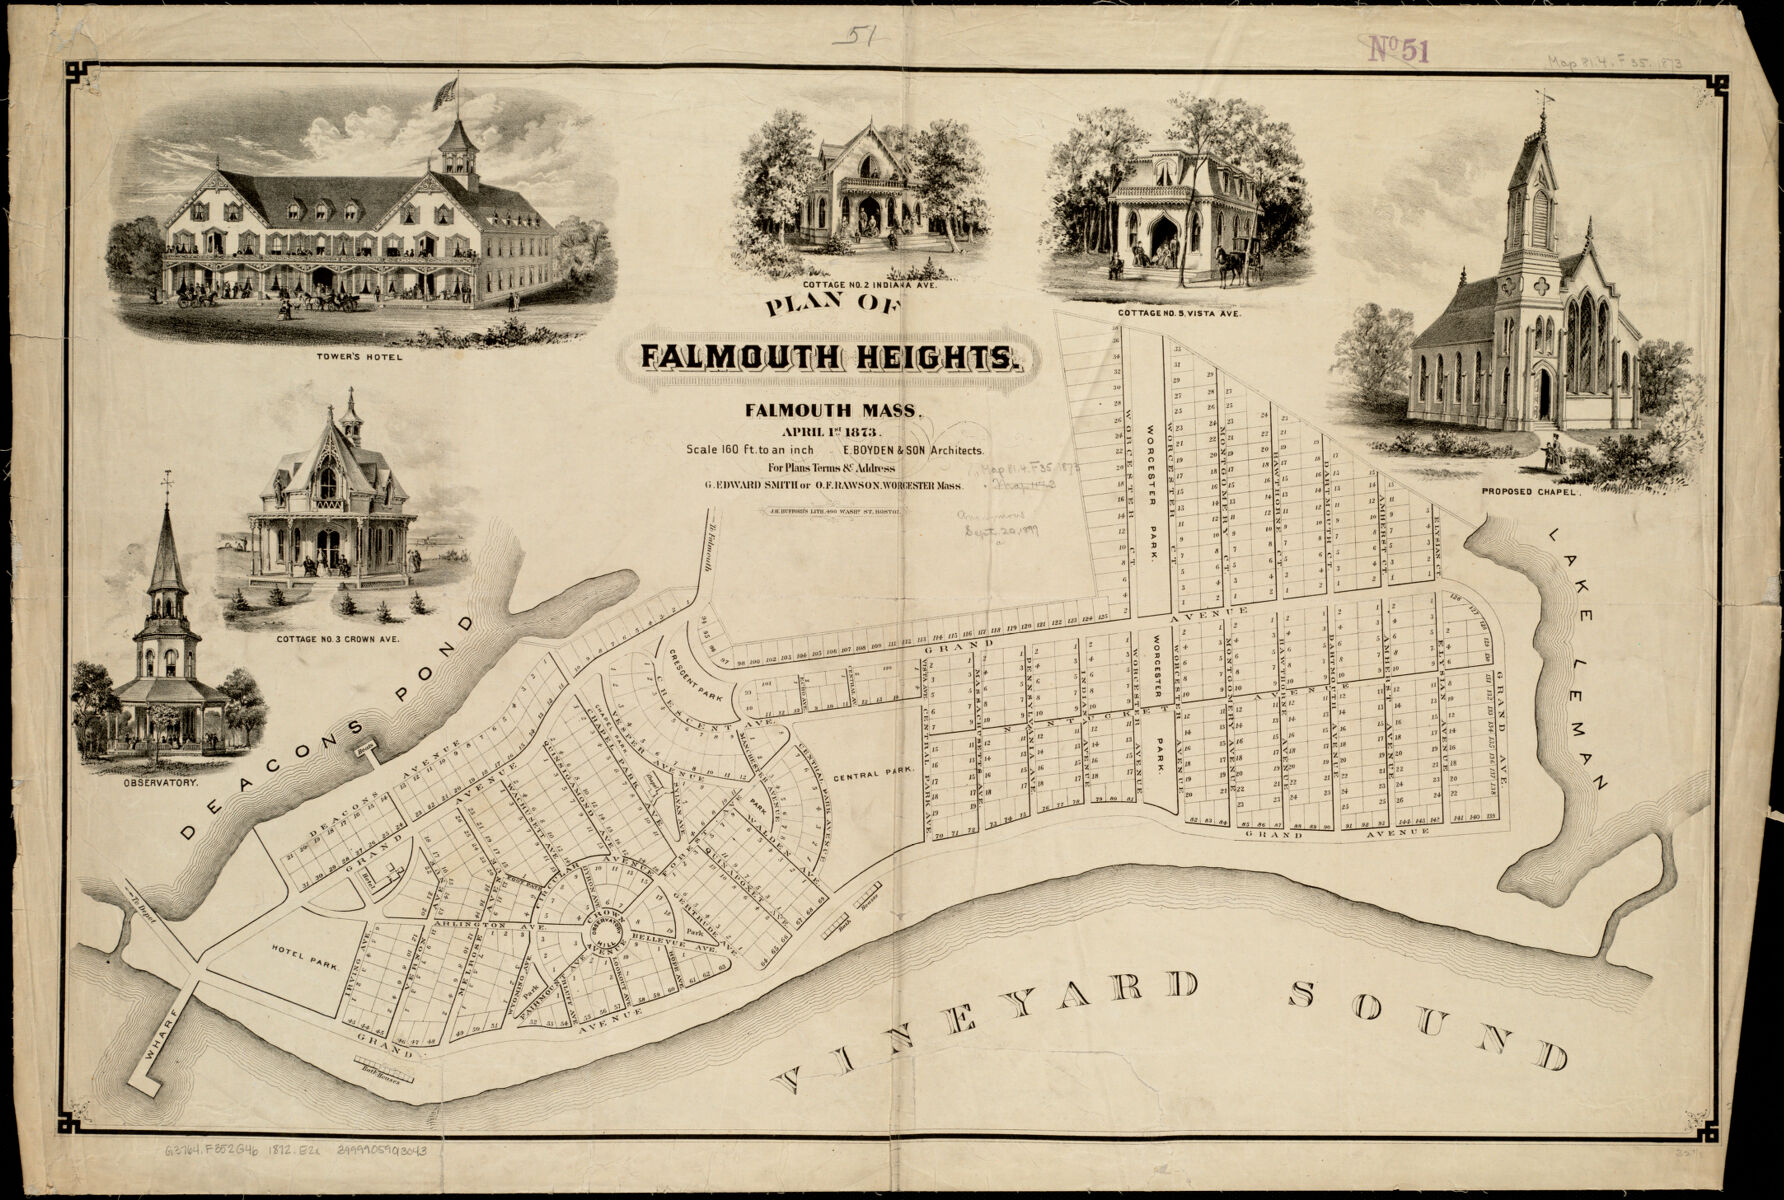
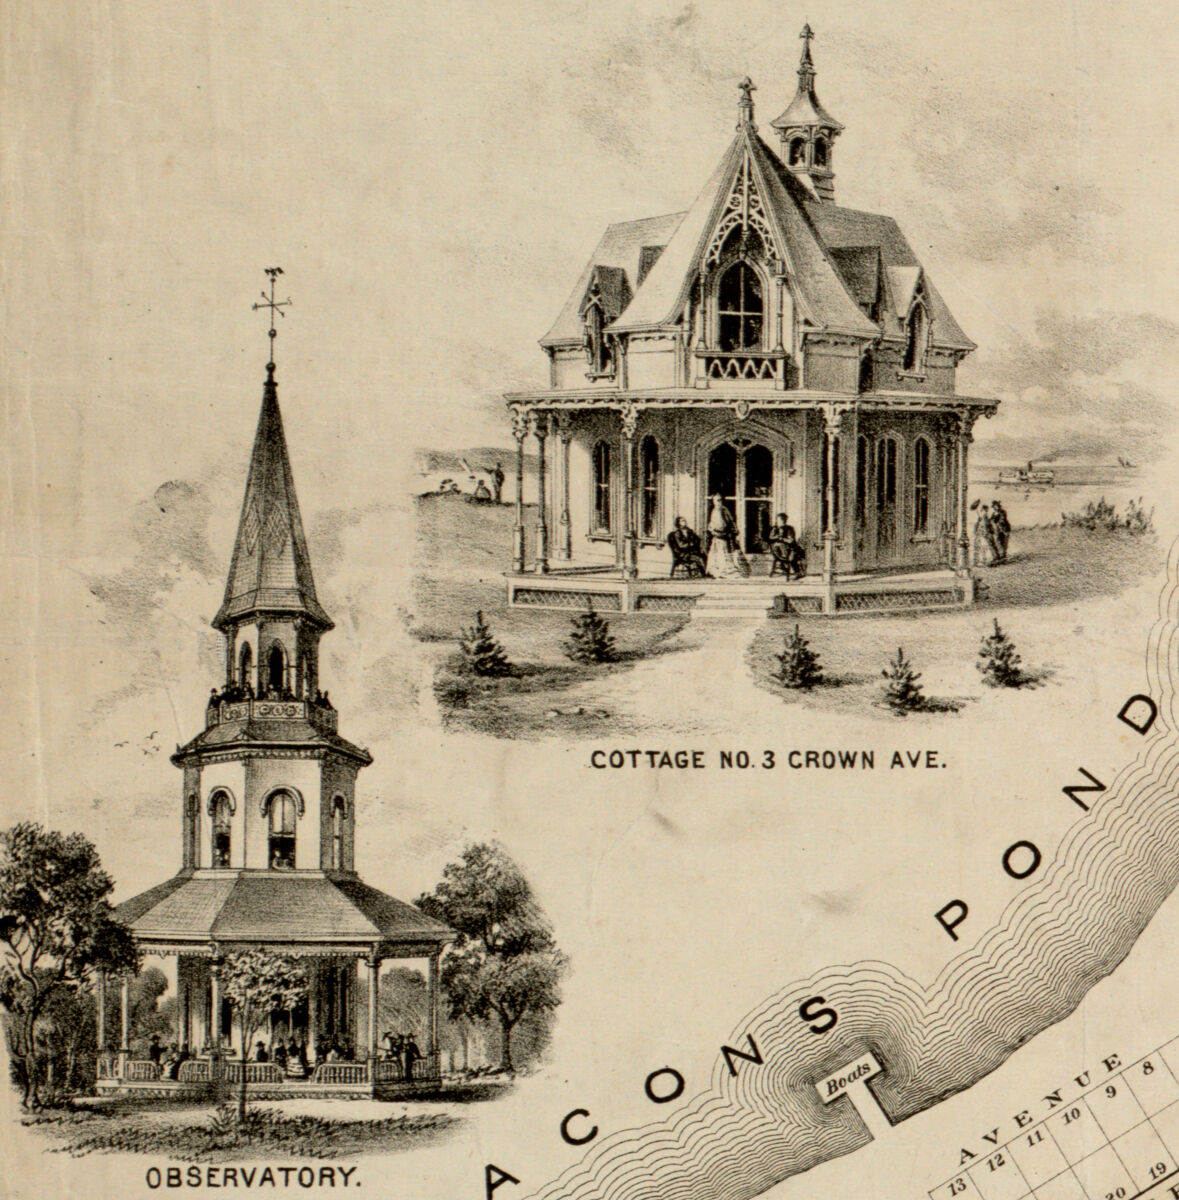
This April 1, 1873 plan of Falmouth Heights is a classic example of a 19th century map from our collections. It’s got a street map in the center and the little vignettes of buildings from the town around the edges, typical of this kind of map at the time! We have plenty of maps in our collection with these detailed little drawings of important landmarks in a city. Check out this cute observatory and cottage! This is often a feature of bird’s eye view maps, which were popular in the late 19th century.

Many of the maps in our collection are maps of wars and battles. Here’s a map illustrating the April 1847 Battle of Cerro Gordo, or Sierra Gordo, from the Mexican-American War. During this engagement, roads were built to allow armies to traverse the topography of the area. Troop movements are often mapped contemporaneously to communicate what’s happening in a war to the public. So this map was likely made the around when the battle happened, and was created by George Brinton McClellan, in the engineering corps, who became Governor of New Jersey later in his life.

In the same vein, we have many maps that are plans of forts.
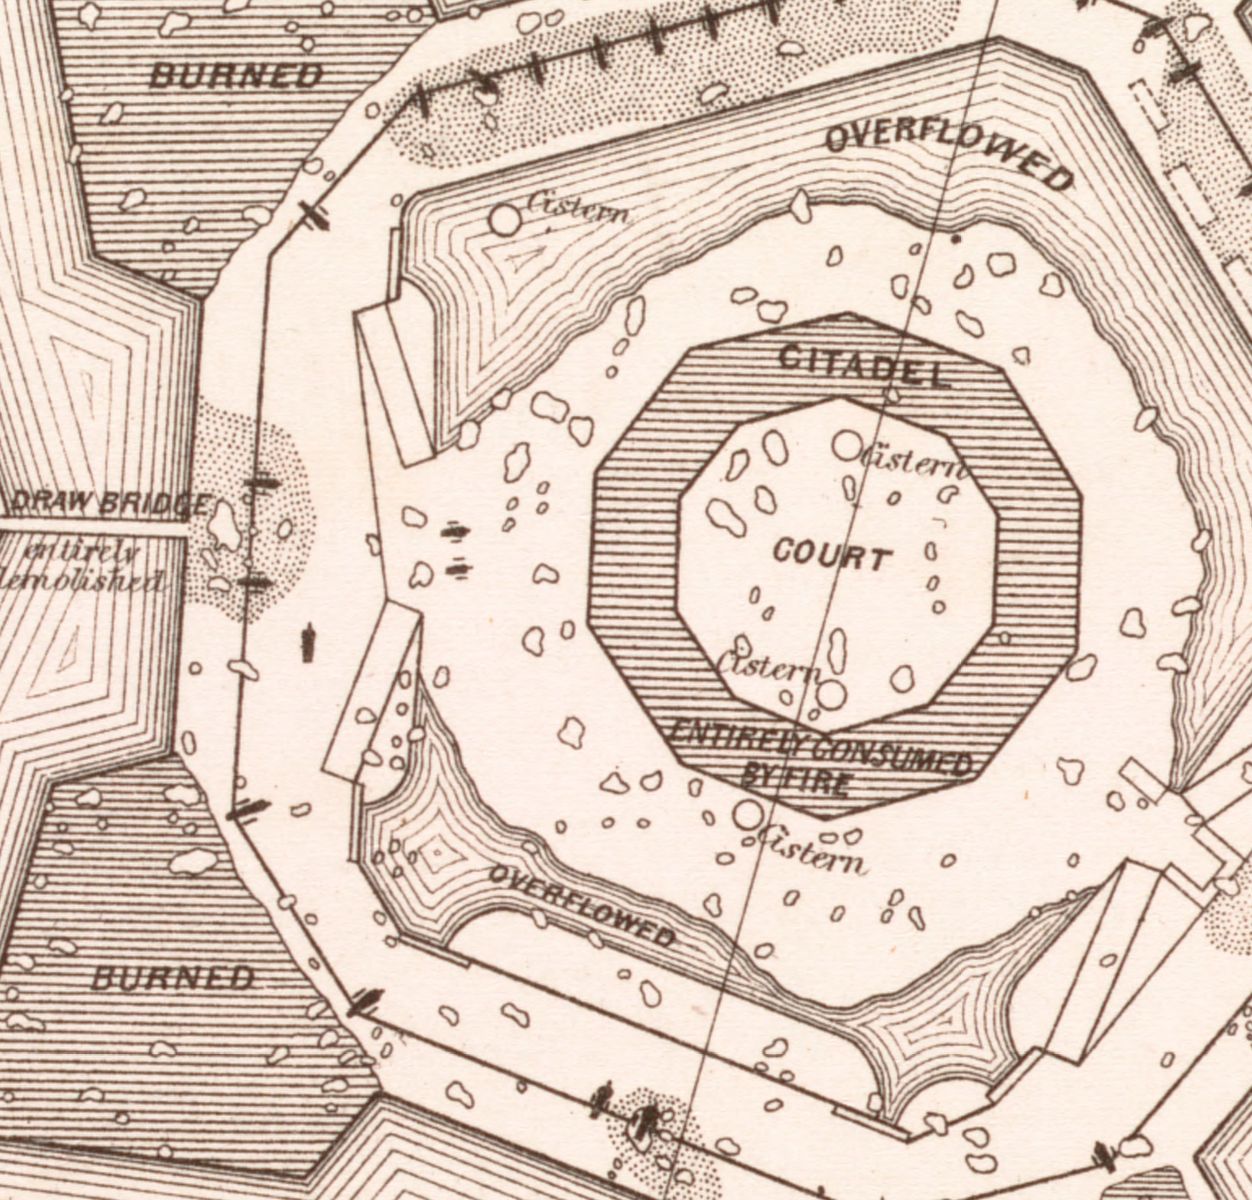
Here’s one that jumps ahead a few years to 1862, showing this very aesthetically pleasing star-shaped fort. This plan in particular maps the damage to Fort Jackson in April of that year during the Civil War Battle of Forts Jackson and St. Philip. This description on the left details the “effect of the Bombardment by the U.S. Mortar Flotilla and Gunboats April 18th to 24th 1862.” In this crop, you can see the parts that were burned, the drawbridge that was entirely demolished, the overflowed areas, and the center of the fort entirely consumed by fire.
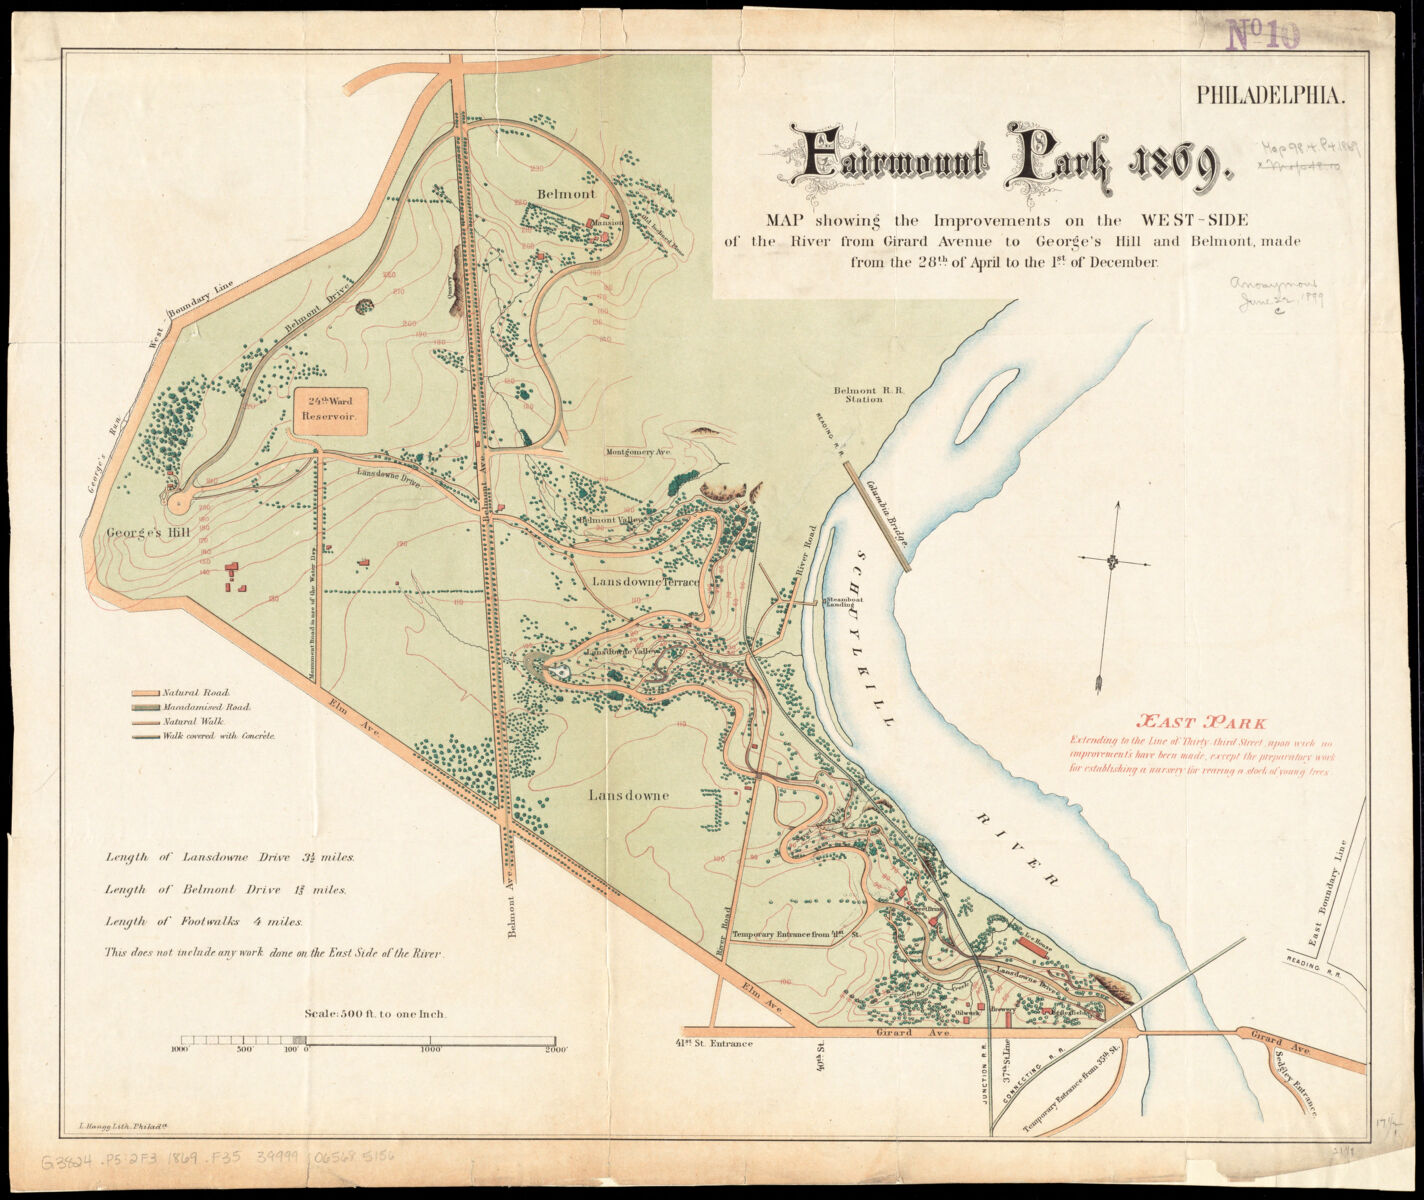
Maps of “improvements” are a large area of cartographic interest, as are maps of public space and green areas. In fact, we did a whole exhibit on green space in Boston a couple of years ago! This map of improvements made to Fairmount Park starting April of 1869 is colorful and beautifully lettered, showing the tree-lined avenues that go through the park as well as contour lines for the topography of the hills.

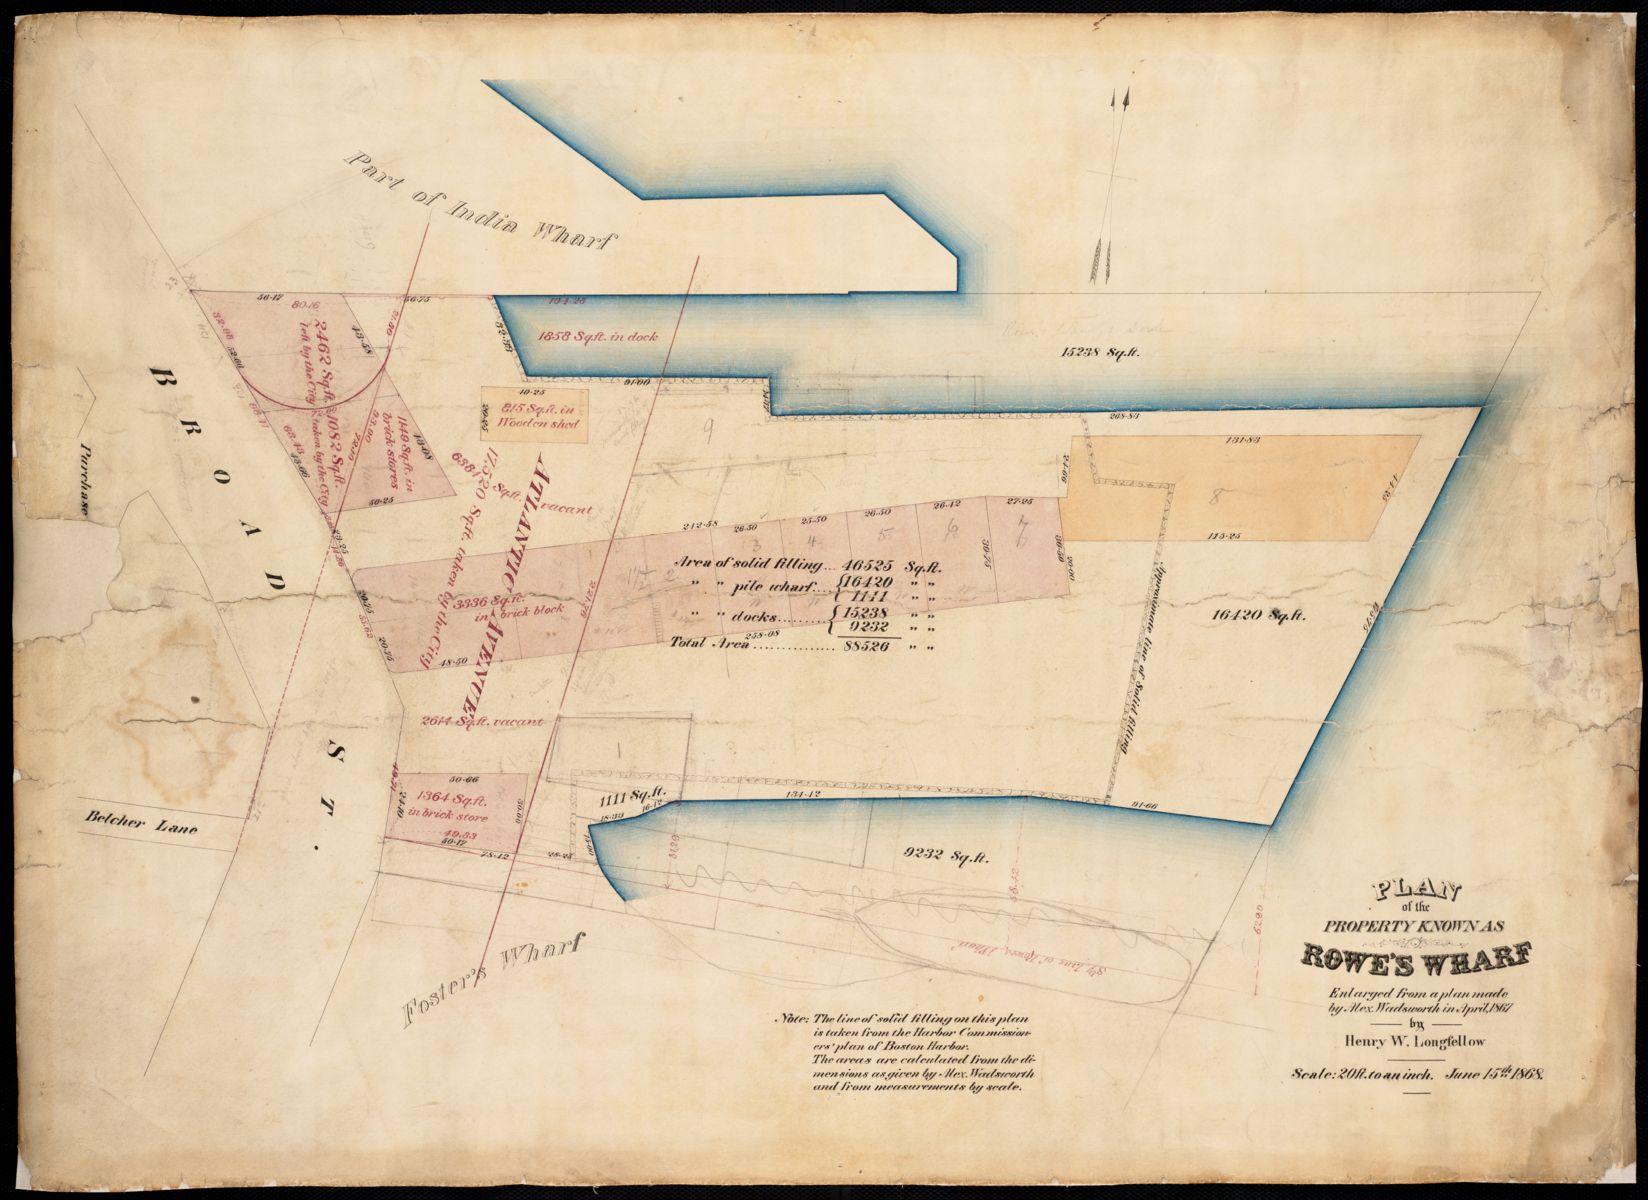
Another major 19th century collection of ours is the urban atlases that make up Atlascope, a bunch of fire insurance and real estate atlases from the late 19th and early 20th centuries. The plan of Rowes Wharf here and the proposed changes to it is stylistically very similar to those atlases, with pink brick buildings and yellow wood ones, as well as the way the typography looks! I really recommend opening this one up and looking at it more closely: the square footage of everything on the map is labeled, including the docks (which are the watery parts, not the piers) and all the buildings, as well as how much of the wharf is on solid fill vs. pilings. The proposed Atlantic Avenue is square footage being taken by the city.
Our articles are always free
You’ll never hit a paywall or be asked to subscribe to read our free articles. No matter who you are, our articles are free to read—in class, at home, on the train, or wherever you like. In fact, you can even reuse them under a Creative Commons CC BY-ND 2.0 license.