A Tale of Two Boston Bays: Back Bay vs. South Bay
Time:
90 minute block class or two class periods of 45 minutes
In this lesson, students explore maps of Boston’s Back Bay and South Bay neighborhoods to look at how two similar watery bays developed very differently to one another.
Our Question:
How can maps help us see how different communities live with different environmental harms?
Purpose:
- Learn how Boston’s geography developed by looking closely at Boston’s Back Bay and South Bay neighborhoods.
- Explore maps of Boston’s Back Bay and South Bay to look at differences in ways the land has been used by businesses and residents.
- Explore the concept of sacrifice zones as they relate to environmental justice.
Background:
This lesson connects with the Managing Nature and Managing People section of the More or Less in Common exhibition:
“Reconfiguring the natural environment was not just about managing issues like noxious odors. It was also about creating spaces that fit the needs of a particular social order. These maps show how the process of filling in tidal estuaries could serve very different purposes. In the Back Bay neighborhood, landfill was used to create an elite residential district, well equipped with both cultural facilities, like the Central Library, and attractive landscapes, like the Commonwealth Avenue boulevard and the Back Bay Fens. On the other side of Boston’s original peninsula, the South Bay was put to very different purposes as it was slowly filled in. Over the years, South Bay would serve as home to industrial docks, rail yards and highway interchanges, and an infamously polluting trash incinerator. Today, the large parking lot in the center of the South Bay shopping mall is a major urban heat island in the summer. The different landscapes of these two filled bays in the 2020s reflects the accumulated history of choices that were made more than a century ago.”
Materials needed:
- Laptops to view maps online and printouts of worksheet or create a copy and share worksheet with students.
- You may also print the maps out from the links provided. If you would like a larger set of printed maps for your classroom, please reach out to education@leventhalmap.org.
Steps:
1. Introduction
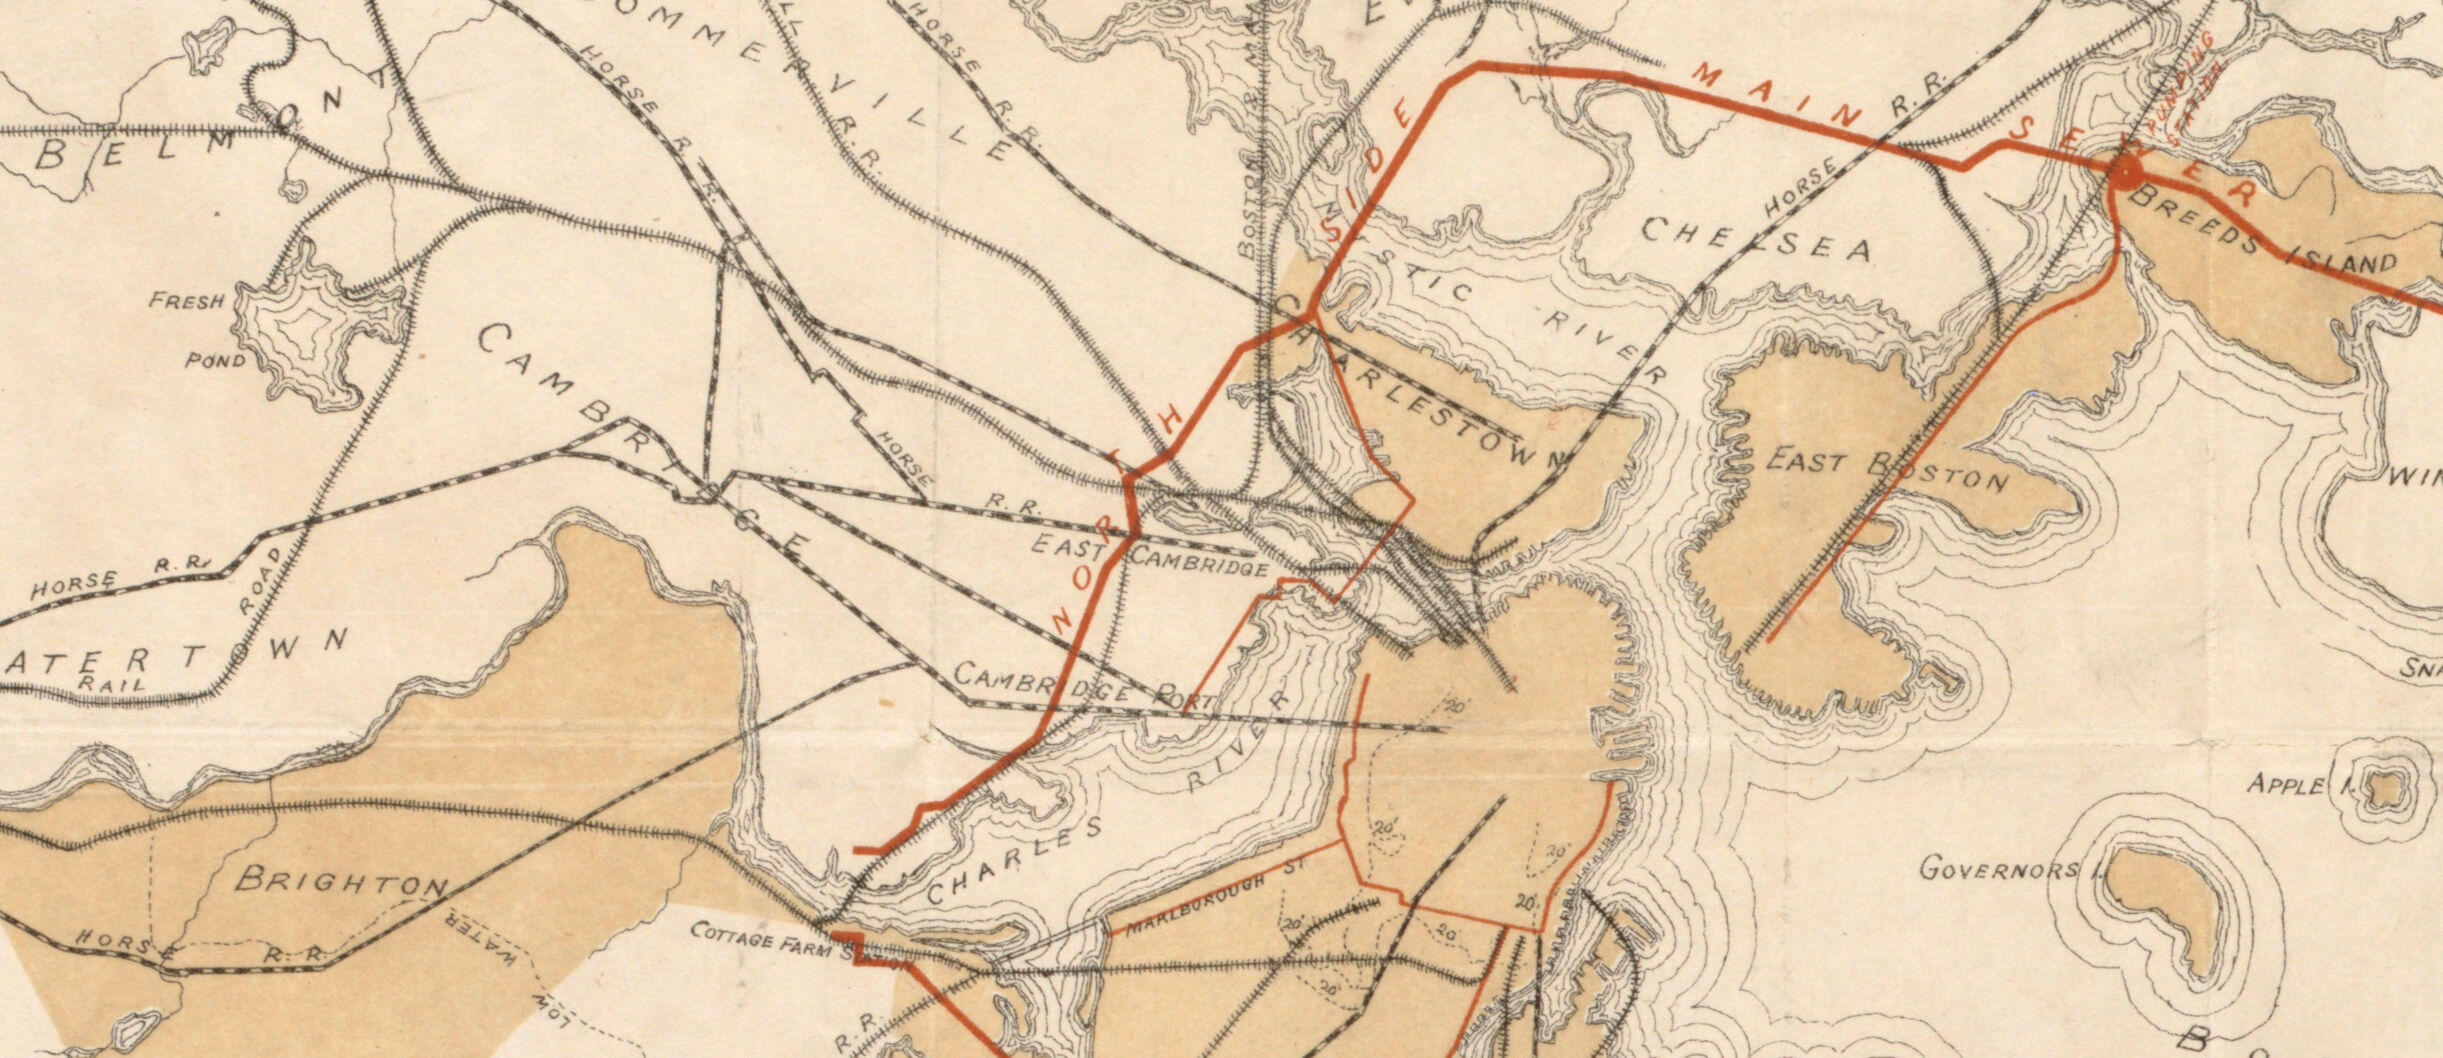
Project or hand out copies of this map showing odors and smelly industries in Boston in 1878 and the one showing undrained and filled land in 1870.
Map showing the sources of some of the offensive odors perceived in Boston, 1878
Map Showing the Sources of Some of the Offensive Odors Perceived in Boston, 1878
Boston Board of Health
1878
Leventhal Map & Education Center
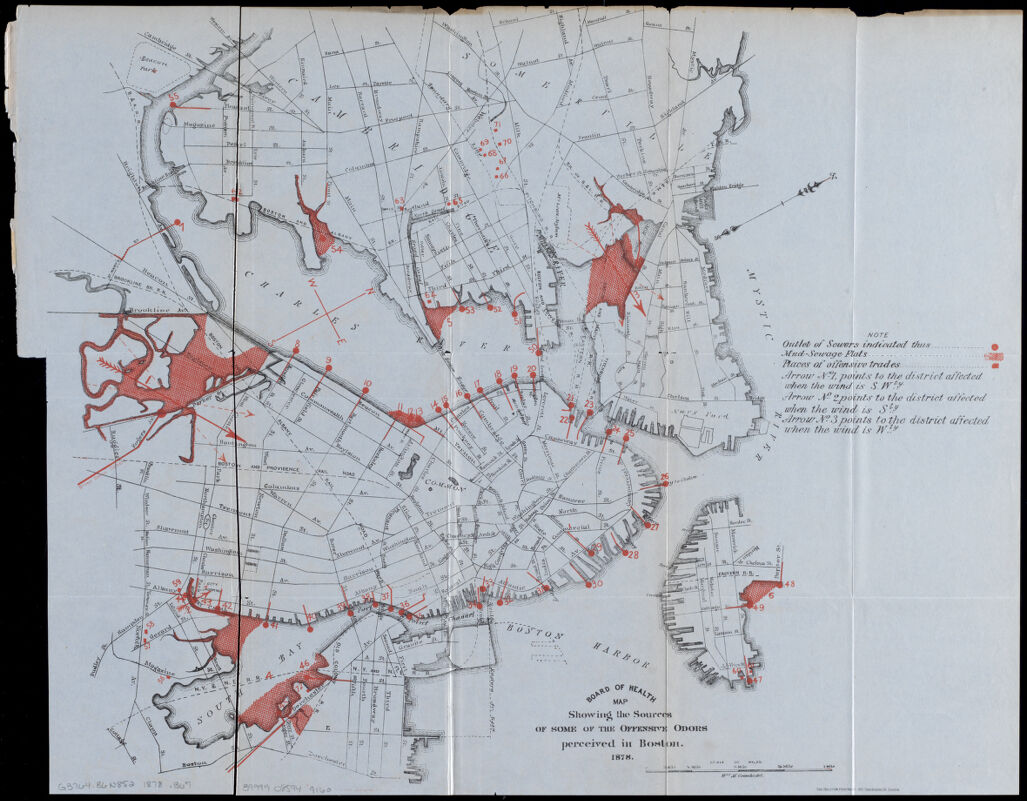
What is this map about? Where do you notice the map says the worst smells and industries are located?
Along waterways and shorelines.
Why do you think this is?
Most industries still rely on water transportation, access to water and the ability to dispose of waste. Also, Boston’s growing population is overwhelming an antiquated sewer system.
Be sure to point out the locations of the Back Bay and South Bay on the map showing filled land and pay attention to the legend which shows the extent to which Boston is built on made land.
Map of Boston : showing health districts and undrained and filled land, 1870
Map of Boston : showing health districts and undrained and filled land
Heliotype Printing Co.
1870-1879
Leventhal Map & Education Center
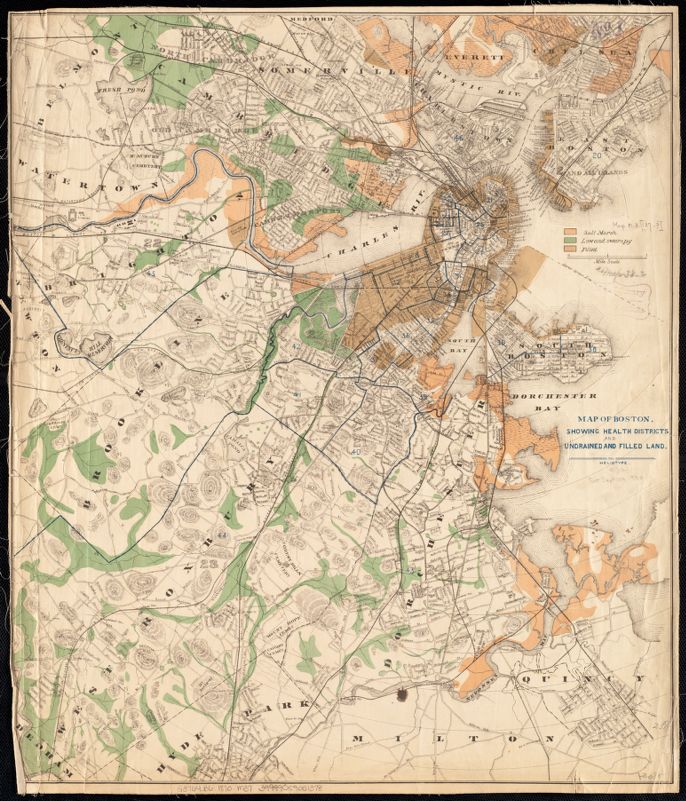
Today we’re going to look at how two of Boston’s formerly watery neighborhoods (Back Bay and South Bay) developed over time and what those places look like today. We’re going to think about them by looking both at what sorts of businesses, services and infrastructure were built in those locations but also who has benefited or been harmed by what is there today.
Be sure to point out the locations of the Back Bay and South Bay on the map and pay attention to the legend which shows the extent to which Boston is built on made land.
2. First, let’s define a couple of concepts:
- Environmental Justice: There is not one single definition of environmental justice. The Environmental Protection Agency (EPA) defines it as the “fair treatment and meaningful involvement” of all people regardless of race, class, income, etc. when making, implementing and enforcing environmental laws.
For our lesson today, we are going to explore more broadly the idea that people and the environment are deeply connected and those who hold the least power often are living with more degraded environments created by those with the most power.
- Sacrifice Zones: In More or Less in Common, sacrifice zones are explained this way:
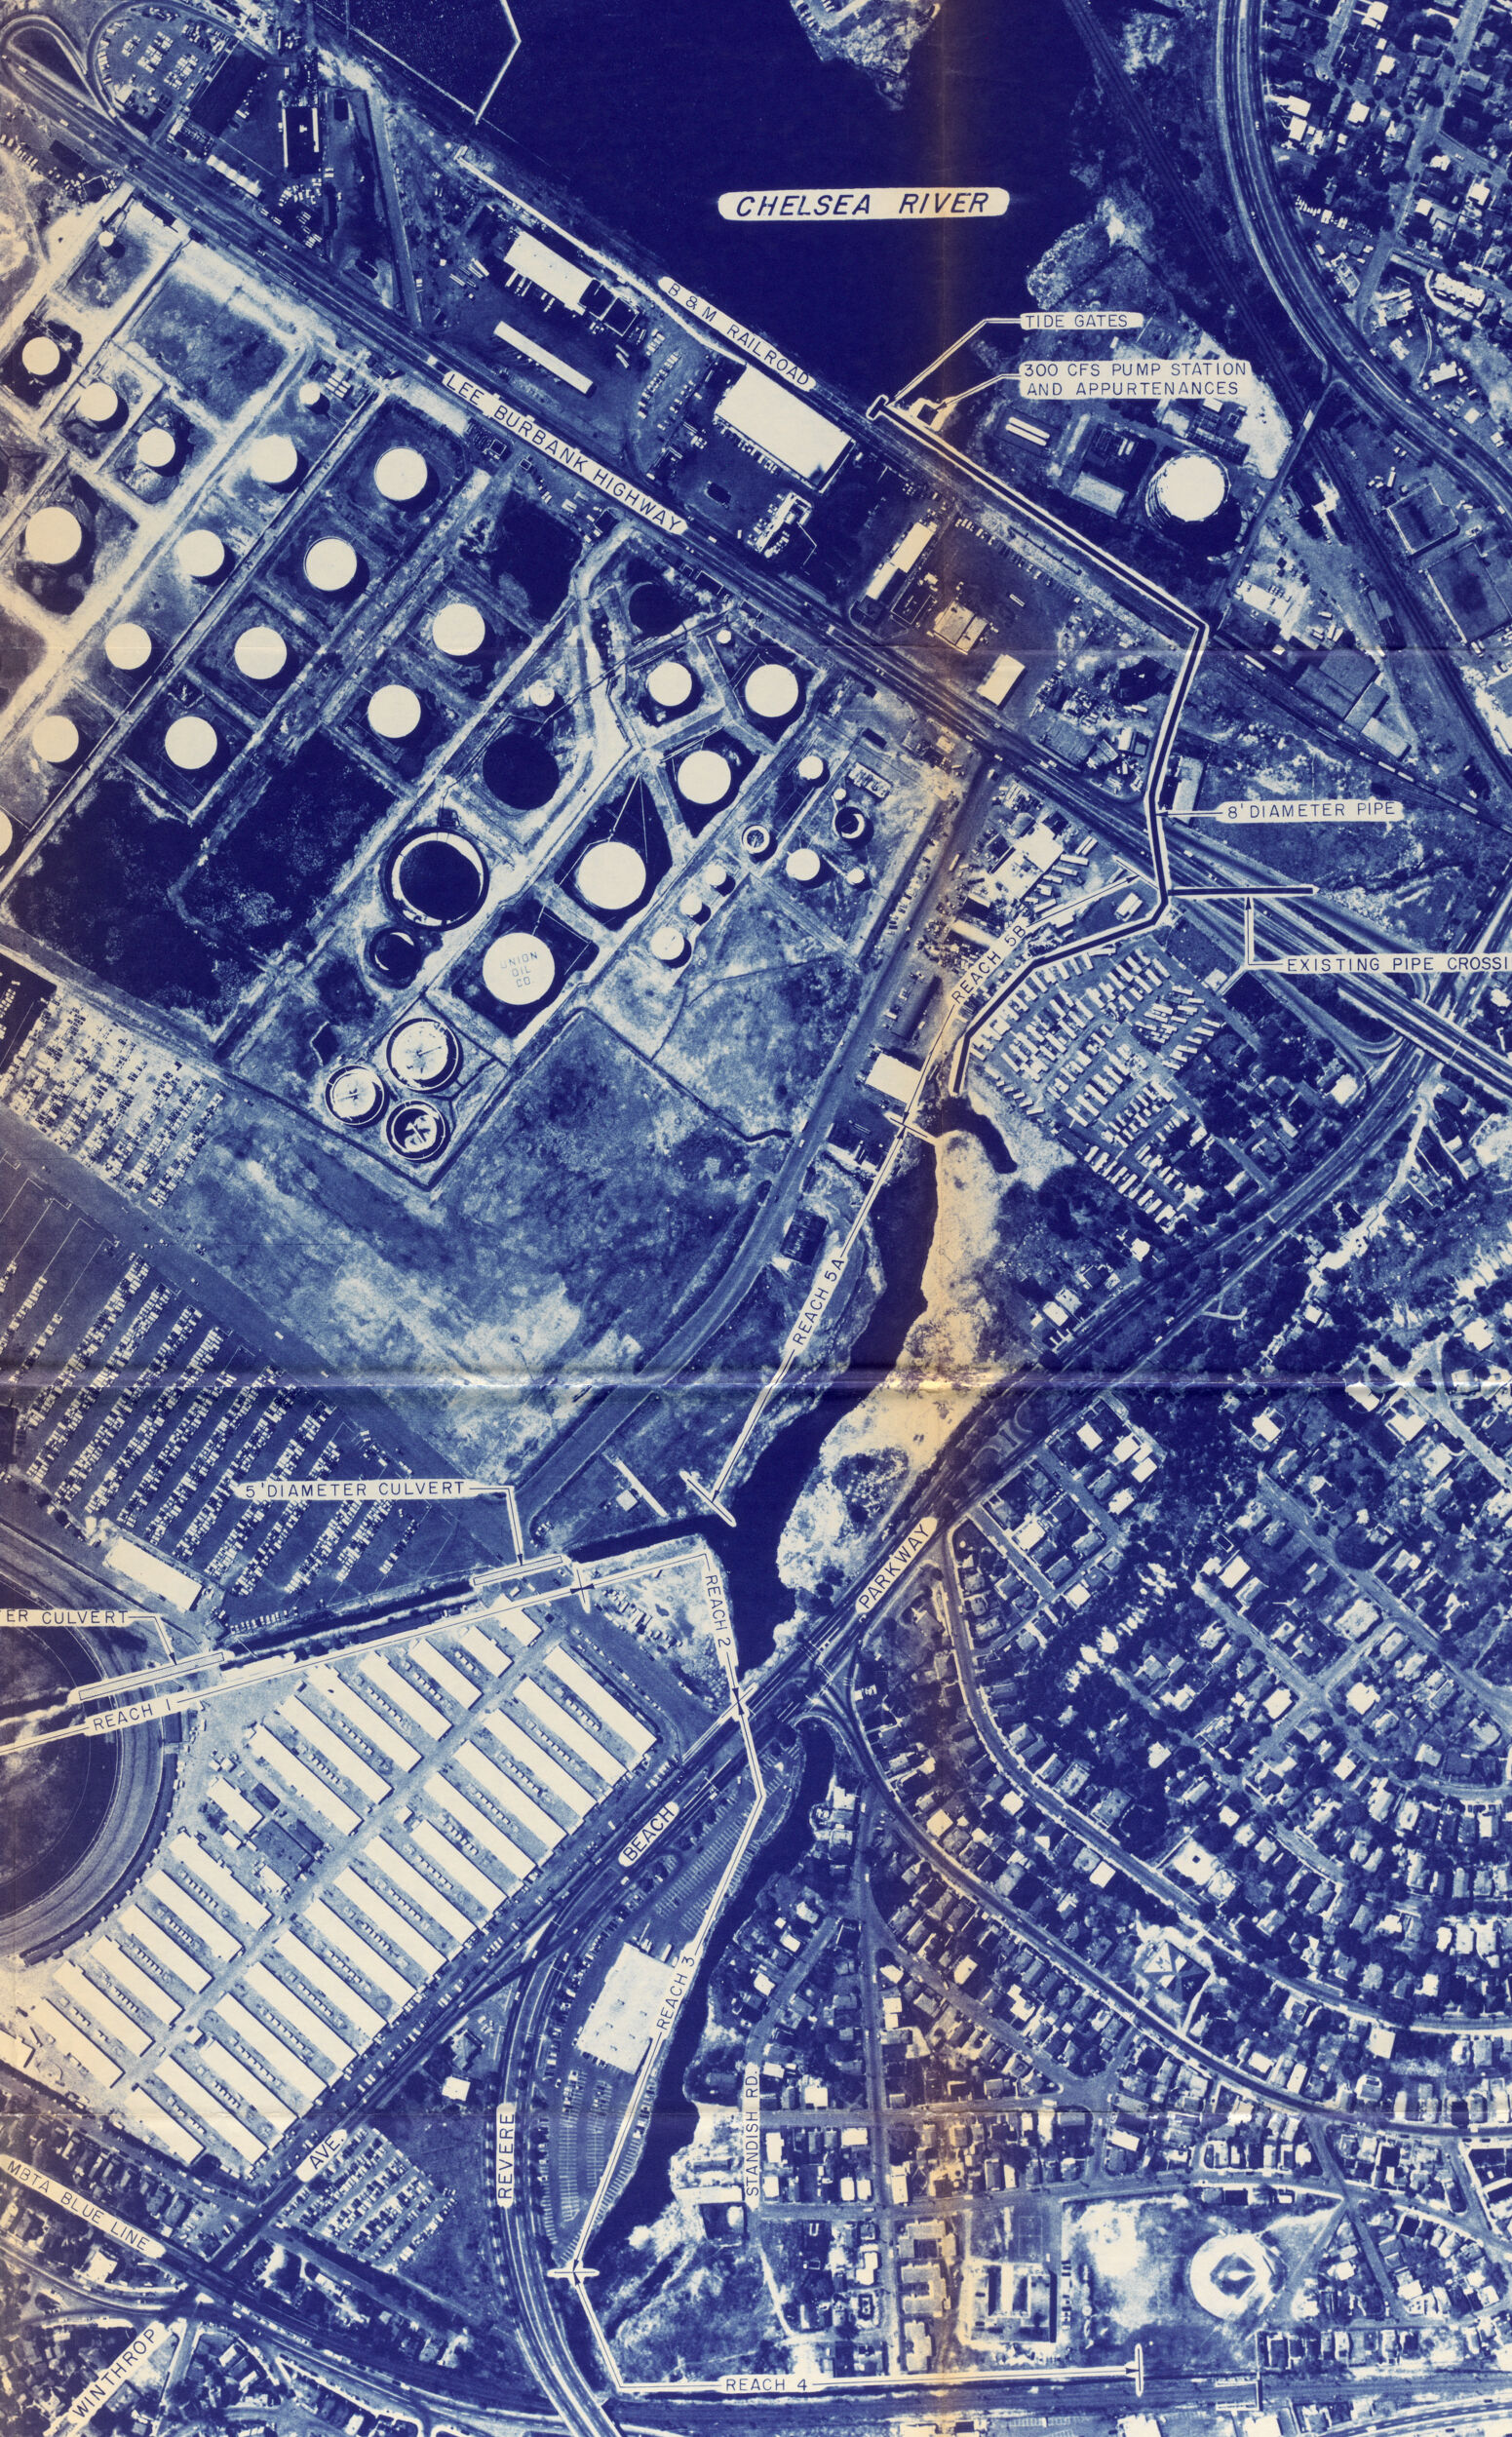
Modern life is full of consumption habits that have environmental consequences. But oftentimes one group of people’s desires and demands leads to a degraded environment for an entirely different group of people. This geographic mismatch between one group of people’s needs and another group’s exposure is a key element of environmental injustice. For instance, hundreds of thousands of New Englanders from all walks of life heat their homes with fuel oil, and millions travel each year in and out of Boston through Logan Airport and its surrounding roads. The toxic landscapes required to store and distribute oil, or to service an international airport, however, are not borne equally on all these users. Geographers use the term “sacrifice zones” to describe places that have been severely impaired by these kinds of land uses.
3. Map Inquiry
Assign half the class to explore South Bay and the other Back Bay. Students can work in small groups together or on their own. Students can copy the worksheet and fill it in online.
Both groups start with Part A and explore their 1882 maps. Then, both groups select the modern aerial as their base map and complete Part B questions.
Make sure students know they can select different ways to compare the historical and present map views with different swipe options or changing the opacity. They can also use the street view basemap to do their comparison as it shows names of some select businesses and landmarks.
South Bay Group:
This group will use the Atlascope tool to focus on an 1882 map showing the South Bay Area.
-
Click on “search places” and type in “8 Allstate Rd. Dorchester, MA”. This is the current location of the South Bay shopping center.
-
Select “1882 Hopkins” as your overlap map
-
Zoom out a bit to see the entire South Bay (watery area) on the map. For your inquiry, focus mostly on what you see along the edges of the watery South Bay outlined on the map.
If printing the map, you’ll need to print both of these atlas plates:
- https://collections.leventhalmap.org/search/commonwealth:6h446v05s
- https://collections.leventhalmap.org/search/commonwealth:6h446v062
For modern comparison, use the satellite view in Google maps for a modern view.
Back Bay Group:
This group will use the Atlascope tool to focus on an 1882 map showing the Back Bay Area.
-
Click on “search places” and type in “700 Boylston St. Boston, MA”. This is the location of the Boston Public Library in Copley Square in the Back Bay.
-
Select “1882 Hopkins” as your overlap map
-
Zoom out a bit to see a bigger area. For your inquiry, pick an area surrounding this location in multiple directions to explore.
If printing the map, you’ll need the following atlas plate:
For modern comparison, use the satellite view in Google maps for a modern view.
4. Groups report to the whole class:
Some things students may notice to discuss:
South Bay Group:
- Many types of industry (tallow, iron works, coal/gas storage, lumber yard, etc.) city land (city hospital, sewer department), a smallpox hospital, railroad tracks and wharves all around.
- People: Point students to notice that there are not as many residences right around the water. The blocks of buildings that are apartments/row houses are a few blocks away but still mixed in with many industries. Churches and schools are present so we can assume people live close by.
Back Bay Group:
- Museums, churches, MIT, Public Garden nearby. Freight yard/railroad nearby (the current central Boston Public Library has not yet been built)
- People: Most blocks are composed of row houses (skinny rectangles) which are residences.
Discuss what students saw today in both areas with the satellite maps.
South Bay shopping center has taken over a sizable portion of the original watery area of South Bay with large asphalt parking areas. SE Expressway/93 and lots of automobile infrastructure is built into the landscape, railroad yards nearby. Back Bay shows access to lots of green space (Commonwealth Avenue mall, Charles River esplanade), no open parking lots, still many hotels and non-industrial businesses.
5. Discuss idea of sacrifice zone:
Here is our earlier description of sacrifice zones:
The toxic landscapes required to store and distribute oil, or to service an international airport, however, are not borne equally on all these users. Geographers use the term “sacrifice zones” to describe places that have been severely impaired by these kinds of land uses.
What connections can you make to how the South Bay has developed versus the Back Bay based on this idea of sacrifice zones? Who benefits from the way the environment has developed in the South Bay? Who benefits in the Back Bay?
If students need prompting, ask them to consider the shopping center where many people go from around the city, commuters who use the nearby highway, etc.
In the 1990s, residents and workers in the areas surrounding South Bay pushed back against the idea of the area as a sacrifice zone. The city of Boston’s planning and development agency approved the application for an asphalt factory to be built there. Many people worked to reverse this decision based on the idea that just because an area has historically been used for polluting industries it does not have to be in the present and future.
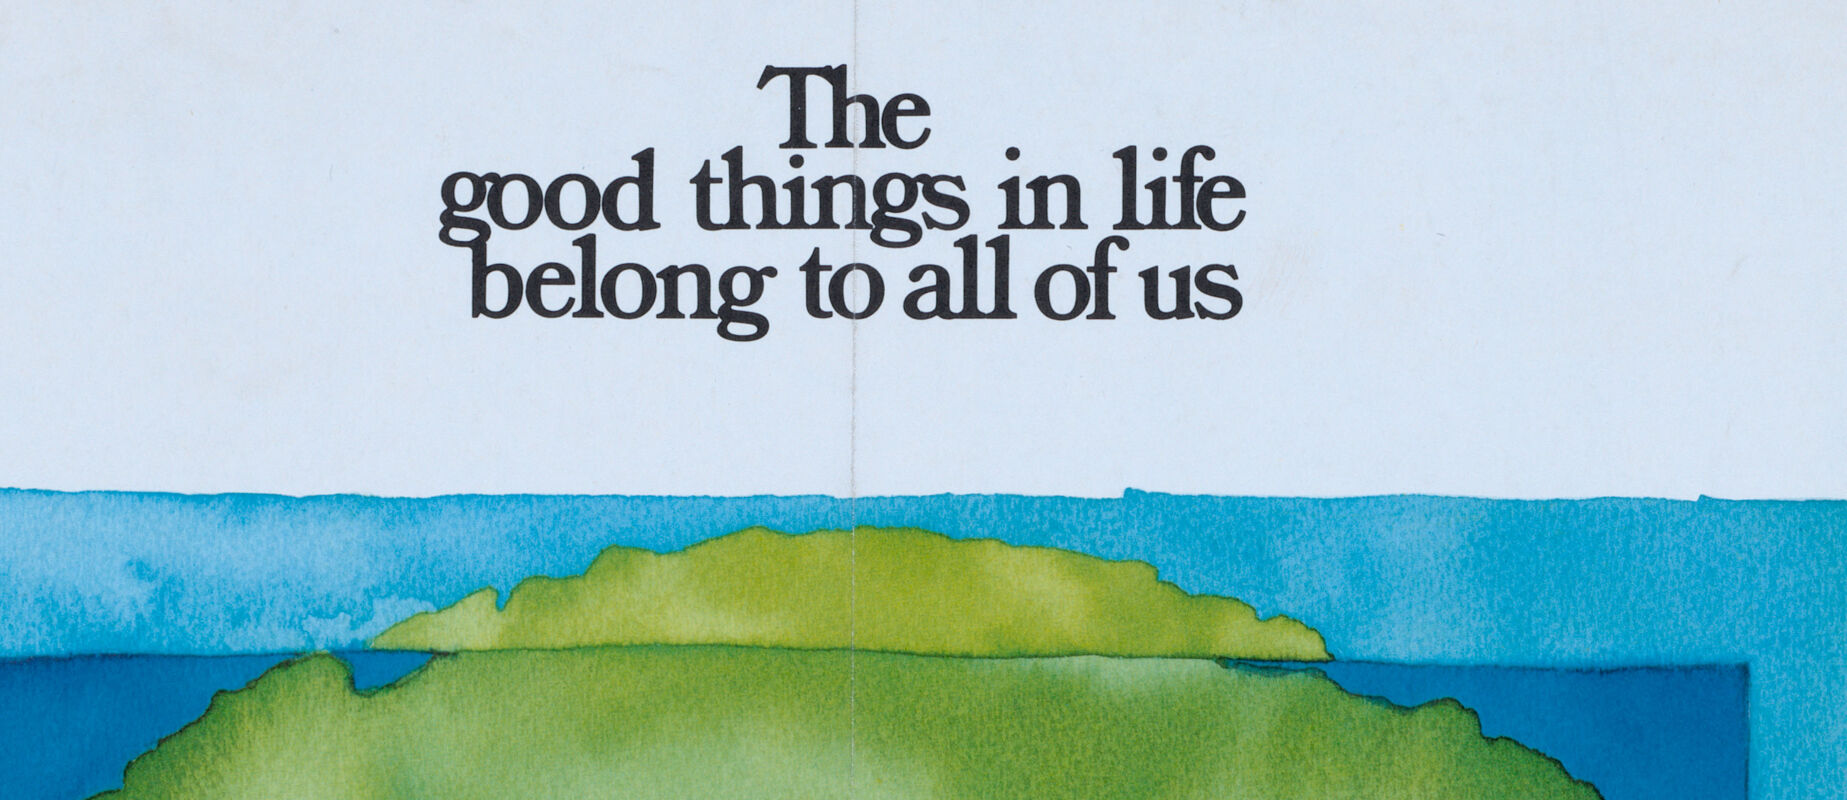
Explore this flyer and other documents to see how activists and organizations such as the American Lung Association defeated the construction based on ideas about who lives and works in South Bay.
Documents related to the Coalition Against the Asphalt Plant
Dudley Street Neighborhood Initiative
ca. 1993-1994
Northeastern University Library
6. Conclusion and Possible Solutions Discussion:
What new ideas connected to sacrifice zones and the environment in Boston are you thinking about after looking at the maps?
What ideas do you have to fix sacrifice zones? What advice would you give city planners in Boston to make South Bay a healthier area for the people who live and work there?
How can we avoid creating sacrifice zones in the future?
Learn more
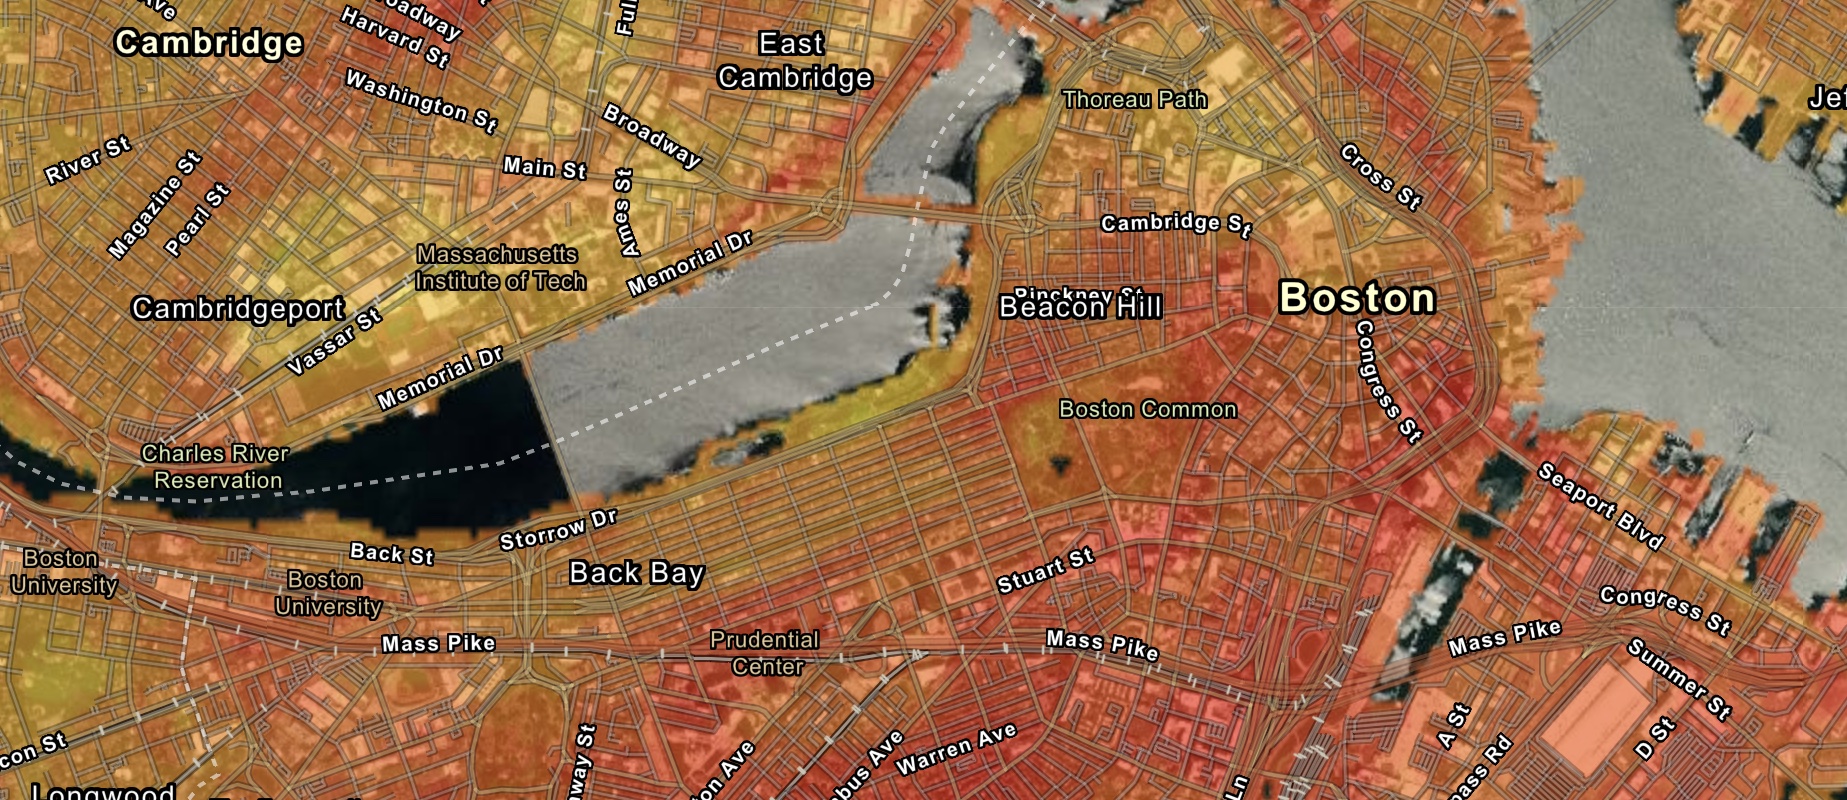
Lesson extension: Students can take a deeper look at the kinds of environmental hazards across different neighborhoods in Boston as well as a variety of rankings across different census tracts that make up the social vulnerability index.
Students could look, for example, at just the heat index in the Back Bay and South Bay and explore this one measurement across different Boston neighborhoods using the Climate Ready Boston map.