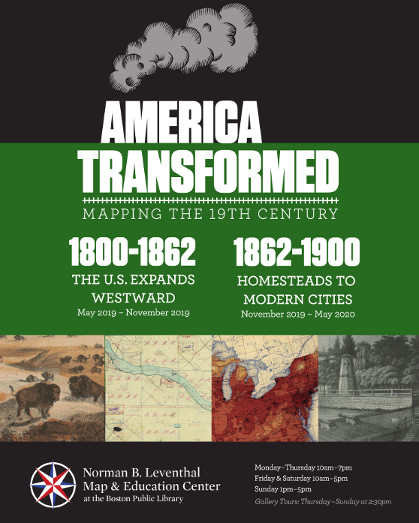
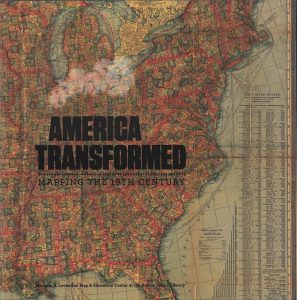
Introduction
During the 19th century, the United States expanded dramatically westward. Immigrant settlers rapidly spread across the continent and transformed it, often through violent or deceptive means, from ancestral Native lands and borderlands teeming with diverse communities to landscapes that fueled the rise of industrialized cities. Historical maps, images and related objects tell the story of the sweeping changes made to the physical, cultural, and political landscape. Moving beyond the mythologized American frontier, this map exhibition explores the complexity of factors that shaped our country over the century.
The maps in this exhibition were created predominantly by Euro-American cartographers, and published by government agencies or commercial profit-seeking companies. They promote Euro-American culture and perpetuate certain interpretations of history. Considering the inherent power dynamics helps us understand that this was at the expense of other points of view – especially of indigenous peoples, those that were enslaved, and immigrant laborers, among many others. It is important to bear in mind how these documents reveal or conceal the ways people and communities were dispossessed, exploited, and annihilated. Unseen here but equally vital are stories of heroic resilience, resistance, and cultural preservation.
The Leventhal Map & Education Center stands on land that was once a water-based ecosystem that provided for the Massachusett people who lived in the Greater Boston area. We acknowledge these indigenous people, the devastating effects of settler colonialism on their communities, and their contemporary presence.
VIEWPOINT: The perspective of Native populations in the 19th century cannot be properly told in maps, because Native concepts about land are not two-dimensional, and qualifying ownership with a paper document was an imported European concept. During the rapid expansion of the United States, the idea of Native homeland, a multi-layered place giving life, sustenance, language, spiritual communion, and kinship, would change to a theory that land is preordained to be “improved” or “developed” for the purpose of commodification. This was a near universal change from Native land management systems that had sustained populations for millennia.
America Transformed: Mapping the 19th Century, is presented in two chapters:
Part One: The United States Expands Westward, 1800-1862
This exhibition begins at the end of the 18th century, when Euro-American settlers were exploring, surveying and rapidly taking over lands west of the Appalachians that were inhabited by Native peoples, as well as the French and Spanish. The newcomers developed canals, roads, and railroads, in many places appropriating Native trails, and created an integrated transportation network. Exploiting land and mineral resources, they initiated a capitalist economy based on agriculture, mining, and industry. This part of the story concludes with three significant events in the early 1860s that had major impact on the transformation of the nation’s physical and cultural landscape: the Civil War, the passing of the Homestead Act, and the authorization of the first transcontinental railroad.
VIEWPOINT: Maps were both the mechanisms for, and witnesses to, the betrayals of justice that made the violence of dispossession and extermination possible. We can stand in witness, too, if we have the courage to look closely and listen.
Part Two: Homesteads to Modern Cities, 1862-1900, November 2019-May 2020
Homesteads to Modern Cities is the second part of this two-part exhibition and resumes the story of America Transformed in the early 1860s. Three events—the enactment of the Homestead Act, the authorization of the first transcontinental railroad, and the end of the Civil War—set in motion a frenzy of changes in American life. The northern and southern economies were rebuilt, settlement and resource exploitation expanded in the West, and urbanization and industrialization intensified in the Northeast and Midwest. Completion of the first transcontinental railroad finally linked the nation from coast to coast. Settlers continued to build a capitalist economy, no longer fueled by the labor of enslaved people but with increased reliance upon immigrant labor. And by the end of the nineteenth century, battles, treaties, and the establishment of reservations had dramatically hemmed in the land and life of Native nations. This exhibition concludes with the establishment of the modern American city, using Chicago as a case study.
The full-color, 212-page catalog of the two-part America
Transformed exhibition is available for purchase in both
hardcover and softcover editions. This richly illustrated
book features reprints, details, and captions of the maps
shown in the exhibition, along with seven essays exploring
the various dimensions of America’s momentous nineteenth
century. Purchase a catalog here.
Overview
The maps in this introduction provide a chronological overview
of how the boundaries of the United States changed during the
19th century. Originally comprised of 13 eastern states, the
United States expanded to include 48 states and territories
spanning the breadth of the continent. The familiar, tidy
story of progress and inevitability of westward expansion is
promoted in many historical American maps, including the
growing demarcation of national, state, and county boundaries
that etched U.S. colonial power and ideology into the
landscape. Some of the maps presented here speak to encounters
with Native people and offer insight into the complex and
varied ways that Native and Euro-American people interacted,
coexisted, and fought. Maps created by or copied from Native
authors conceptualize mobility and relationships between
people and places rather than precise measurements and
boundaries. A bitter and uncomfortable undercurrent is the
reality of the oppression and dispossession of millions of
Native people.
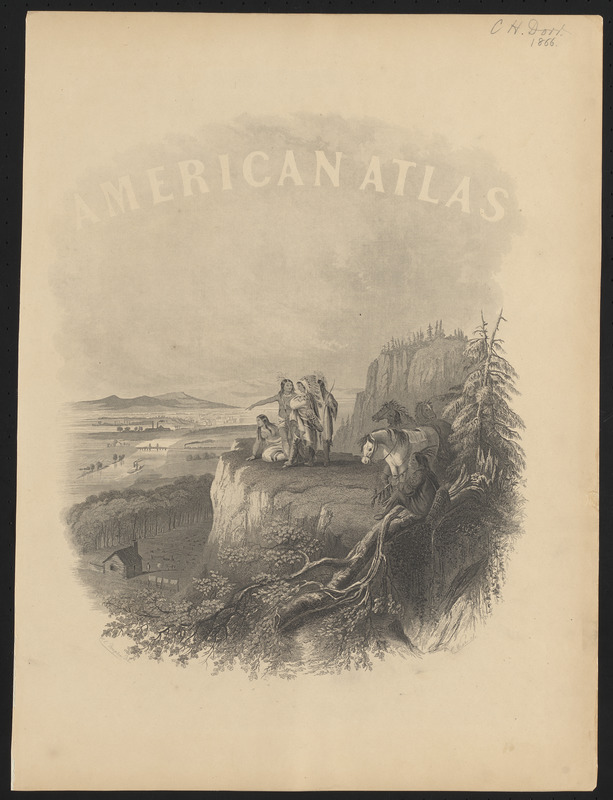
Alvin Jewett Johnson (1827-1884)
“American Atlas,”
from "Johnson’s New Illustrated (Steel Plate) Family
Atlas"
New York, 1866. Printed frontispiece, 18.5 x 14
inches. Leventhal Map and Education Center. Reproduction
2019.
Published in 1866, this family atlas frontispiece promoted a
popular, mythic vision of the American West. Four Native
people point to features of white advancement: a homestead
stands in an area cleared of trees, a steamship huffs toward a
railroad bridge, and smoke rises from a distant factory.
Bucolic depictions like these implied indigenous people
docilely accepted their displacement. They also portrayed
Native people as dwelling in an untouched, natural
environment, despite the reality that they, too, impacted the
land. The image promoted the idea that white settlers tamed
the wilderness and advanced their civilization where it was
“missing.”
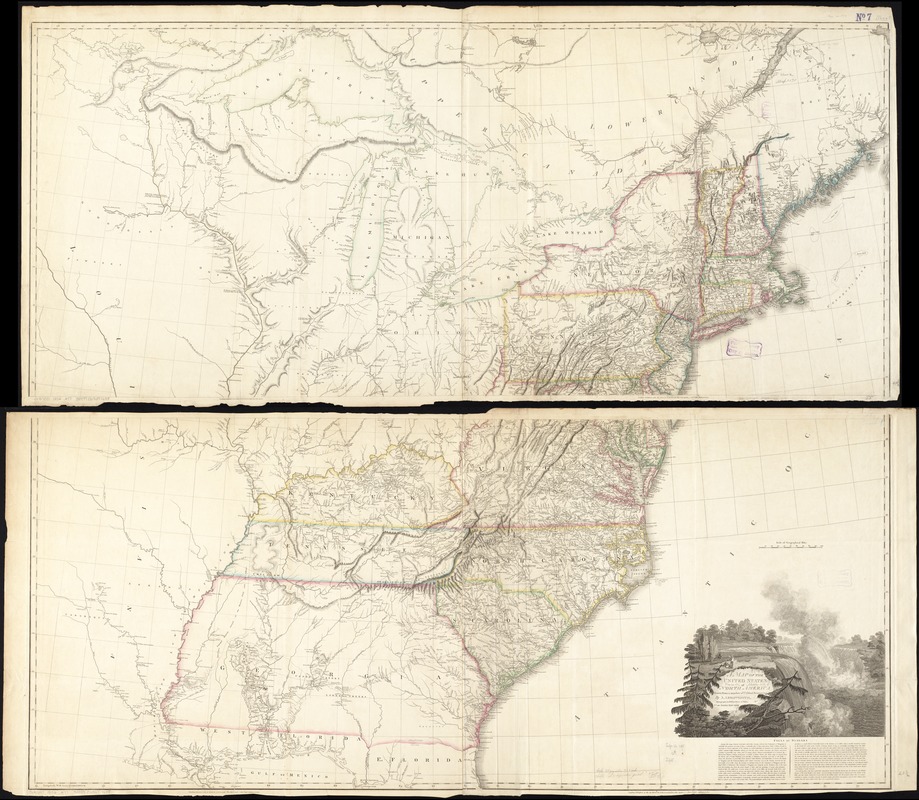
Aaron Arrowsmith (1750-1823)
"A Map of the United
States of North America"
London, 1802. Printed map, 48
x 55.5 inches. Leventhal Map and Education Center.
Reproduction 2019.
This large wall map details the United States at the onset of
the 19th century. The young nation’s western boundary is the
Mississippi River, based on the 1783 Paris Peace Treaty. In
addition to the original 13 states, three new ones appear:
Vermont, Kentucky, and Tennessee. As Euro-American settlers
moved across the Appalachian Mountains, they encountered
Native and French communities, including the Tsalagi
(Cherokee), Chikasha (Chickasaw), Chahta (Choctaw), and
Mvskoke (Creek) who inhabited expansive ancestral lands in the
southern portion of this trans-Appalachian region. An image of
Niagara Falls, which became part of the nation’s popular
iconography, adorns the cartouche.
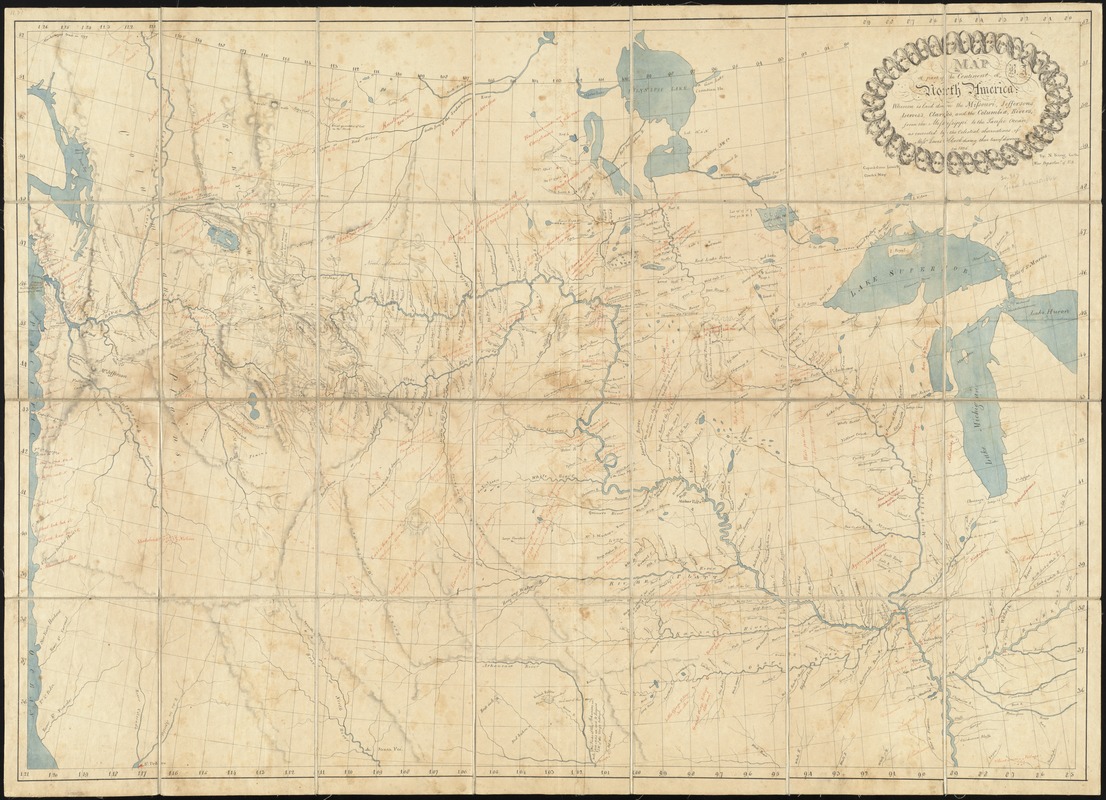
Nicholas King (1771-1812), after Meriwether Lewis and
William Clark
"Map of Part of the Continent of North
America . . . from the Mississippi to the Pacific Ocean . .
."
Washington, D.C., 1806? Manuscript map, 26.5 x 38
inches. Courtesy of the
Boston Athenaeum. Reproduction 2019.
Following the purchase of the Louisiana Territory from France
in 1803, President Thomas Jefferson commissioned the Corps of
Discovery to explore and map the new territory, develop trade
and diplomatic relations with tribal nations, and establish a
claim to the Pacific Northwest. Commanded by Meriwether Lewis
and William Clark, the Corps kept a daily record of geographic
observations and prepared numerous manuscript maps
incorporating information provided by Native people.
Particularly noteworthy are the names of tribal communities,
annotated in red ink. This was the federal government’s first
attempt to accurately map the presence of Native peoples (and
number of warriors) west of the Mississippi River. These lands
were claimed by the United States but firmly controlled by
Native peoples.
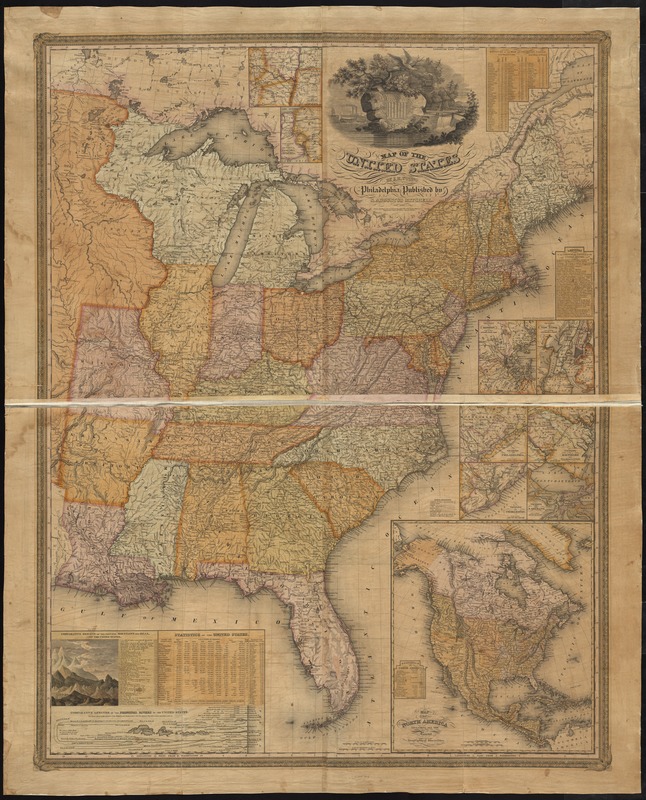
James Hamilton Young
"Map of the United States"
Philadelphia,
1831. Printed map, 42.5 x 33.5 inches. Leventhal Map and
Education Center. Reproduction 2019.
By 1831, the land east of the Mississippi had been divided
into 24 states and the Michigan territory. In addition,
American settlement and Native dispossession started to expand
west of the Mississippi with the addition of Louisiana,
Arkansas, and Missouri. The mapmakers also labeled the lands
occupied by the Tsalagi (Cherokee), Mvskoke (Creek), Chikasha
(Chickasaw), and Chahta (Choctaw) in large capital letters,
although just a year earlier, the federal government had
enacted the Indian Removal Act, which forced many tribes from
their ancestral homelands. The law paved the way for the Trail
of Tears, the name given to a series of forced relocations of
these Native nations.
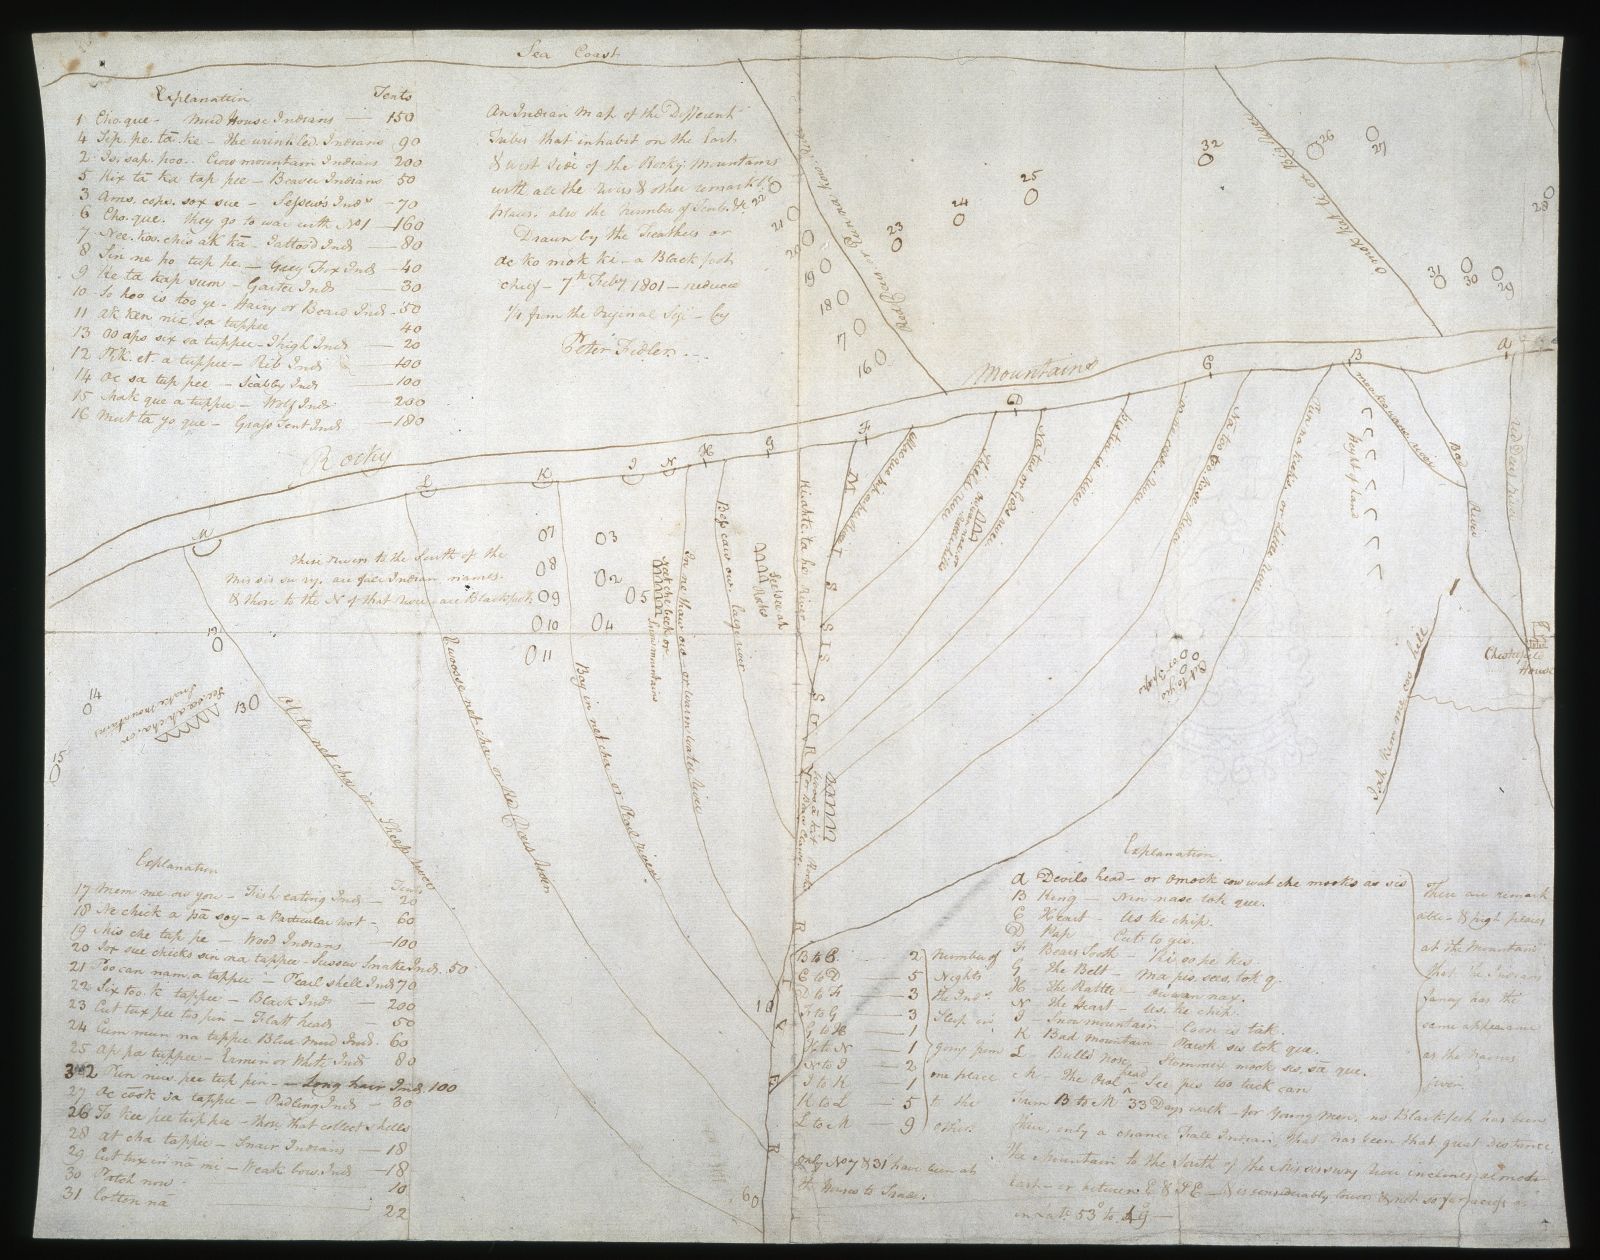
Peter Fidler (1769-1822) after Ac ko mok ki
"An
Indian Map of the Different Tribes, that Inhabit the East
and West Side of the Rocky Mountains . . ."
1801.
Manuscript map, 15 x 19 inches. Courtesy of Hudson's Bay
Company Archives,
Provincial Archives of Manitoba,
G.1/25. Reproduction 2019.
Peter Fidler, cartographer and fur trader, recorded this map
in 1801 based on one provided by Ac ko mok ki, a Blackfoot
chief. West is at the top, and a double line represents the
Rocky Mountains. Below, the headwaters of the Missouri and
Saskatchewan River systems flow eastward down the map. Over 30
tribal nations in the upper Great Plains region are noted.
When the map was forwarded to London, the physical geography
was integrated into a printed map but the data pertaining to
the tribal nations was omitted to suggest that this region was
uninhabited.
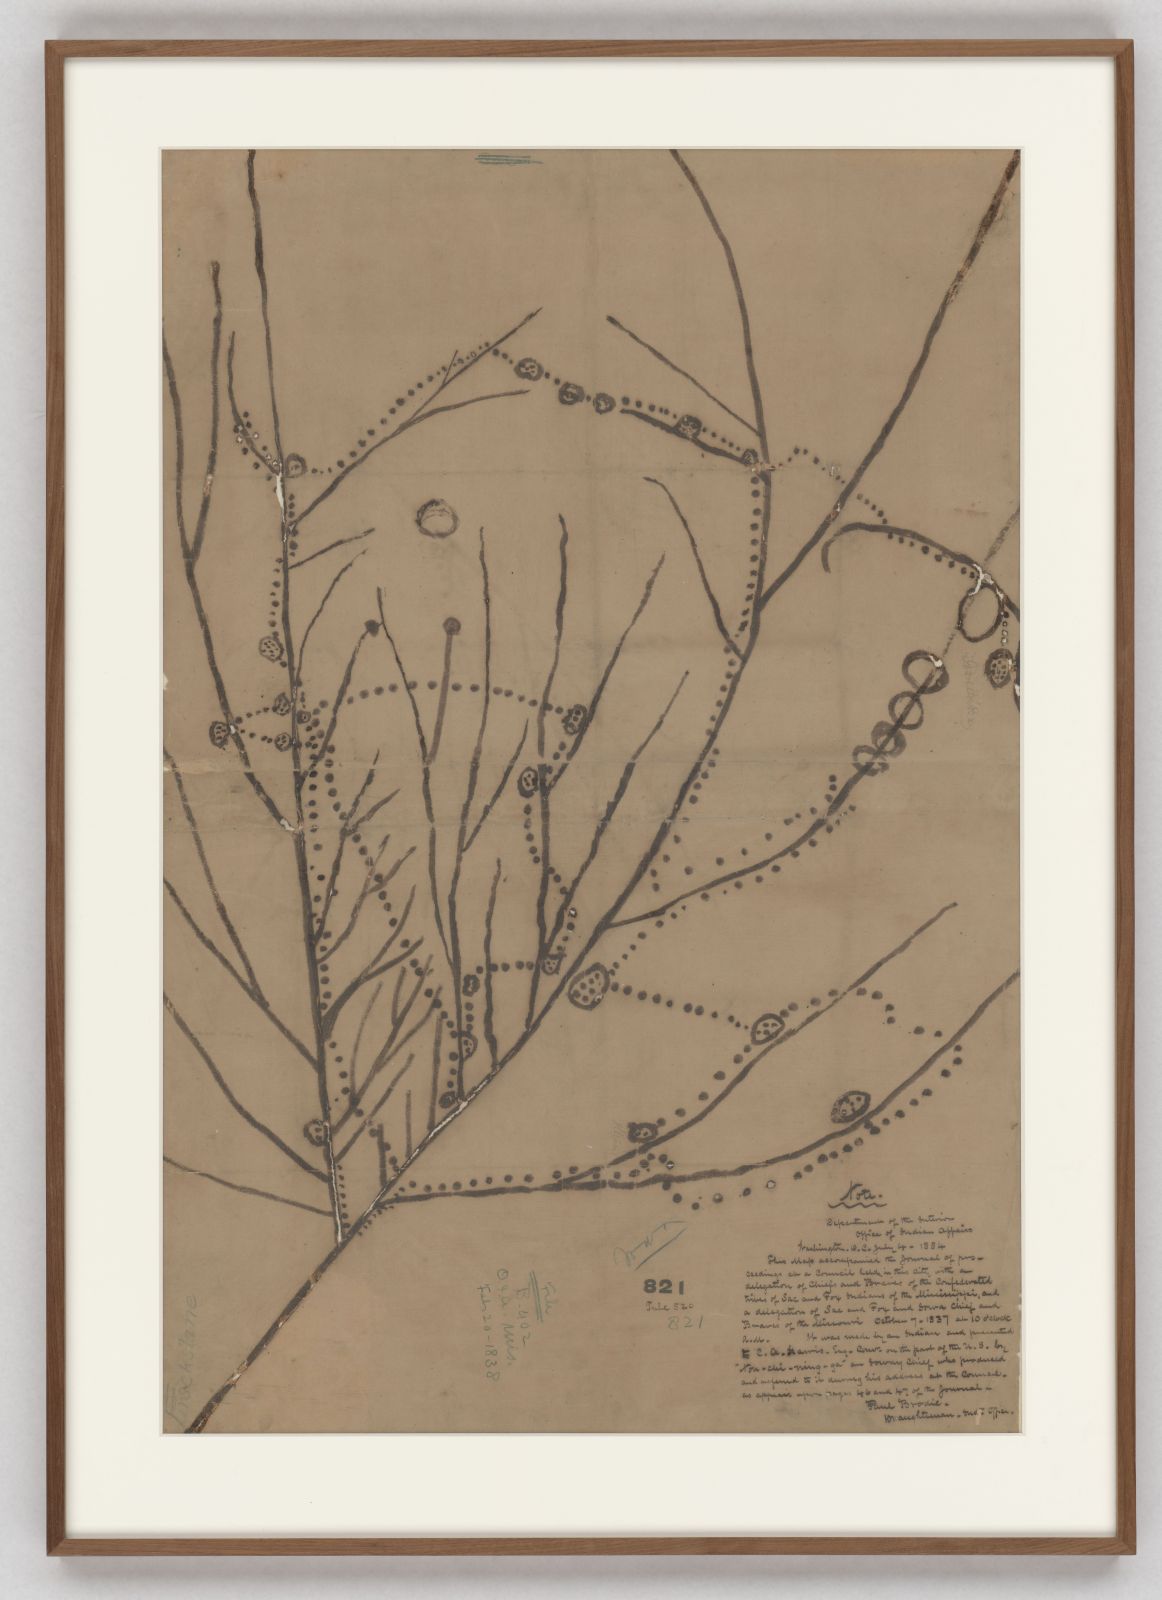
"Non-Chi-Ning-Ga’s Map of the Migration of his Indian
Ancestors"
1837. Manuscript map, 41 x 27.5 inches.
Courtesy of
National Archives and Records Administration,
Record Group 75, map 821. Reproduction 2019.
An Ioway chief named Non-Chi-Ning-Ga (“No Heart of Fear”)
prepared this schematic diagram of the Upper Mississippi and
Missouri River drainages for an 1837 treaty council in
Washington, DC. In an effort to prove the lands were theirs,
rather than Sac and Fox, the map records Ioway place names and
ancestral village sites. The tribe’s migration routes for two
centuries are marked in dotted lines, from Green Bay on Lake
Michigan (on the right) through Wisconsin to the Mississippi
River (central diagonal line) to the Missouri (vertical line
on left). Although the Sac and Fox did not dispute the history
expressed in this map, the U.S. government forced the Ioway to
relocate to reservations.
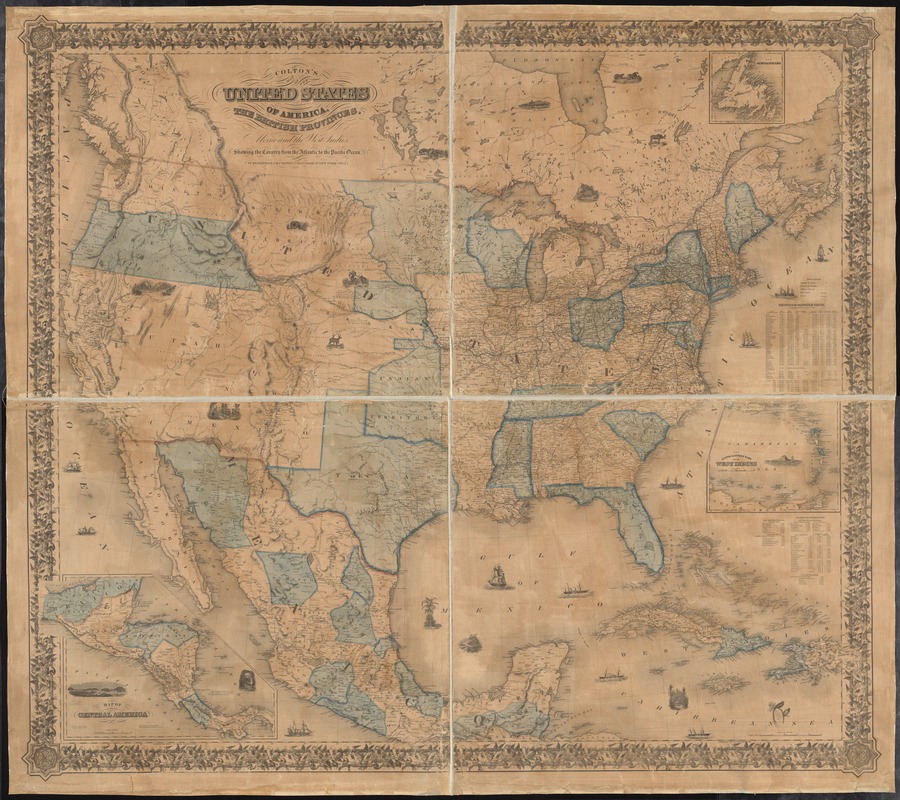
Joseph Hutchins Colton (1800-1893)
"Colton's Map of
the United States of America … from the Atlantic to the
Pacific Ocean"
New York, 1854. Printed map, 47 x 55
inches. Leventhal Map and Education Center. Reproduction
2019.
During the 1840s and early 1850s, the political geography of
the West changed dramatically. The nation annexed Texas,
established the 49th parallel as its northwestern boundary,
claimed the Oregon Territory, and won land from Mexico
following the Mexican-American War. By the time this map was
published in 1854, the United States included 31 states and
seven territories. Commercially published maps like this one
celebrated the nation’s expansion with small vignettes
dispersed throughout these newly acquired territories
depicting Native people, wildlife, and a wagon train. It also
suggests a unified nation, but a statistical table enumerating
free and enslaved population alludes to conflicts over whether
to extend slavery into the western territories and foreshadows
the impending Civil War.
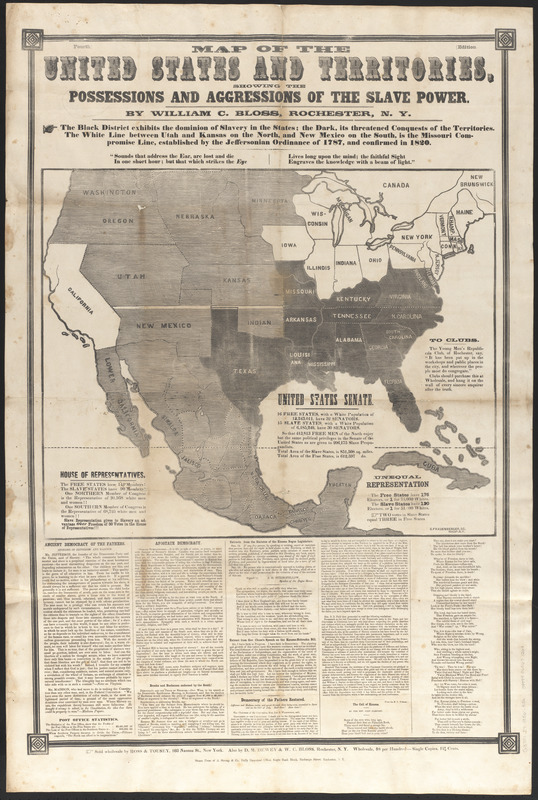
William C. Bloss (1795-1863)
"Map of the United
States and Territories Showing the Possessions and
Aggressions of the Slave Power"
New York and Rochester,
NY, 1856? Printed broadside, 41.5 x 27.5 inches. Leventhal
Map and Education Center. Reproduction 2019.
While Colton’s map suggests a unified nation extending from
the Atlantic to the Pacific, this broadside published about
the same time boldly addresses the slavery issue. It
identifies free states in white, slave states in black, and
contested territories in gray. Issued during the 1856
presidential election, this stark graphic implicitly supports
the candidacy of Republican John C. Frémont, who opposed
slavery’s expansion. It also forcefully challenges the
so-called Three-Fifths Compromise which counted three out of
five slaves toward calculating southern political
representation, while denying those enslaved peoples any
voting privileges or freedom.
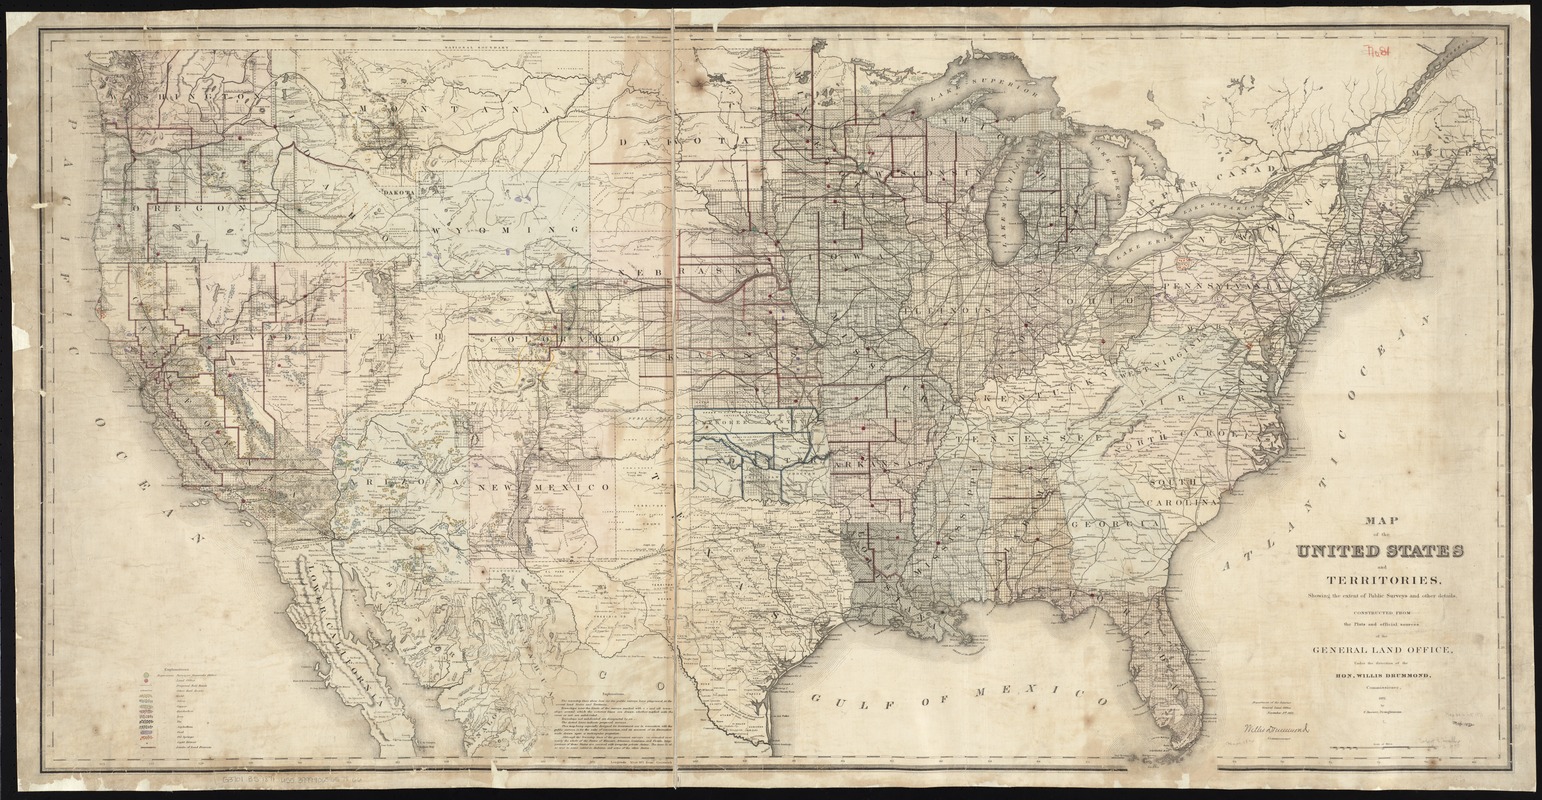
U.S. General Land Office
"Map of the United States and
Territories, Showing the Extent of Public Surveys. . ."
Washington,
DC, 1871. Printed map, 27.5 x 55 inches. Leventhal Map and
Education Center. Reproduction 2019.
Published shortly after the American Civil War, this map
depicts a reunited nation, but it also provides an inventory
of land and mineral resources. While the General Land Office,
the federal agency responsible for surveying and selling
public lands, produced this map as a yearly update of its
activities, it also promoted further expansion of western
settlement. The square grid pattern appearing in most states
west of the Appalachian Mountains indicates the extent of
public land or township surveys. Color coding identifies the
location of mineral resources. Reflecting the efforts to unify
the nation after the Civil War, this map marks the route of
the first transcontinental railroad.
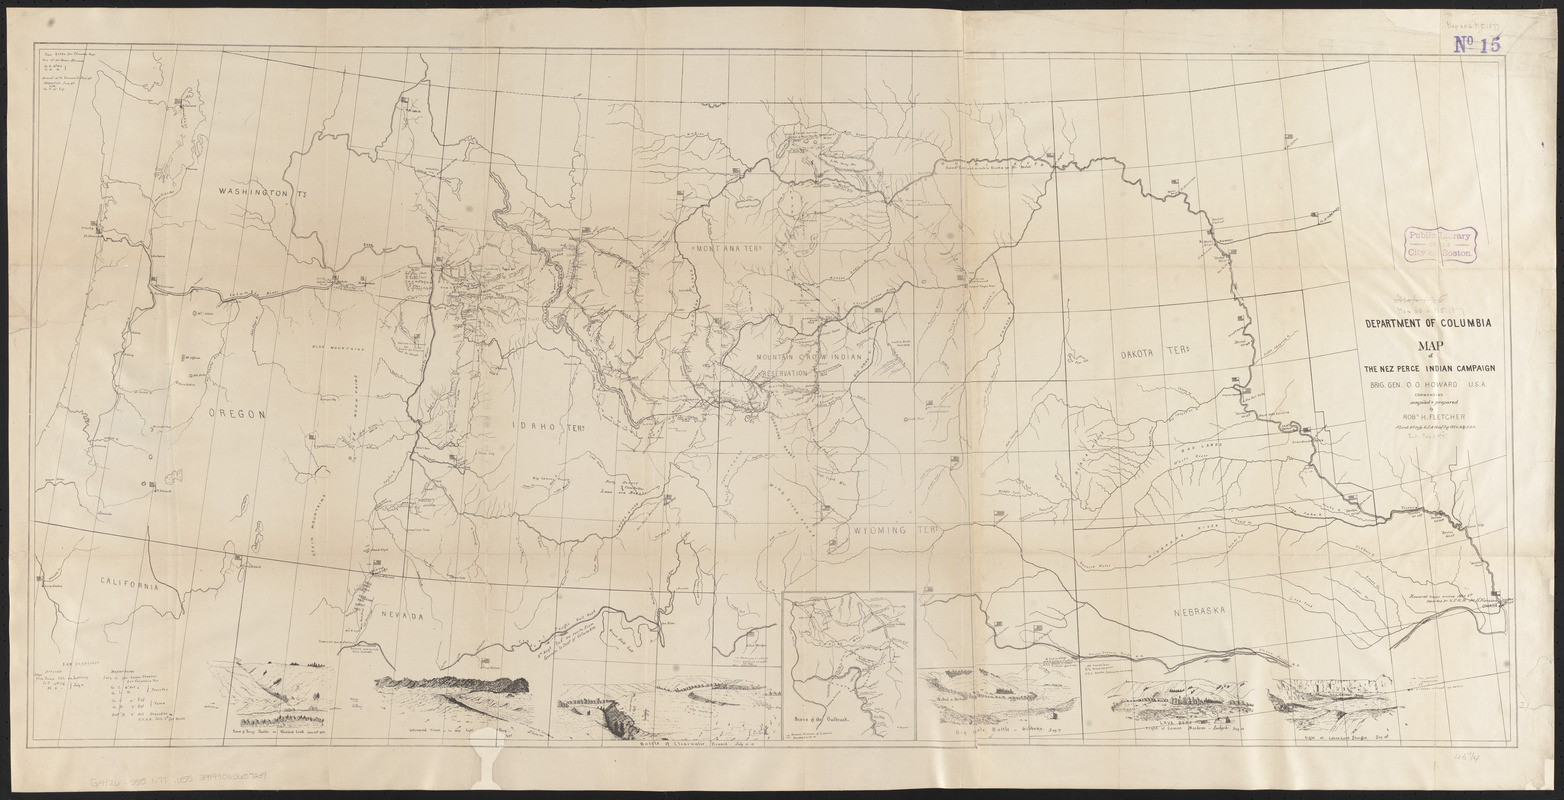
Robert H. Fletcher
"Map of the Nez Perce Indian
Campaign, Brig. Gen. O. O. Howard, Commanding"
Washington,
DC, 1877. Printed map, 24 x 47.25 inches. Leventhal Map and
Education Center. Reproduction 2019.
This military map records the Nez Perce War in 1877, one of
the final campaigns of the U.S. Army against the tribal
nations of the Pacific Northwest. Gen. Oliver Otis Howard, a
Union Civil War leader, Commissioner of the Freedmen’s Bureau,
and a founder of Howard University, led U.S. troops. They
pursued several bands of Nimiipuu (Nez Perce) who refused to
surrender their ancestral lands and move to a smaller
reservation in Idaho. Threatened with forced removal, they
embarked on a northward trek to find sanctuary in Canada.
After a fighting retreat of 1,170 miles and 18 skirmishes and
battles, they surrendered just south of the Canadian
border.
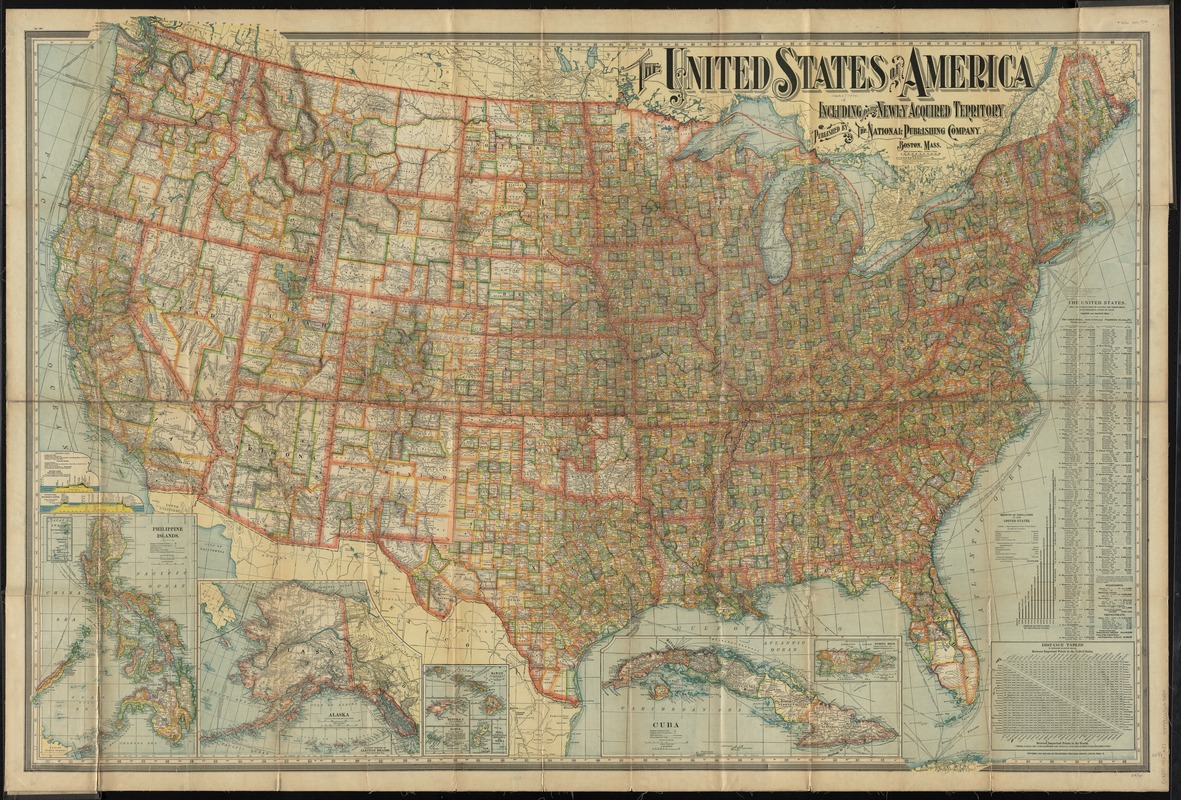
National Publishing Company
"The United States of
America: Including All Its Newly Acquired Territory"
Boston,
1902. Printed map, 38 x 55 inches. Leventhal Map and
Education Center. Reproduction 2019.
While this information-packed map summarizes the nation’s
political geography and population growth after a century of
territorial expansion and native removals, it also documents a
new arena for empire building beyond the continent. Brightly
colored boundaries outline 48 states and organized
territories, as well as counties within each. Settlement in
the eastern half of the country was denser than the West,
which was characterized by much larger states and counties.
Graphs and tables demonstrate the growth of population from
3.9 million in 1790 to over 76 million in 1900. Marginal
insets depict Alaska and Hawaii (taken by a coordinated
overthrow of the Hawaiian Queen just a few year prior), as
well as “newly acquired territories” in the Caribbean and
across the Pacific.
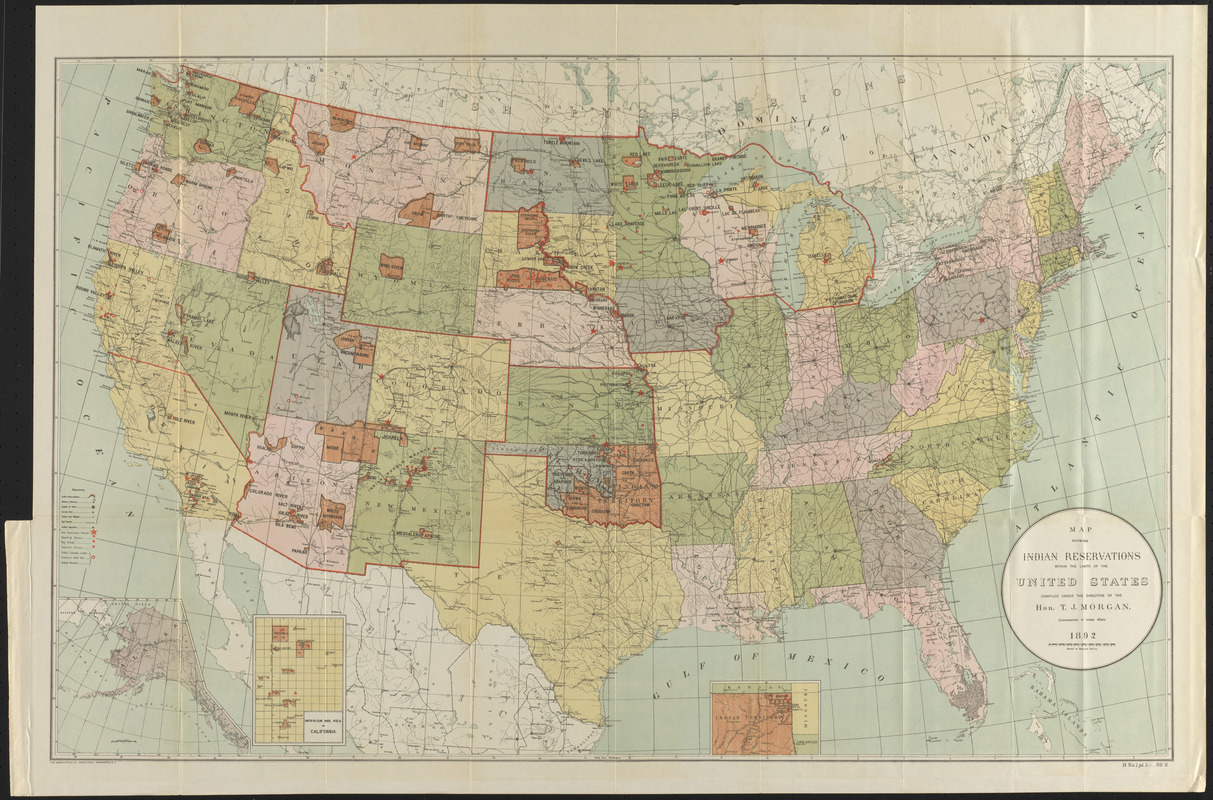
Commissioner of Indian Affairs
"Map Showing Indian
Reservations within the Limits of the United States"
Washington,
DC, 1892. Printed map, 38 x 55 inches. Courtesy of Lawrence
Caldwell. Reproduction 2019.
By the 1890s, many Native tribes were displaced and forced to
live on reservations, comprising a fraction of their homeland,
on territory designated as the most undesirable for settlers
or in totally different environments than originally
inhabited. This map depicts the locations, sizes, and
boundaries of reservations, which were usually established by
treaties ratified by the U.S. Senate. In many cases Congress
did not ratify treaties signed in good faith by Native
peoples, and the agreed upon reservation boundaries were
renegotiated to the benefit of the government and the states.
In 1887, the Dawes Act (General Allotment Act) further reduced
the size of reservations by permitting the federal government
to assign land to individual Native families, rather than
tribes. The law fragmented reservations and opened more land
to non-Native settlers.
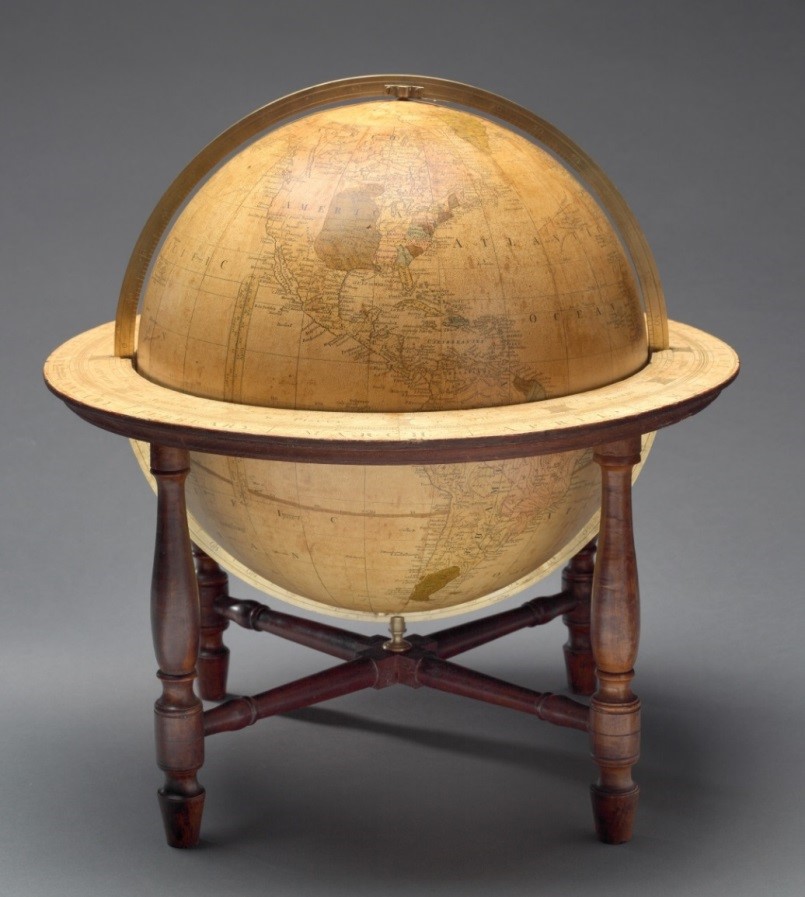
James Wilson (1763-1855)
"A New American Terrestrial
Globe"
Bradford, VT, 1811. Globe, 17 x 17 x 19 inches.
Leventhal Map and Education Center.
At the beginning of the 19th century, Americans had access to
globes, but they had to import them from Europe. James Wilson,
who became the first to produce globes in the United States,
made this globe in 1811. Rather than identifying the specific
region that was part of the United States, he labeled the
entire continent “America.” Wilson marked the boundaries of
the eastern states and Louisiana Purchase and noted the names
of several tribal nations. Since white cartographers had
extensively mapped the East, the globe features more detail in
that region than in the West.
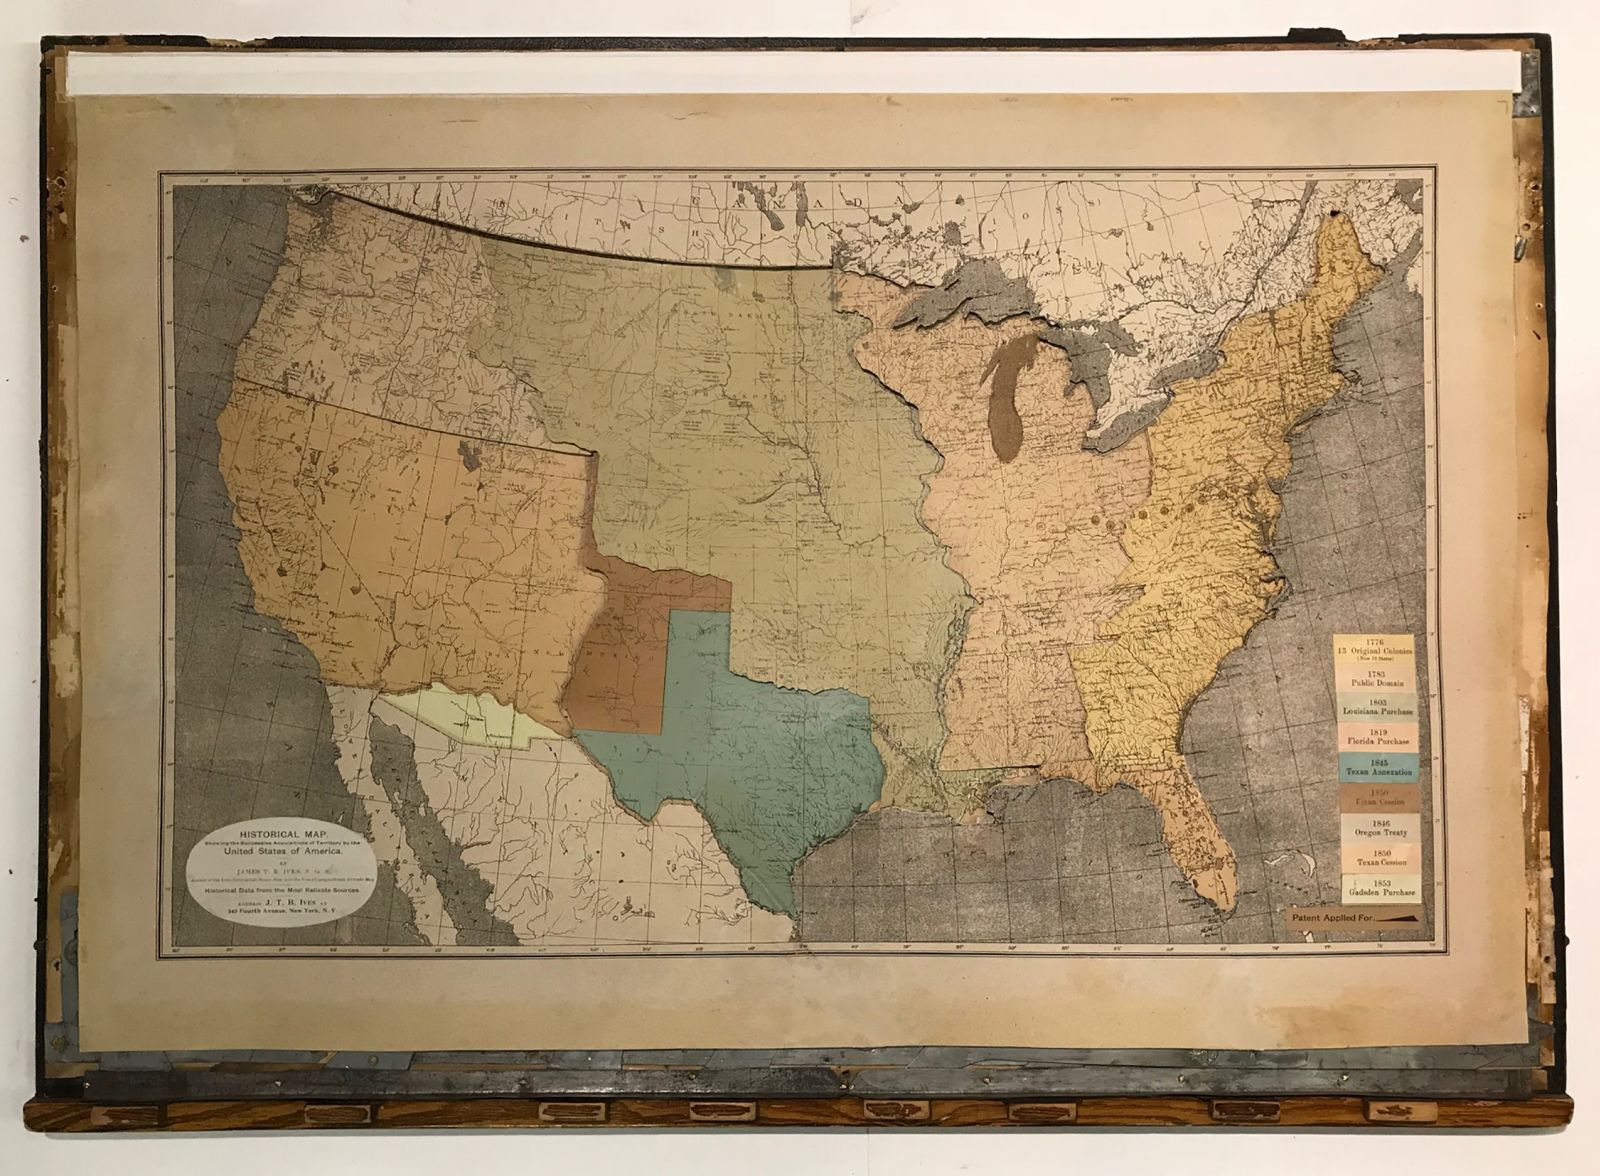
James T.B. Ives (1839-1915)
"Historical Map Showing
the Successive Acquisitions of Territory by the United
States of America"
New York, 1896. Mechanical map, 24.5 x 34 inches. Courtesy
of
Barry MacLean Collection.
The boundaries of the United States transformed during the 19th century. Mapmaker James Ives created this mechanical map to help people, especially students, visualize these changes. The base map labels the tribes that occupied different regions, while the upper layers represent the territorial growth of the United States. The mechanized pieces of this cartographic puzzle include the colonies in 1776, the Louisiana Purchase in 1803, and the Gadsden Purchase in 1853. The map told a story of the seemingly inevitable process of expansion and emphasized nation-building by treaties rather than the violence of war.
1a. LAND 1800-1862: Exploring, Surveying, and Conserving the Land
To most people of European descent, the land west of the Mississippi River was unknown, although Native peoples were deeply knowledgeable about the land on which they hunted, traded, farmed, and developed communities. In the 1780s, government officials initiated the settler-colonial process of westward expansion. The maps and artifacts in this exhibition illustrate how Congress set the principles for surveying and selling public lands that had been gained through purchase, treaty, trickery, warfare, and forced removal.
Surveyors standardized the practice of dividing land into six-mile square townships providing the foundation for settlement patterns in western states. Government surveys noted the land claims of earlier French and Spanish inhabitants but failed to recognize lands claimed by Native tribes.
Meriwether Lewis and William Clark set out to inventory and
map the newly acquired Louisiana Purchase in the early 1800s.
Their trip paved the way for similar government-sponsored
expeditions and culminated in the 1850s with the Pacific
Railroad Surveys, which mapped potential routes for the first
transcontinental railroad. Each of these efforts brought back
cartographic and scientific data about the inhabitants,
landscape, natural resources, and wildlife. By the final third
of the century, many Americans became concerned about
conserving these natural resources and landscapes that were
rapidly disappearing through economic exploitation.
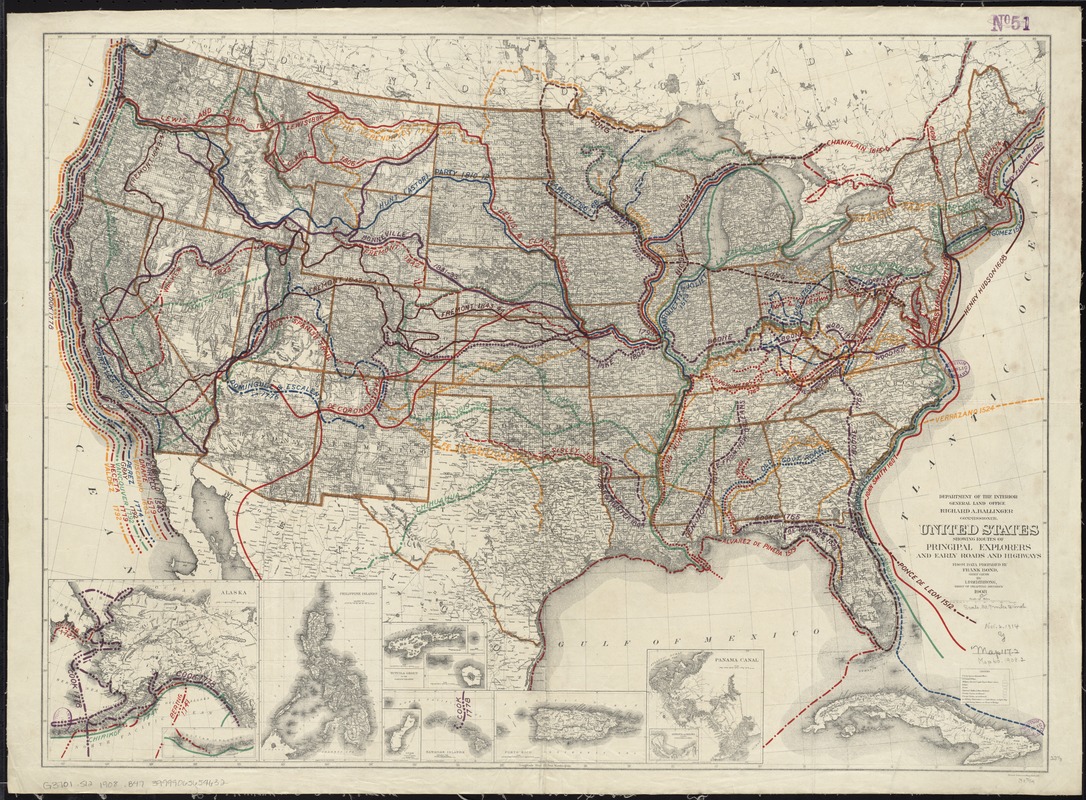
Frank Bond (1856–1940) and I. P. Berthrong
“United
States Showing Routes of Principal Explorers and Early Roads
and Highways”
Washington, DC, 1908. Printed map, 23.5
x 32 inches. Leventhal Map and Education Center.
Reproduction, 2019.
Frank Bond, a General Land Office surveyor, draftsman, and
finally Chief Clerk, created this thematic, historical map
that was atypical of other GLO publications. He compiled the
major Spanish, Dutch, French, British, and American routes
during four centuries of Euro-American exploration. This
colorful presentation was overlaid on a standard base map that
showed the extent of township surveys by the beginning of the
20th century. The map demonstrated the current state of
geographical knowledge and suggested that by this time there
was little unmapped land.
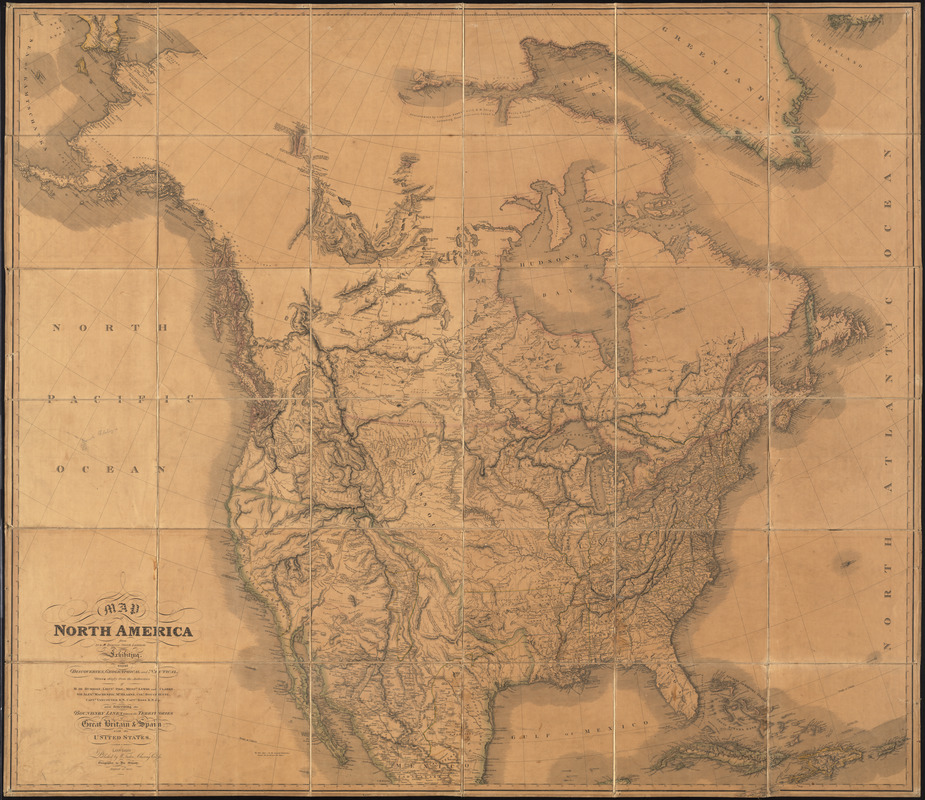
William Faden (1749–1836)
“Map of North America from
20 to 80 Degrees North Latitude: Exhibiting the Recent
Discoveries …”
London, 1820. Printed map, 59 x 66
inches. Courtesy of Lawrence Caldwell. Reproduction, 2019.
This large wall map integrated topographic and hydrographic
detail gained from various European and American explorations
of interior North America. It included data from expeditions
led by Alexander von Humboldt (northern Mexico), Alexander
MacKenzie (Canadian Great Plains), and George Vancouver
(Pacific northwest coast), as well as Meriwether Lewis,
William Clark, and Zebulon Pike, all of whom were commissioned
by President Thomas Jefferson to explore the newly acquired
Louisiana Territory. This accumulated knowledge demonstrated
that the western part of the continent was not dominated by a
single mountain range as was previously hypothesized, but by a
complex series of ranges that came to be known as the Rocky
Mountains.
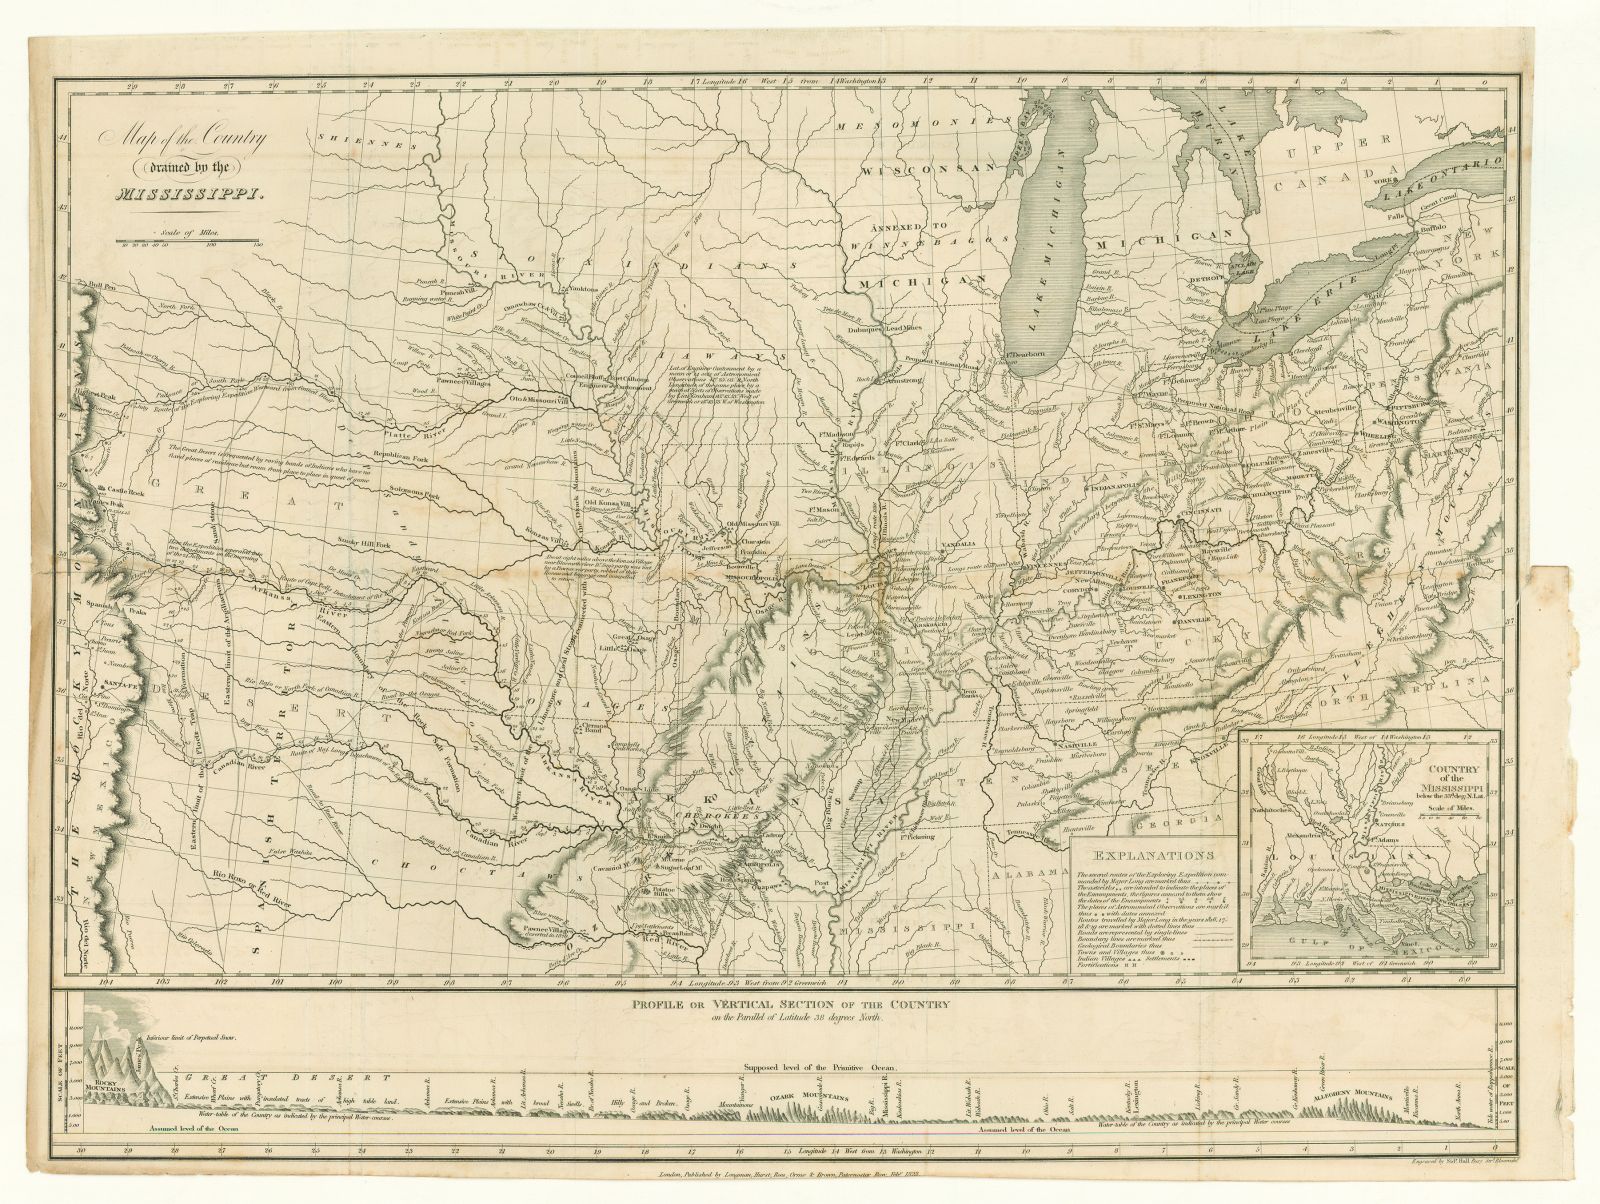
Edwin James (1797–1861)
“Map of the Country Drained by
the Mississippi,” in “Account of an Expedition from
Pittsburgh to the Rocky Mountains … under the Command of
Major Stephen H. Long ...”
London, [1823]. Printed map,
16 x 21 inches. Courtesy of
Barry MacLean Collection.
Maj. Stephen H. Long’s scientific expedition (1819–1820)
continued the tradition of U.S. Army-sponsored exploration.
The expedition culminated in a published narrative with a map
that delineated Long’s route from St. Louis up the Missouri
and Platte Rivers to the Rocky Mountains. Information for the
eastern half of the map was borrowed from commercial sources,
while the western half corrected geographical errors made by
previous expeditions. However, Long incorrectly characterized
the High Plains as the “Great American Desert” (see
southwestern quarter of map). This misconception may have
deterred Euro-American settlement of the Great Plains during
the early and mid-19th century.
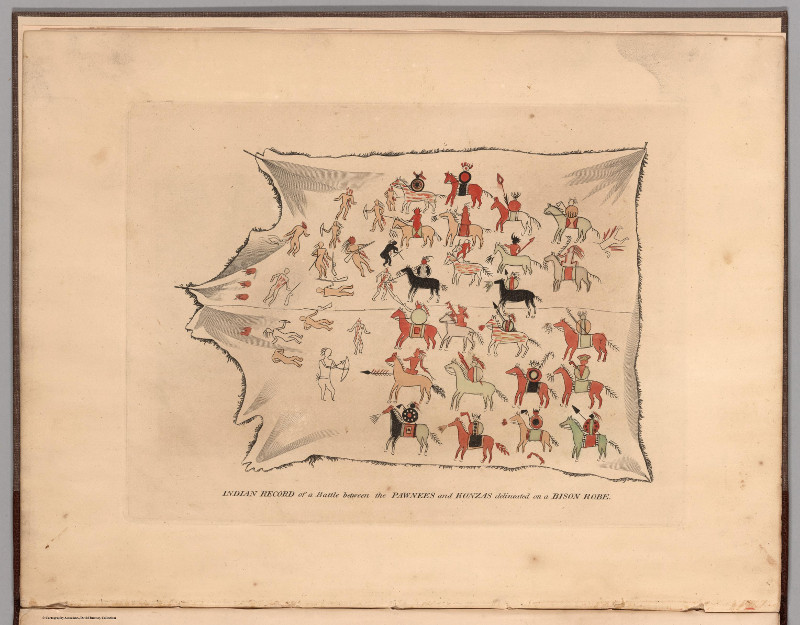
Edwin James (1797–1861)
“Indian Record of a Battle
between the Pawnees and the Konzas. A Facsimile of a
Delineation upon a Bison Robe,” in “Account of an Expedition
from Pittsburgh to the Rocky Mountains …”
London,
[1823]. Print, 6 x 7.5 inches. Courtesy of
David Rumsey Collection. Reproduction, 2019.
Rather than relying on Native knowledge, Long’s party included
scientists and artists for the first time. Although artist
Samuel Seymour drafted more than 150 sketches, the report
published only eight, which documented landscapes and
encounters with Native people. The final and most unique plate
reproduced a buffalo robe showing a battle between Pawnee and
Kansa (Kansas) warriors. The design provides a contrast with
Euro-American methods of recording events in time and space,
depicting the spatial interrelationships of individuals drawn
in profile to record the conflict.
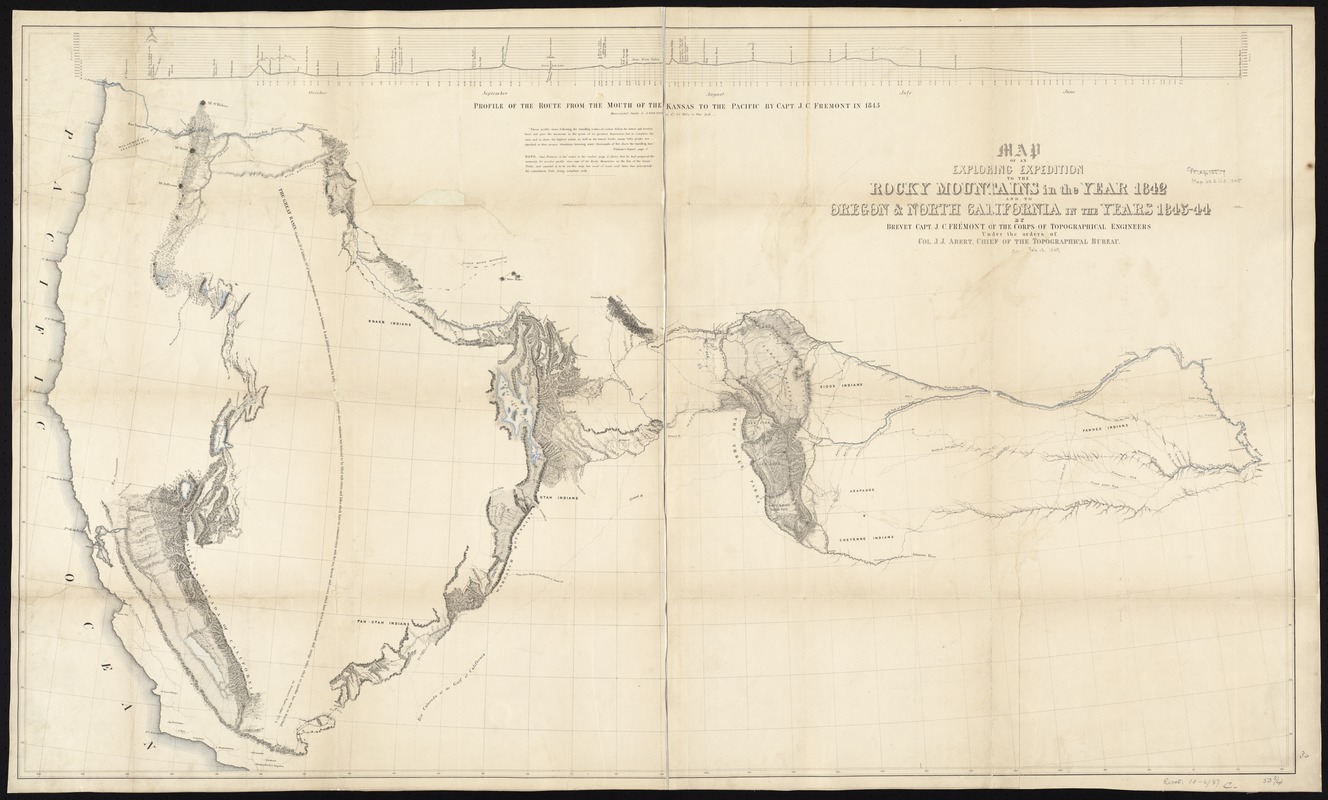
John C. Frémont (1813–1890)
“Map of an Exploring Expedition to the Rocky Mountains … and
to Oregon & North California …”
Washington, DC,
1845. Printed map, 59 x 66 inches. Leventhal Map and
Education Center.
During the 1840s, Americans became interested in the Far West
as they settled the Oregon Territory and entered the
Mexican-American War. One American explorer who made major
contributions during this period was John C. Frémont, who led
five scientific expeditions. Charles Preuss, a German
immigrant and the expedition’s cartographer, prepared this map
depicting only the geographic information collected. Frémont’s
official reports, written with the assistance of his wife
Jessie (daughter of expansionist-minded Missouri senator
Thomas Hart Benton), gave “manifest destiny” a popular text.
Advocates of “manifest destiny” believed it was the nation’s
mission and preordained right to spread American institutions
and culture, thus justifying a policy of territorial
expansion.
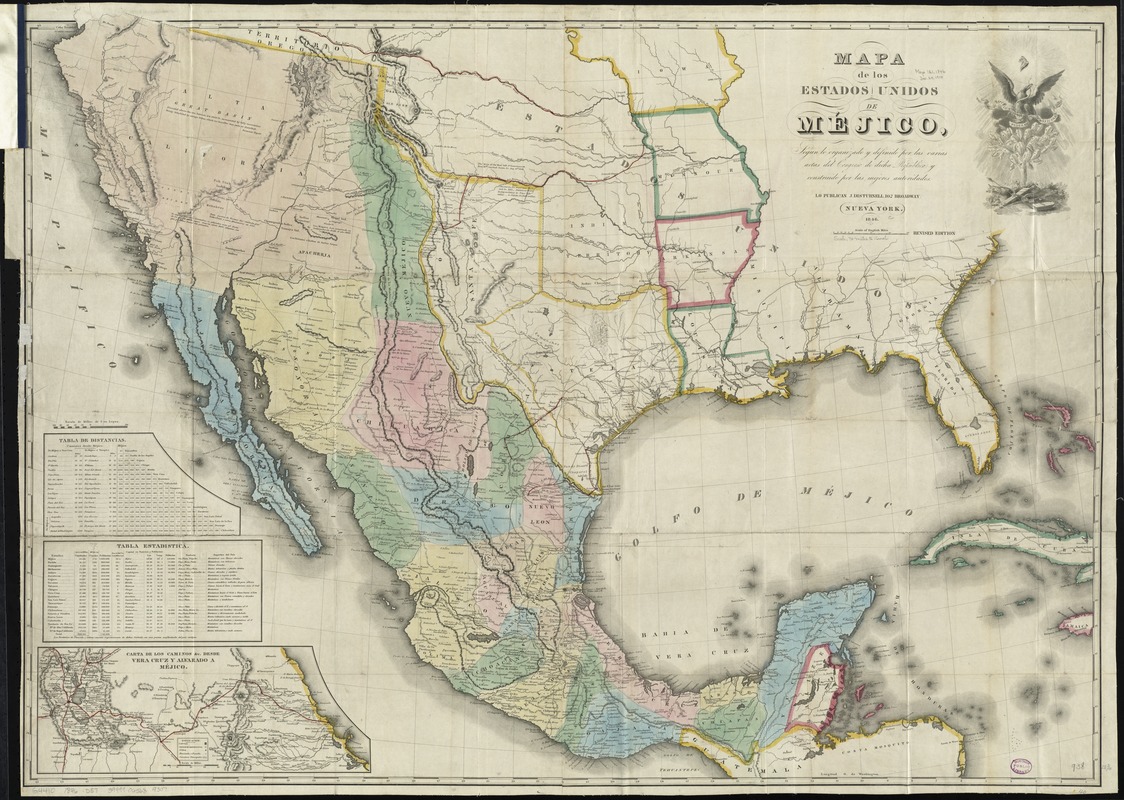
John Disturnell (1801–1877)
“Mapa de los Estados
Unidos de Méjico”
New York, 1846. Printed map, 30 x 37
inches. Leventhal Map and Education Center.
Published a year after the annexation of Texas, at the outbreak of the Mexican-American War, this map depicts the northern region of Mexico (today part of the United States). It reveals a cultural landscape with both Spanish and Native settlements. Besides the Spanish settlements in southeastern Texas, there were three other clusters in this northern region – the upper Rio Grande (New Mexico), southern Arizona, and the California coast. While some Spanish settlements had been established more than a century earlier, Spanish culture was imposed on numerous Native groups already living in the area including the Pueblo, Numunu (Comanche), N’Dee (Apache), Hopitushínumu (Hopi), and Diné (Navajo).
VIEWPOINT: This map offers a great example of the fluidity of geography, as we can see how its meaning had shifted and would shift again. Lost in the designs of nation-states are the numerous indigenous geographies (still visible in maps like this) that remain in place and persist to this day.
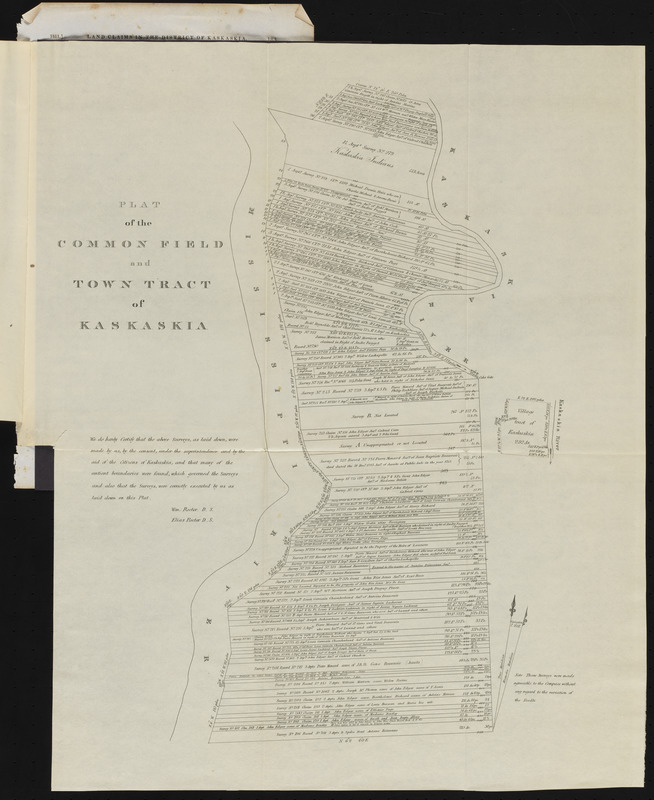
William Rector (1778–1827) and Elias Rector (d. 1822)
“Plat
of the Common Field and Town Tract of Kaskaskia”
Washington,
DC, 1807. Printed map and report, 20 x 17. Courtesy of
Lawrence Caldwell. Reproduction, 2019.
U.S. officials agreed to adjudicate land grants, known as
private land claims, that had been made by French, British,
Spanish and Mexican governments to their settlers. The first
of these transactions were for early French settlements, such
as the village of Kaskaskia shown here, later named the
capital of the Territory of Illinois. On this map, the Common
Field is divided into long narrow lots, a common
characteristic of French settlements. These irregular surveys
were incorporated into the rectangular grid pattern.

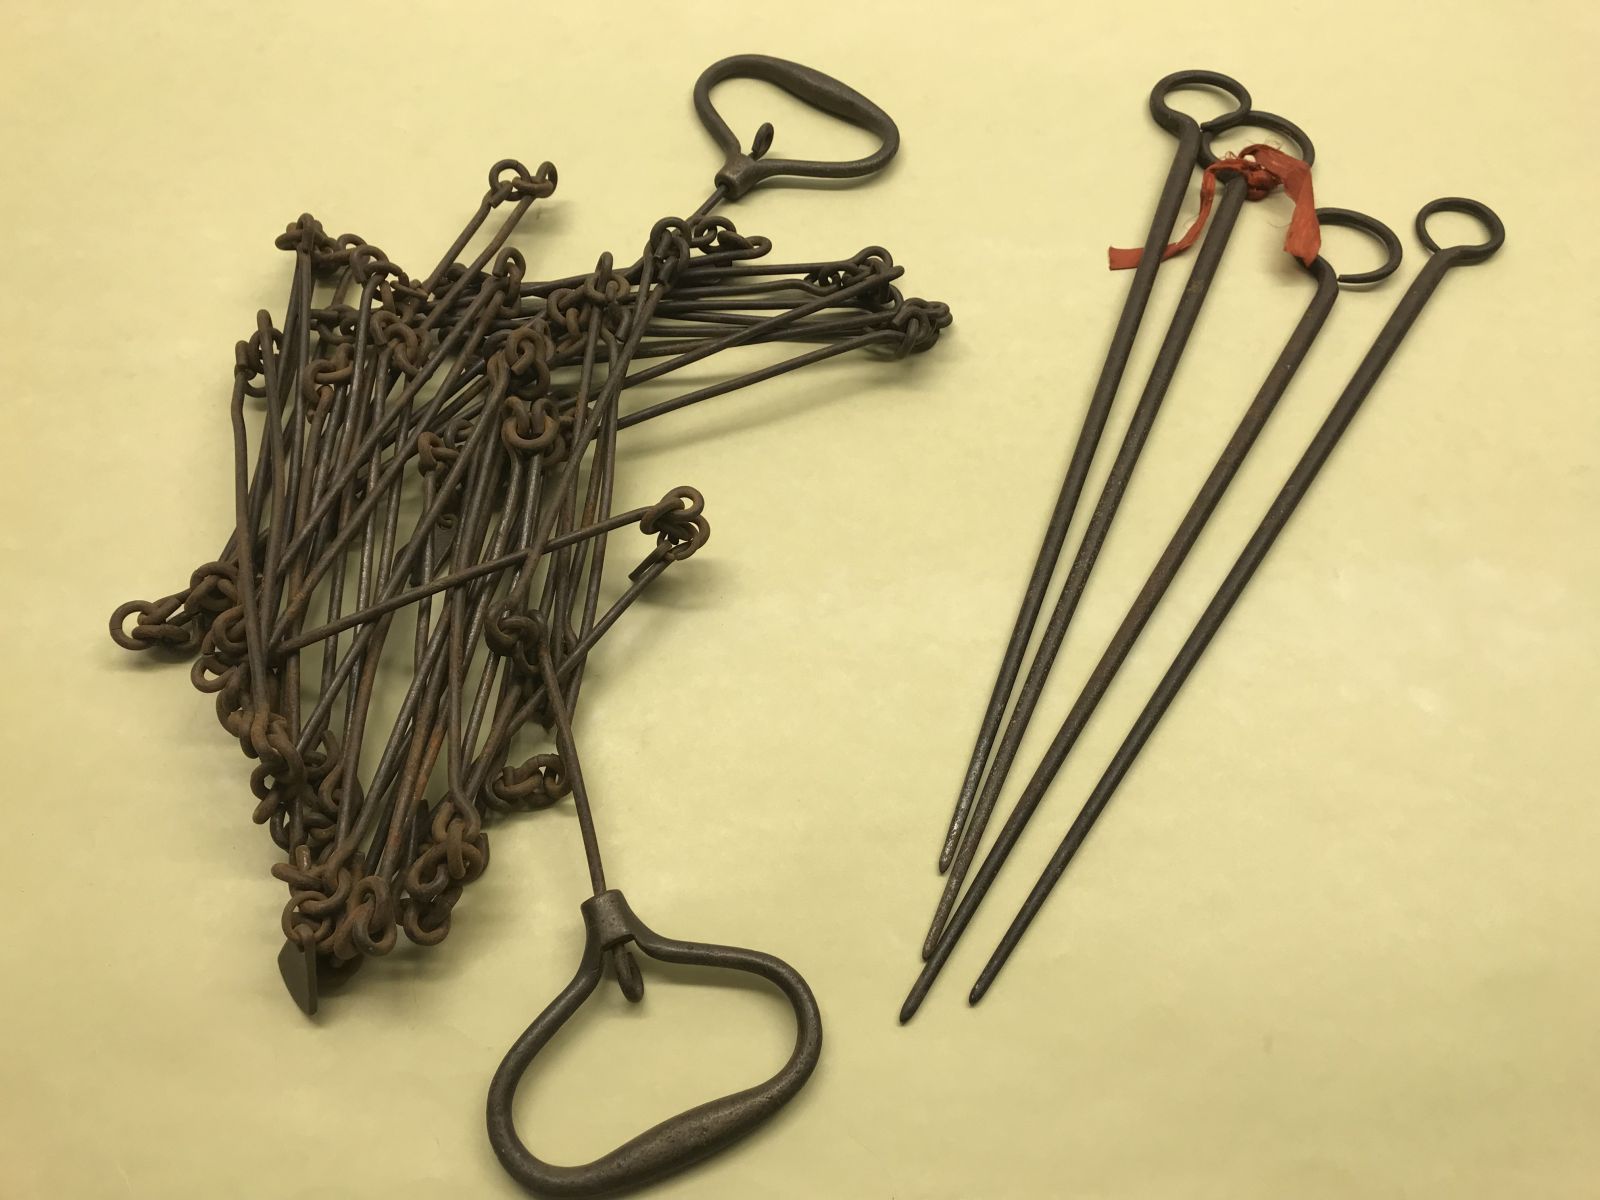
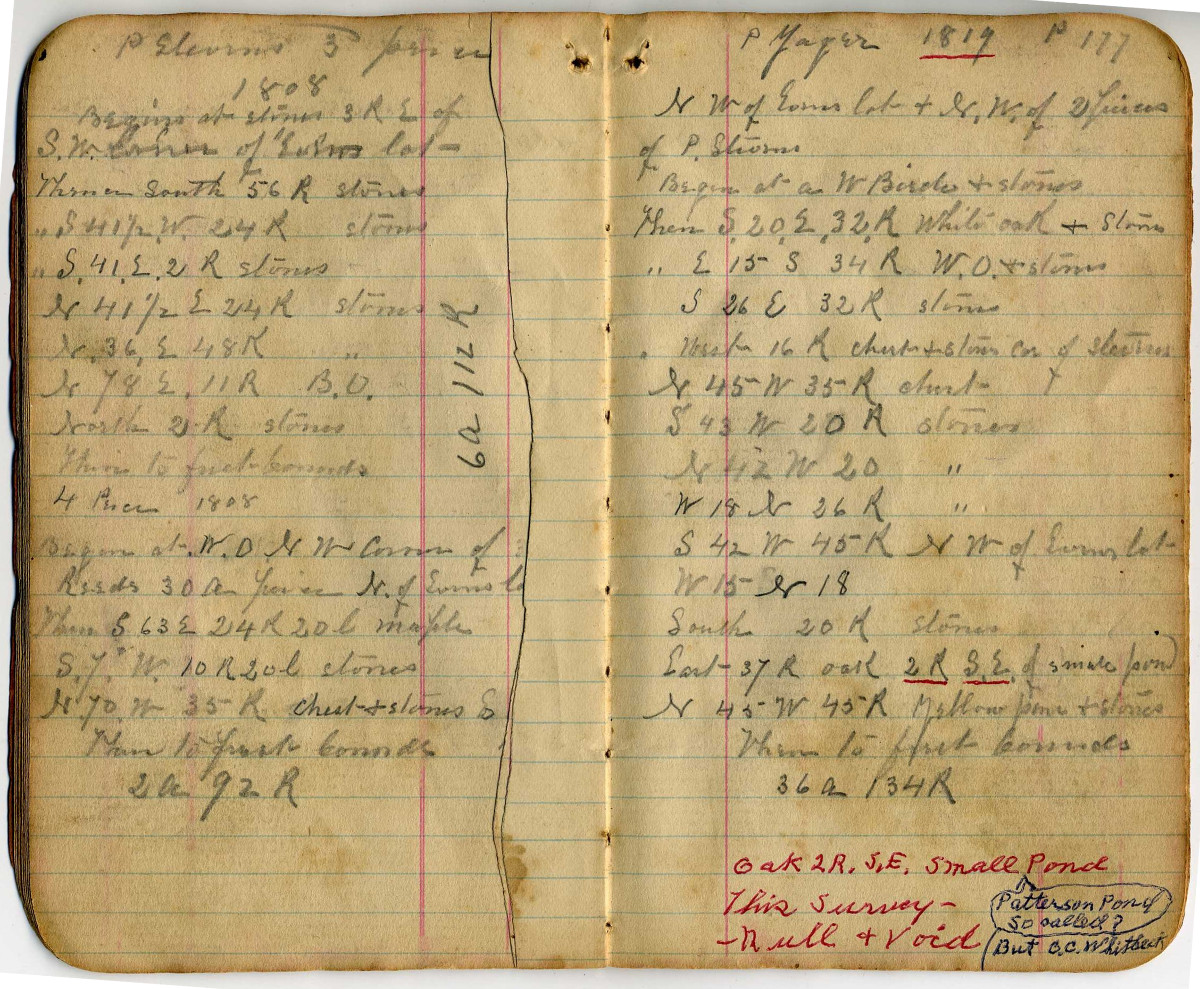
Horace Minot Pool (1803–1878)
“Surveyor’s Compass,
Chain and Chain Pins, and Field Notes”
Easton, MA,
1841-1878. Leventhal Map and Education Center.
Surveyors determined angles or direction in simple cadastral
or property surveys using a compass, like this one made in
Easton, Massachusetts. They measured distance with an
iron-link chain of 100 links or 66 feet, using a unit called a
pole or rod which equaled 16.5 feet. An example of surveyor’s
field notes documenting the “metes and bounds” of a survey
opens with “Begin at a W. Birch and stones, then S 20 E 32 R.
White oak and stones.”
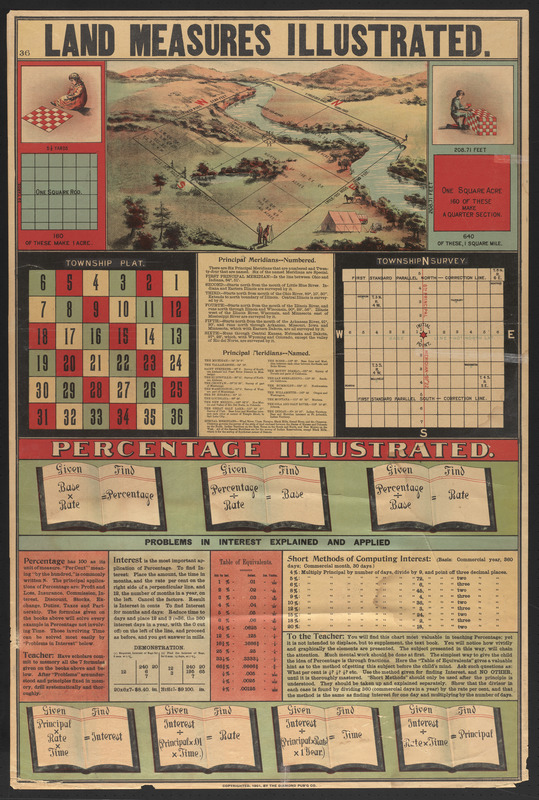
Diamond Publishing Co.
“Land Measures Illustrated”
Minneapolis, 1901. Broadside, 41 x 27.5 inches.
Leventhal Map and Education Center.
This educational poster illustrates the structure of General
Land Office township surveys. The top scene depicts surveyors
laying out a single section, measuring one mile by one mile
and containing 640 acres. The diagram labeled “Township Plat”
demonstrates the division of a township into 36 sections,
while the “Township Survey” diagram explains that townships
are identified in relation to a base line and meridian
(representing an X-Y axis). Each parcel of land has a unique
numerical identifier such as the 40-acre tract where the
surveyors stand could be identified as the SE 1/4 of the SE
1/4 of Section 1, Township 3 North, Range 4 West, 6th
Principal Meridian.
VIEWPOINT: These divisions remind us of the harmful game of wrongful land dispossession. For Native people, these squares represent a systematic disruption of our ancestral ways of life. This diagram reflects the colonial concept of land ownership: packaged up in little squares, as though one can compartmentalize a way of life and sell it.
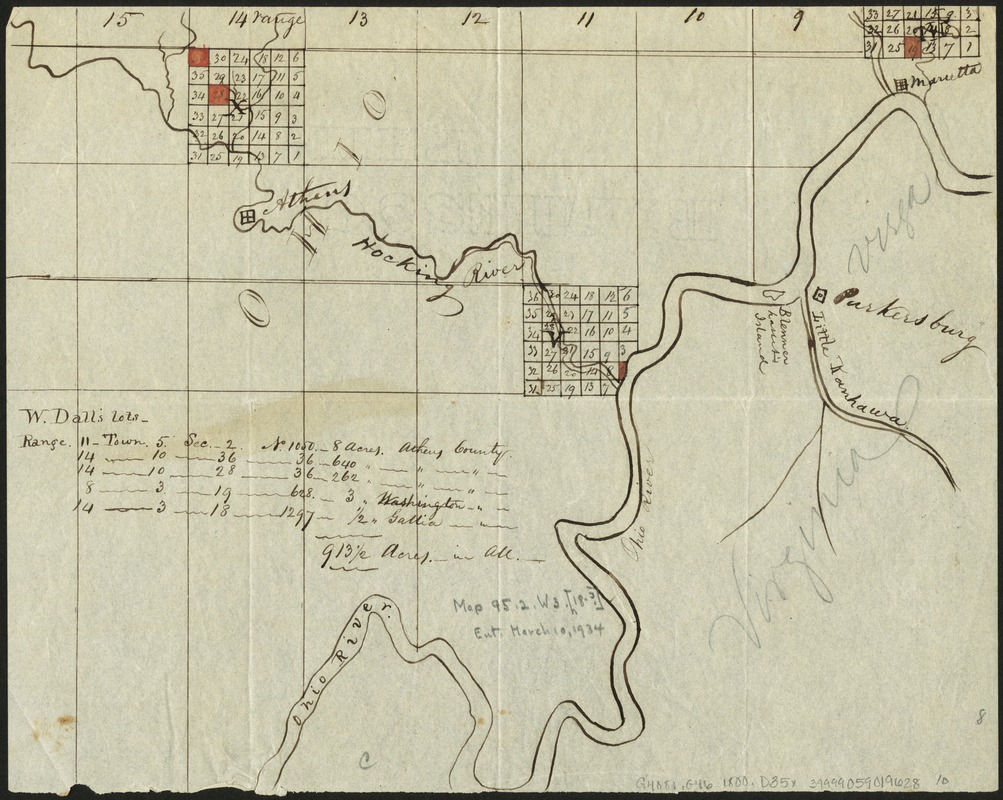
William Dall (fl. 1800)
“Map of W. Dall's Lots in
Athens County, Washington County, and Gallia County,
Ohio”
1800. Manuscript map, 8 x 10 inches. Leventhal
Map and Education Center.
This small manuscript map served as a personal record of one
individual’s land holdings. It highlights the grid pattern
that was characteristic of public land surveys initiated by
the Land Ordinance of 1785. These townships were part of the
Ohio Company’s purchases in southeastern Ohio. This private
land company, composed of Boston investors, established
Marietta as the first Euro-American settlement in the
Northwest Territory. The map noted that William Dall owned
five parcels of land in four townships, totaling over 900
acres.
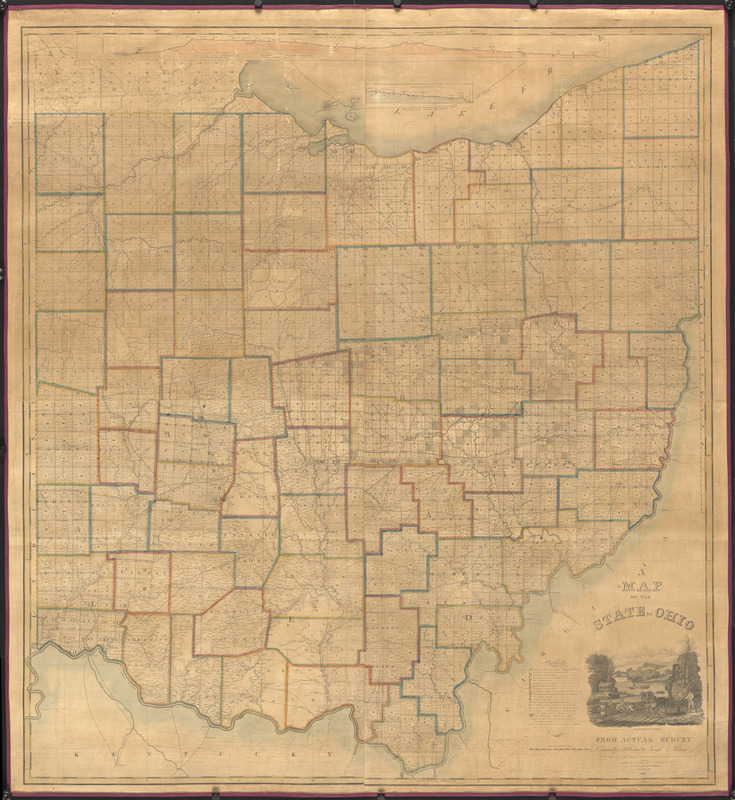
William Woodruff (fl. 1817–1833), after Alexander Bourne
(1786–1849) and Benjamin Hough
“A Map of the State of
Ohio from Actual Survey”
Cincinnati, 1831. Printed map,
51 x 48 inches. Courtesy of Lawrence Caldwell.
Ohio, the 17th state, was the first carved out of the
Northwest Territory. Survey grid patterns based on 5- and
6-mile square townships were first implemented here, in
addition to traditional irregular metes and bounds surveys in
the Virginia Military District. To administer surveying and
sales, over a dozen private land companies, military land
districts, and congressionally-authorized districts were
created. By 1832 when this large wall map was updated,
surveying had been completed. County boundaries and township
perimeters are marked. The cartouche promotes agriculture and
river transportation with a scene of a farm overlooking the
Ohio River.
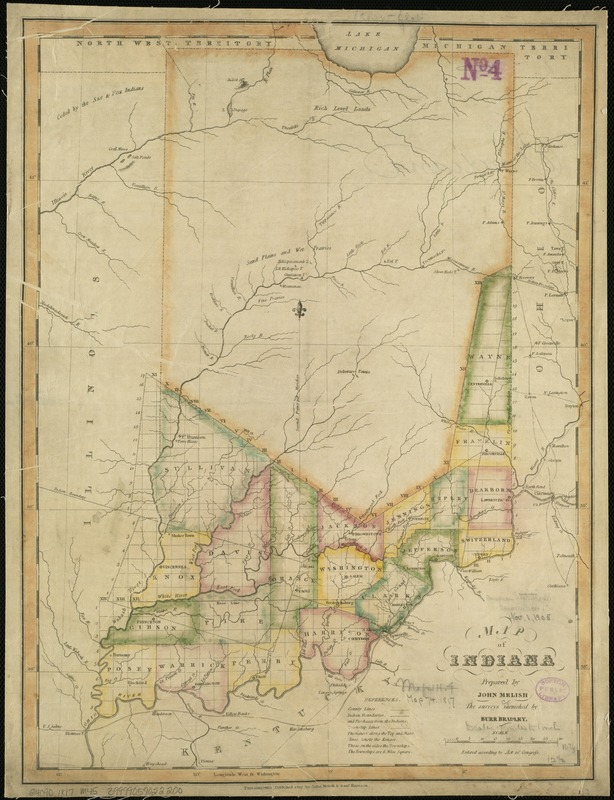
John Melish (1771–1822) and Burr Bradley
“Map of
Indiana”
Philadelphia, 1817. Printed map, 18 x 13.5
inches. Leventhal Map and Education Center.
Indiana Territory (“Land of Indians”) was similarly carved out
of the Northwest Territory in 1800. Published in 1817, a year
after Indiana’s statehood, this map indicates that officials
had divided the southern third of the state into counties and
townships. Numerous tribal nations, including the Myaamiaki
(Miami), Kiikaapoi (Kickapoo), Lenape (Delaware), Shawnee, and
Neshnabé (Potawatomi) inhabited the region. The map identifies
land cessions before 1817 with dashed lines. From the 1820s
through the 1840s these tribal communities were forcibly
relocated, most often to reservations in the Great Plains or
to Canada.
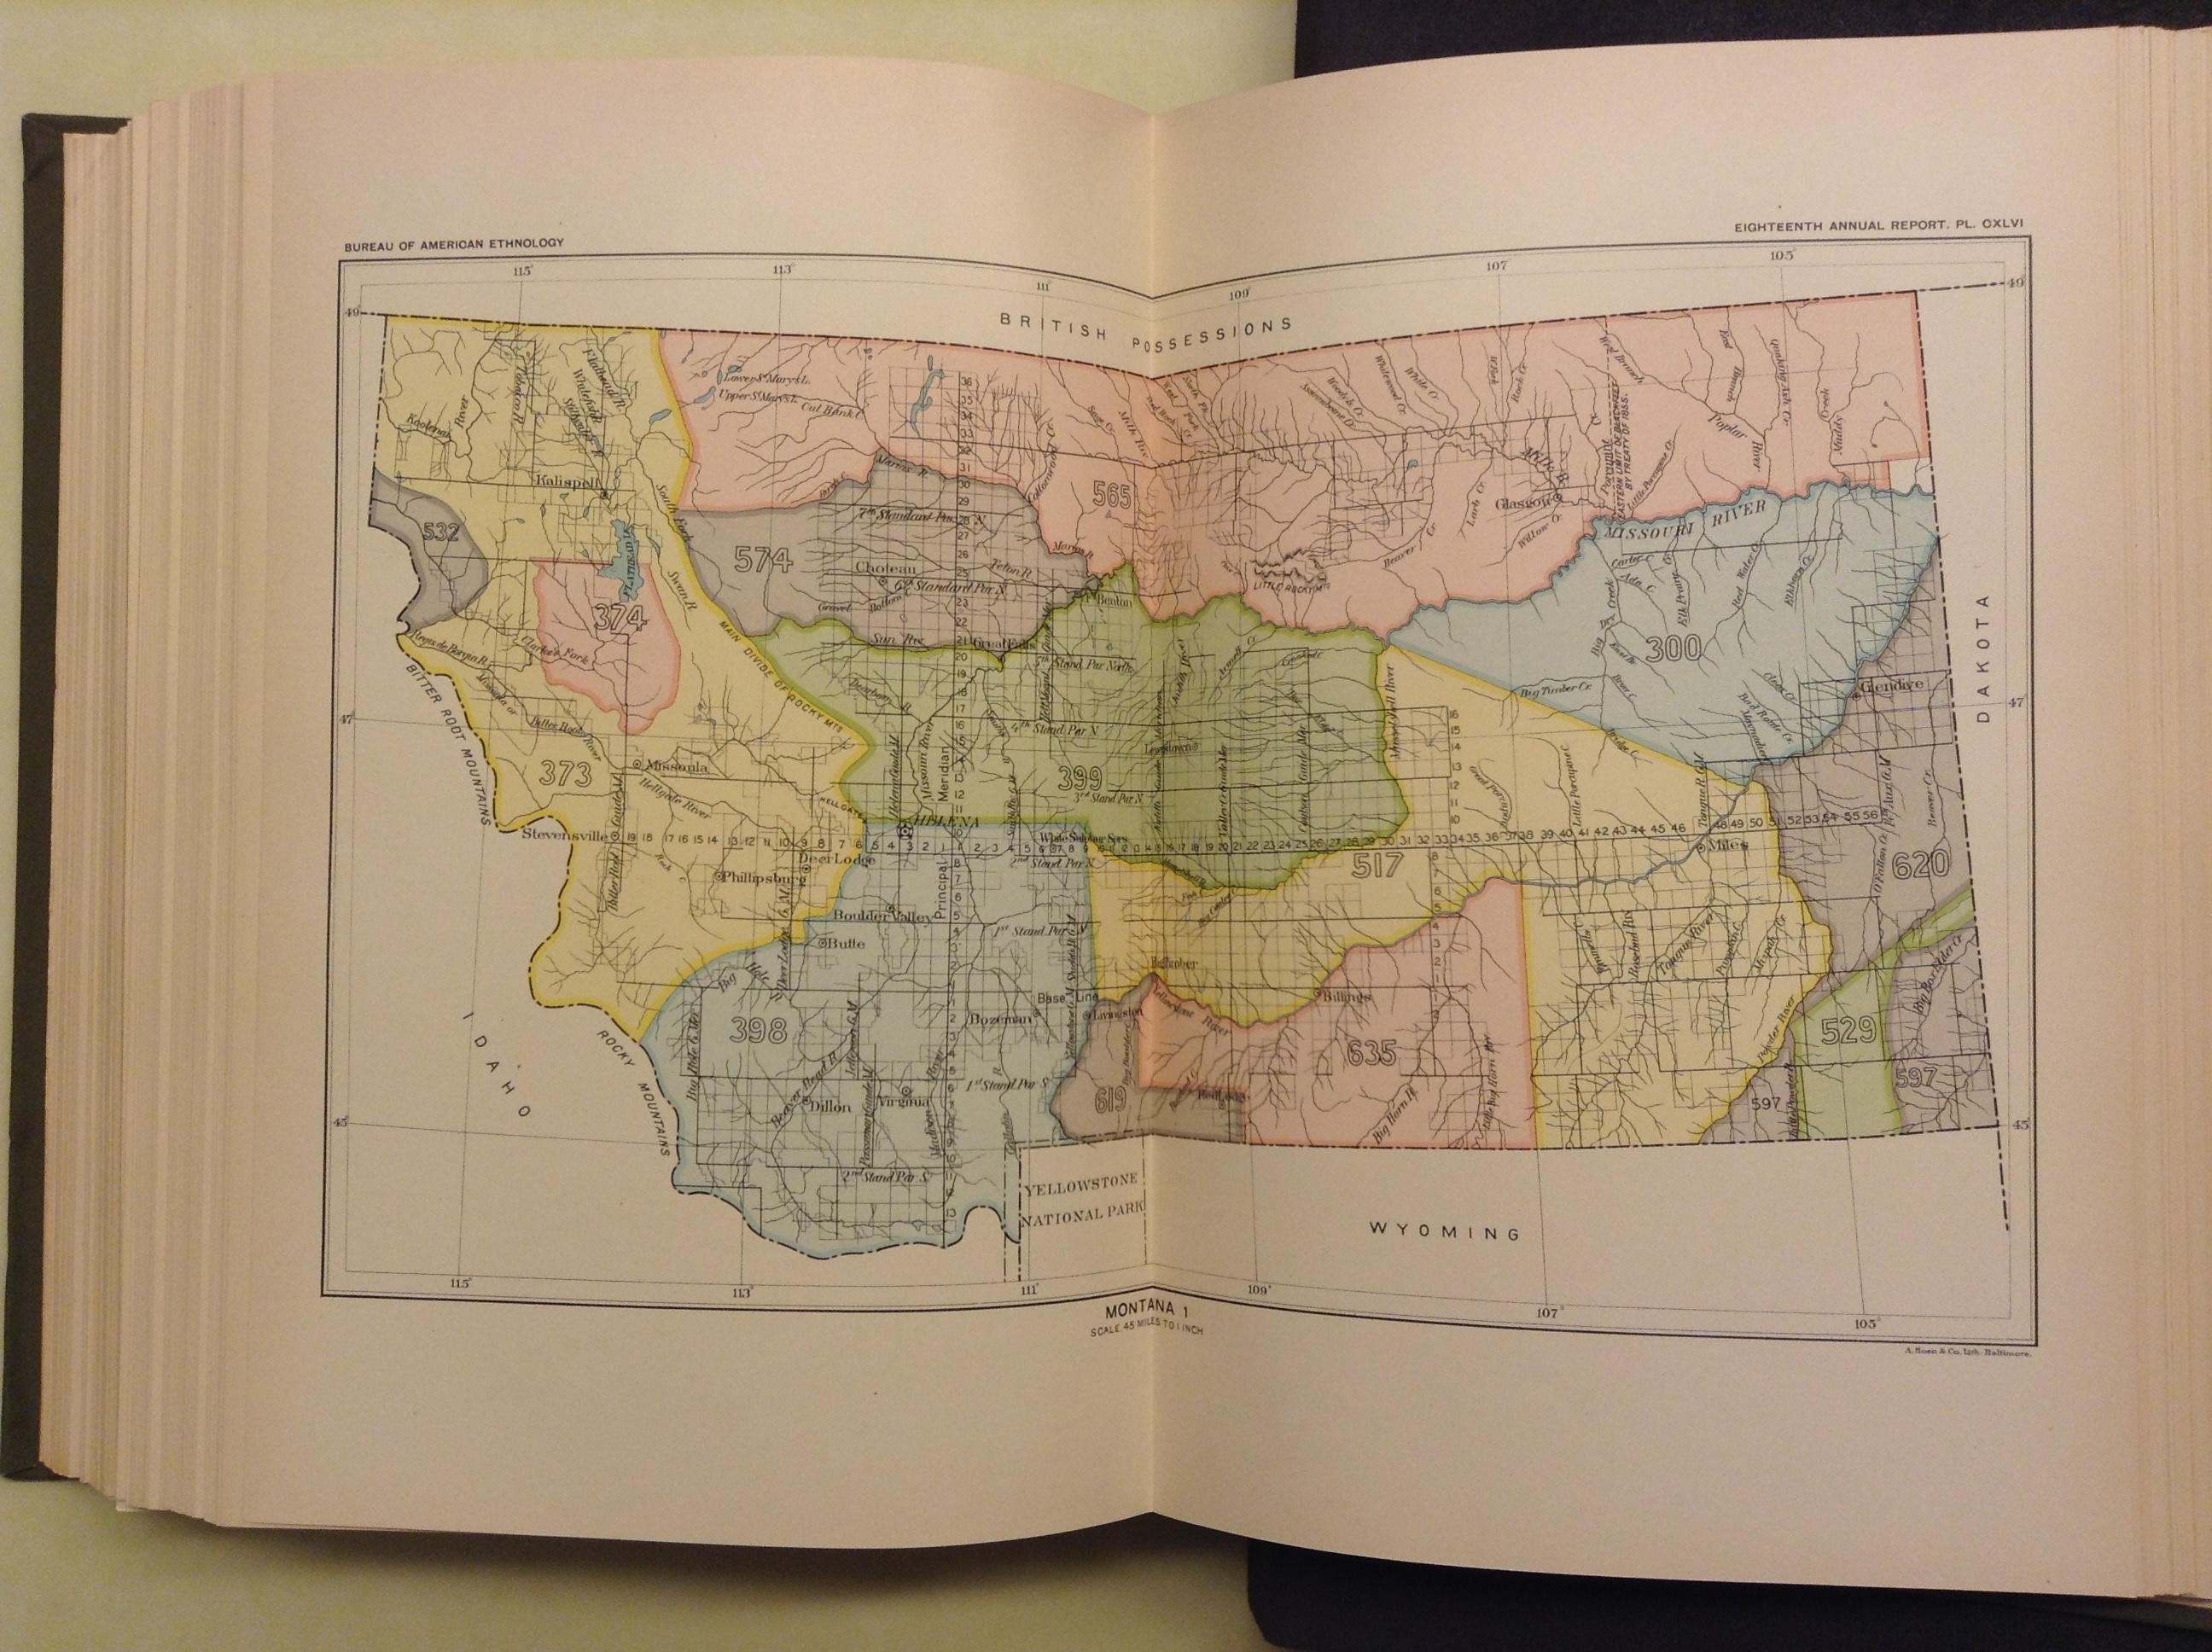
Charles C. Royce (1845–1923)
“Montana 1,” from “Indian
Land Cessions in the United States, 1784-1984”
Washington,
DC, 1899. Printed map, 11.5 x 14.5 inches. Courtesy of
Ronald Grim.
By the 1890s, the U.S. government seized over 1.5 billion
acres of Native land by way of treaty, coercion, military
force, and executive order. Tables in this compendium itemize
over 700 land cessions and treaties enacted between 1784 and
1894, while 67 maps delineate the boundaries of each
transaction. For example, the yellow and pink districts in
western Montana (numbered 373 and 374) refer to the 1855
Treaty of Hellgate, negotiated with the Séliš (Flathead),
Kootenai (Kootenay), and Q'Lispé (Upper Pend d’Orielles).
Through a contentious negotiation process mired in
mistranslation and differing expectations, the tribes ceded
their lands and became dissatisfied with enforcement of the
treaties. Hostilities broke out in 1858.
VIEWPOINT: “Cede” is a very gentle term to describe a deeply violent, forced, and uneasy process. As Native groups suffered losses from epidemics and the destruction of their food sources, they relinquished their lands to the U.S. government, often as a final resort. Native groups were forced to relocate from their homelands, either by treaty or executive orders promising them abundant resources in exchange for territory – none of which were fully realized.
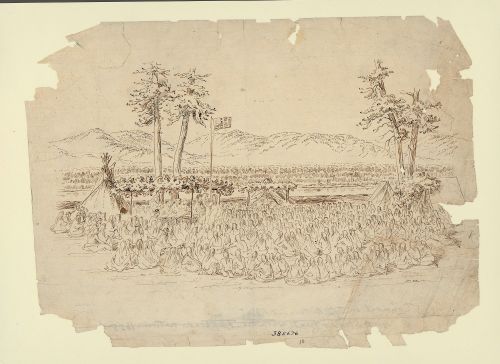
Gustavus Sohon (1825–1903)
“Feast for the Indian
Council”
1853. Manuscript pencil drawing, 8 x 10
inches. Courtesy of
Smithsonian Institution National Anthropological
Archives. Reproduction, 2019.
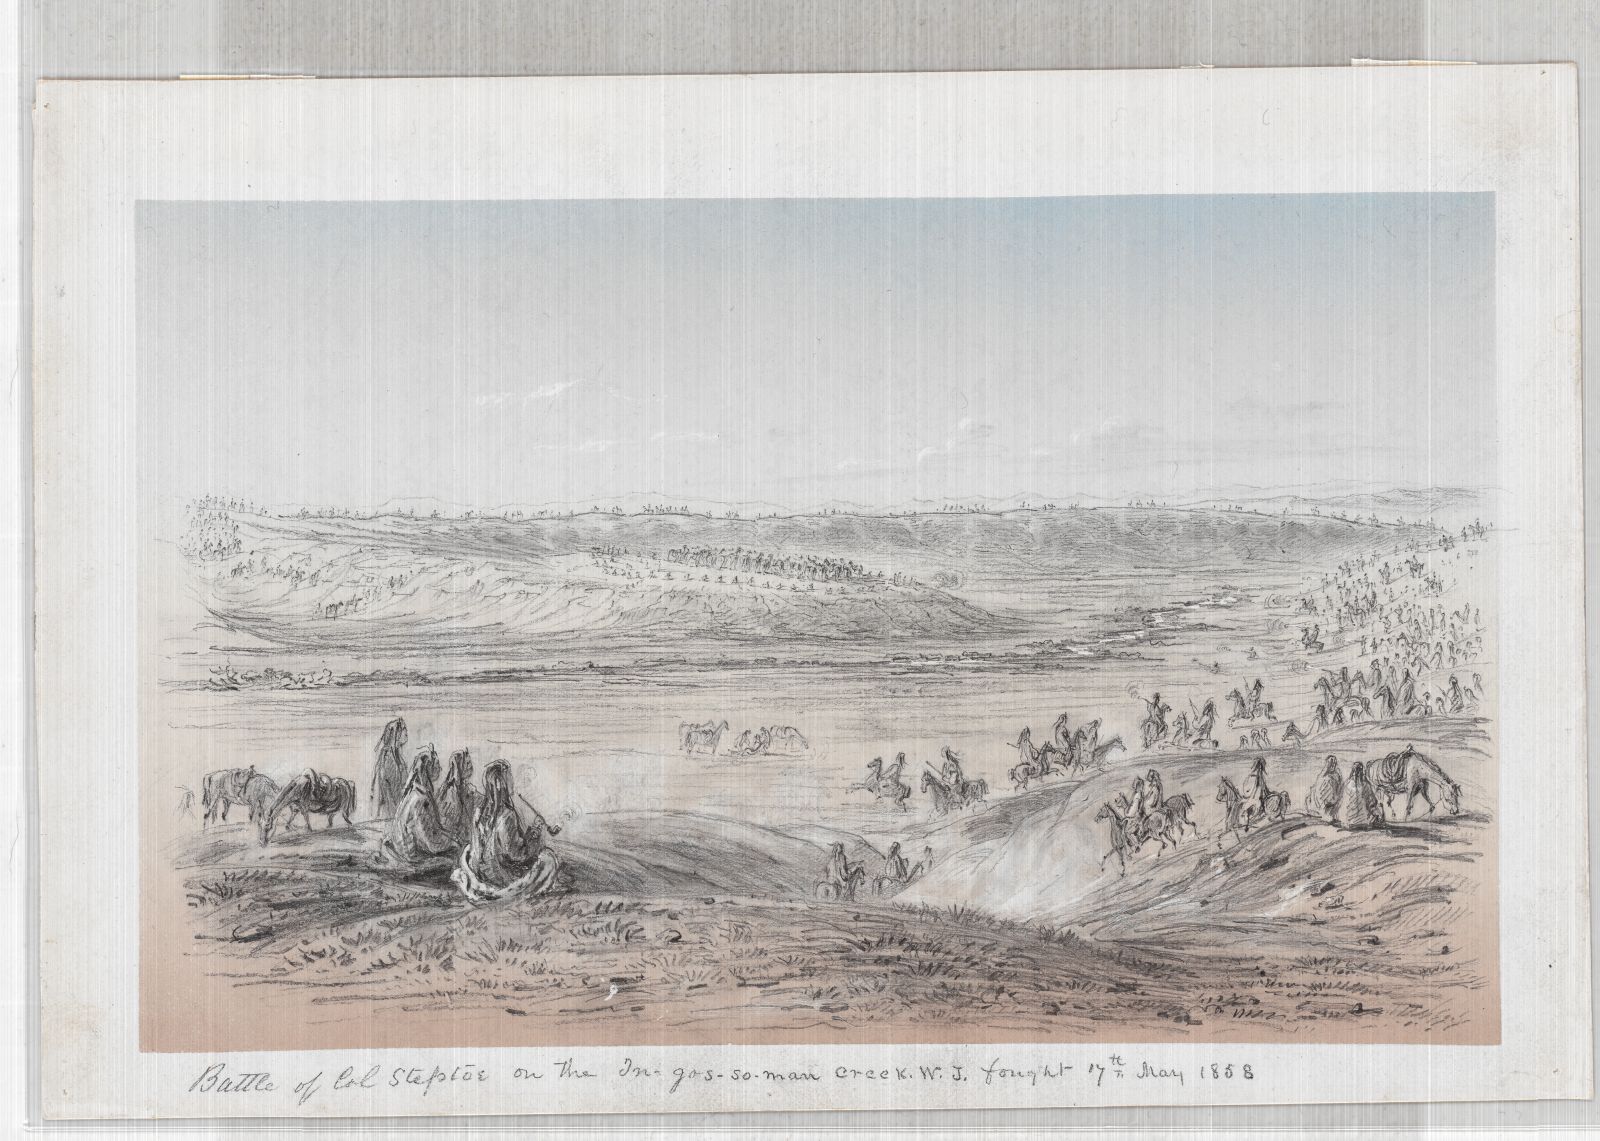
Gustavus Sohon (1825–1903)
“Battle of Col. Steptoe on the In-gos-so-man Creek,
W.T., Fought 17th May 1858”
1858. Manuscript pencil drawing, 6.75 x 10 inches.
Courtesy of
Library of Congress Prints and Photographs
Division,
LOT 2528 (F) [P&P]. Reproduction, 2019.
Isaac Stevens, leader of the Northern Pacific Railroad Survey
and Washington’s territorial governor, negotiated several
treaties during the 1850s to help justify the construction of
a northern railroad route and to entice Americans to move to
the Pacific Northwest. Two pencil sketches, prepared by
Gustavus Sohon, a German immigrant who served as an artist and
interpreter with Stevens, depict scenes from this period. In
1855, he produced this pencil drawing documenting Stevens’
negotiation with the Flathead Treaty Council. In 1858, he
accompanied the campaign against the Spokane, Schitsu'umsh
(Coeur d'Alene), and Palouse. His second drawing records the
defeat of U.S. Army troops by a combined force of several
Native groups.
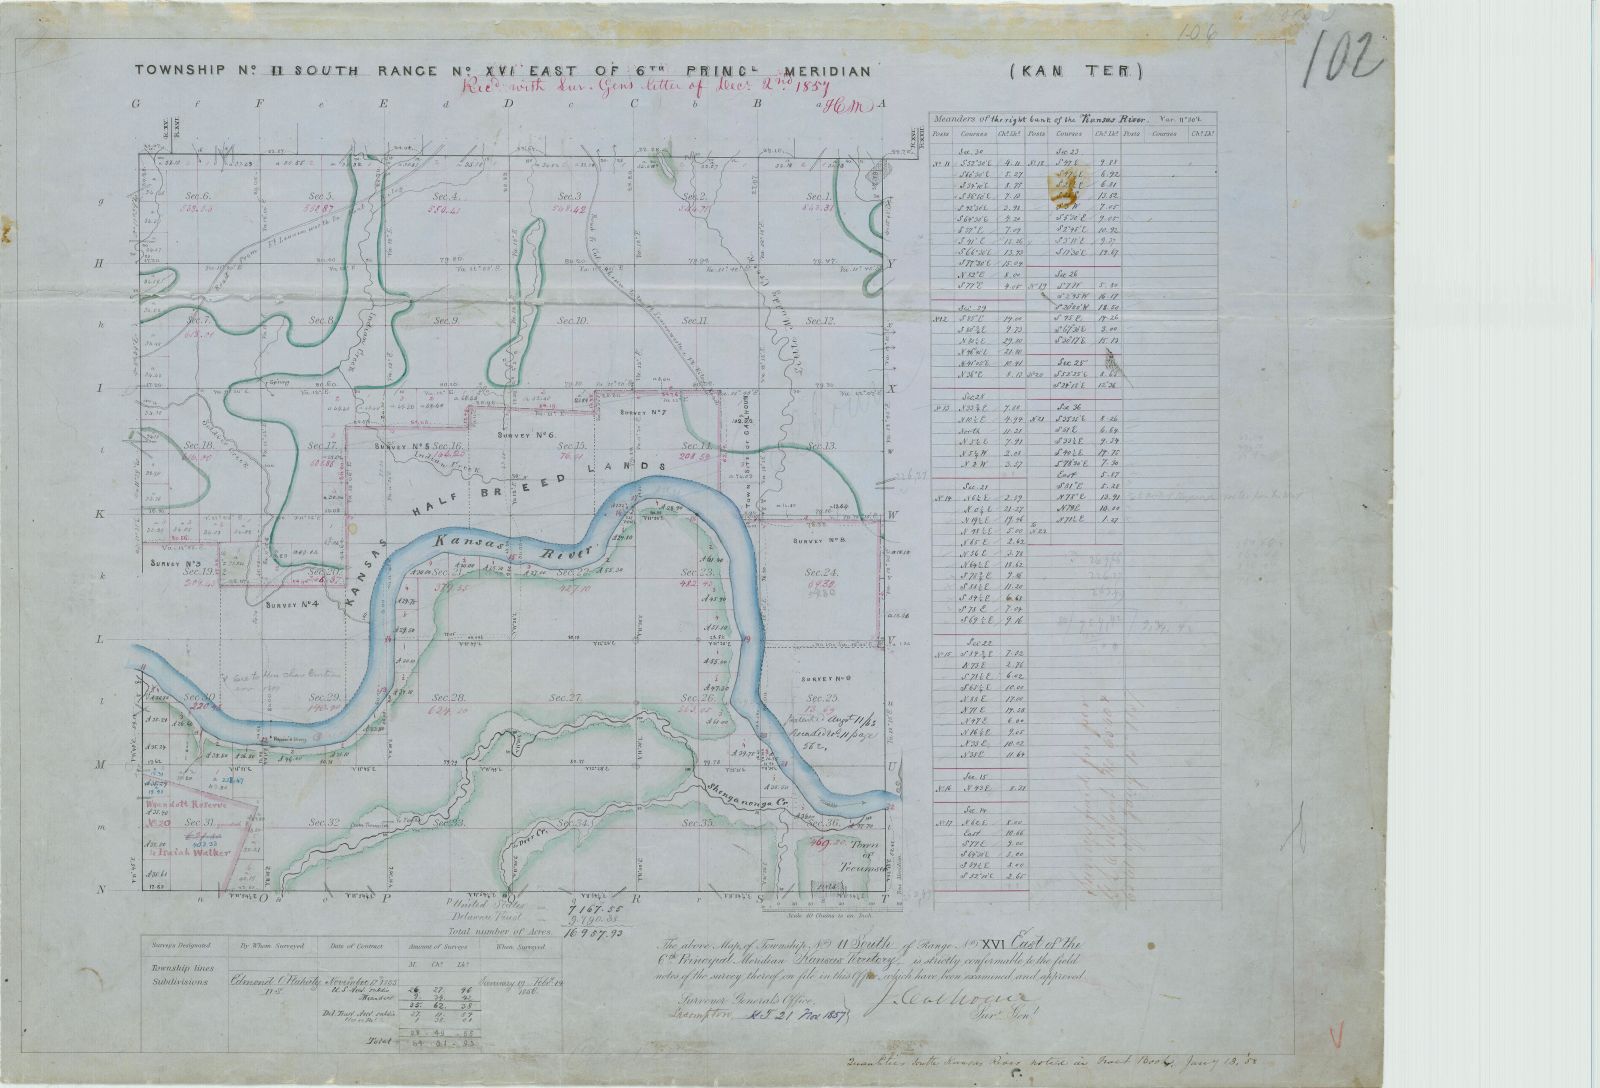
John Calhoun (1806–1859)
“Township no. 11 South, Range
no. XVI East of 6th Princl. Meridian”
1857. Manuscript
survey plat, 17 x 22 inches. Courtesy of
National Archives and Records Administration,
Record Group 49, Kansas Headquarter Plats. Reproduction, 2019.
The General Land Office produced manuscript survey plats for
each individual township. Their primary purpose was to outline
the boundaries of the six-mile square township and each of the
36 sections. Surveyors often noted natural and man-made
features that crossed or were near the surveyed lines. In this
Kansas example, the Kansas River and tributary streams
dominated the landscape. Green lines marked the boundary
between woodland and prairie, while existing roads,
farmsteads, and town sites were also mapped. One unusual
feature is seven 640-acre tracts, identified as Kansas
half-breed lands, which were allotted to individuals of mixed
Kaw (Kanza) and European ancestry.
VIEWPOINT: Full breed lands did not exist because full breeds were not considered human enough to be land owners. Half breeds, or mixed race Natives were considered to be partially human and able to own land, while Natives with no European ancestry were less than human, not worthy of land possession.
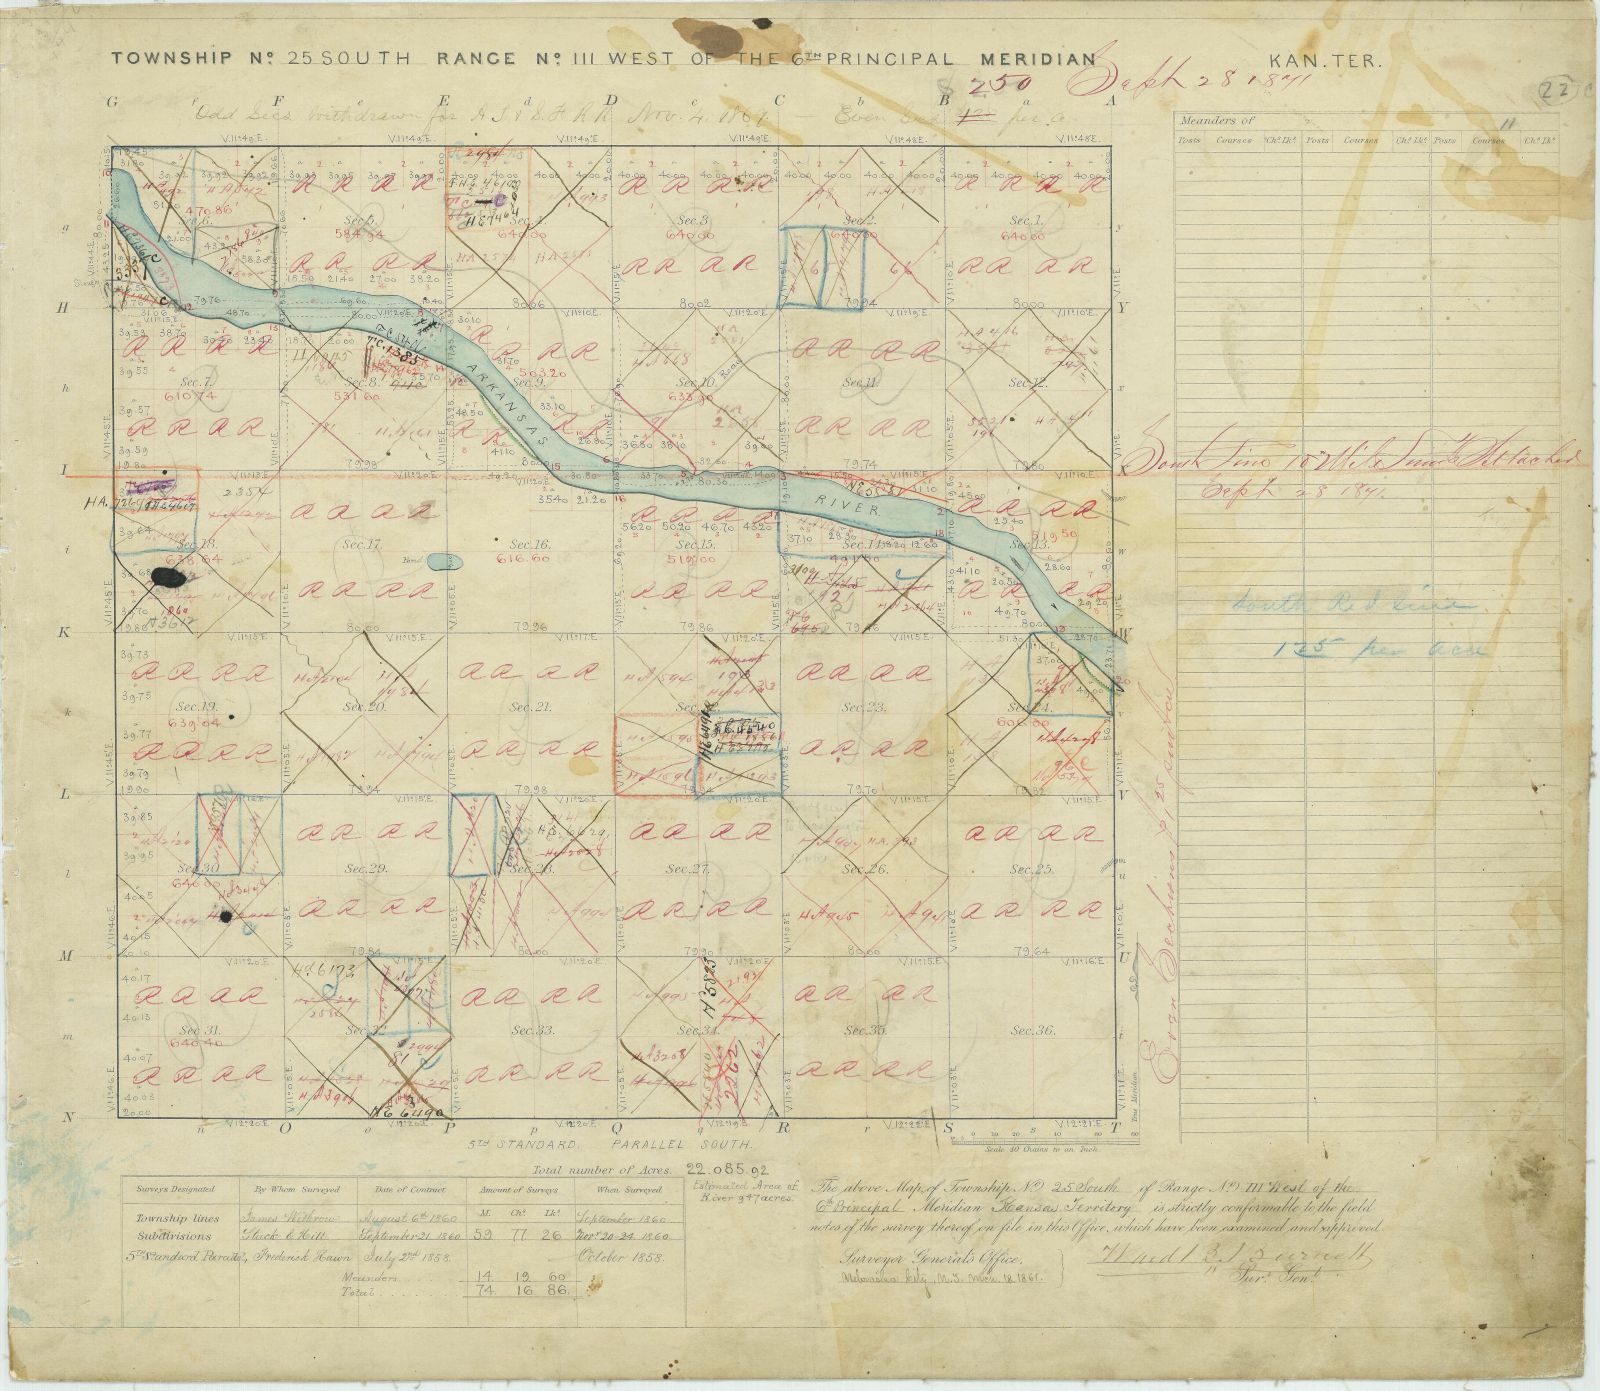
Ward Burnett (1811–1884)
“Township no. 25 South, Range
no. III West of the 6th Principal Meridian”
1861, with
later annotations. Manuscript survey plat, 16.5 x 19 inches.
Courtesy of the
National Archives and Records Administration,
Record Group 49, Kansas Local Office Plats. Reproduction, 2019.
The Homestead and Pacific Railroad Acts, both passed in 1862,
dramatically changed the process for granting public lands.
The former allotted 160 acres to white settlers, as well as
freed men and women, who would improve land within five years
of selection. The latter authorized construction of the first
transcontinental railroad and established the principle of
giving alternating sections (640 acres) to railroad companies.
For example, this township was surveyed in the late 1850s, but
most of the land was not selected until the 1870s. Alternating
sections marked with “RR” were granted to a railroad company,
while those sections patented through the homesteading process
are indicated by an X.
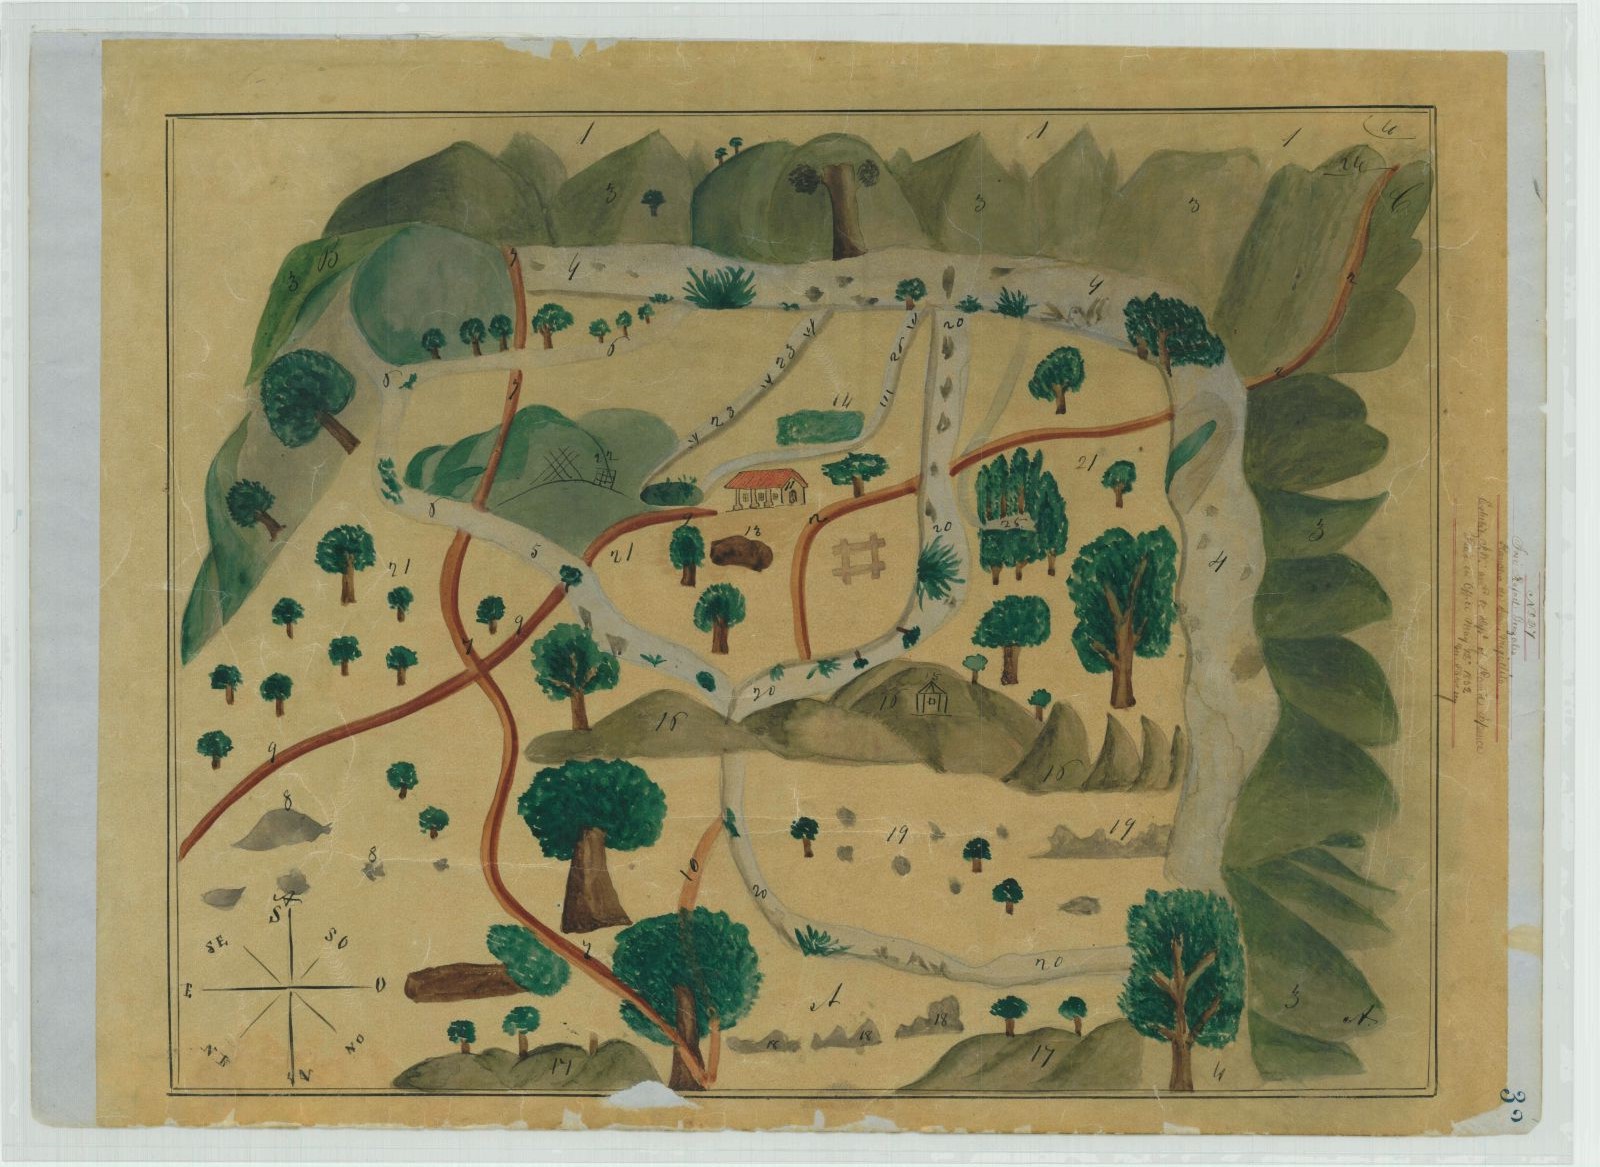
José Rafael Gonzales (fl. 1852)
“Diseño for Rancho San
Miguelito”
1852. Manuscript drawing, 12 x 17 inches.
Courtesy of National Archives and Records Administration,
Record Group 49, California Private Land Claims, Diseños. Reproduction,
2019.
The 1848 Treaty of Guadalupe Hidalgo ended the
Mexican-American War and ceded much of this southwestern
territory to the United States. The federal government agreed
to honor Spanish and Mexican land grants. Claimants in
California had to submit a documentary case file
(expediente) with a description and map (diseño)
of the tract. Displayed here is a diseño for more than 22,000
acres granted by the Mexican governor in 1841 and finally
approved by the U.S. government in 1867.
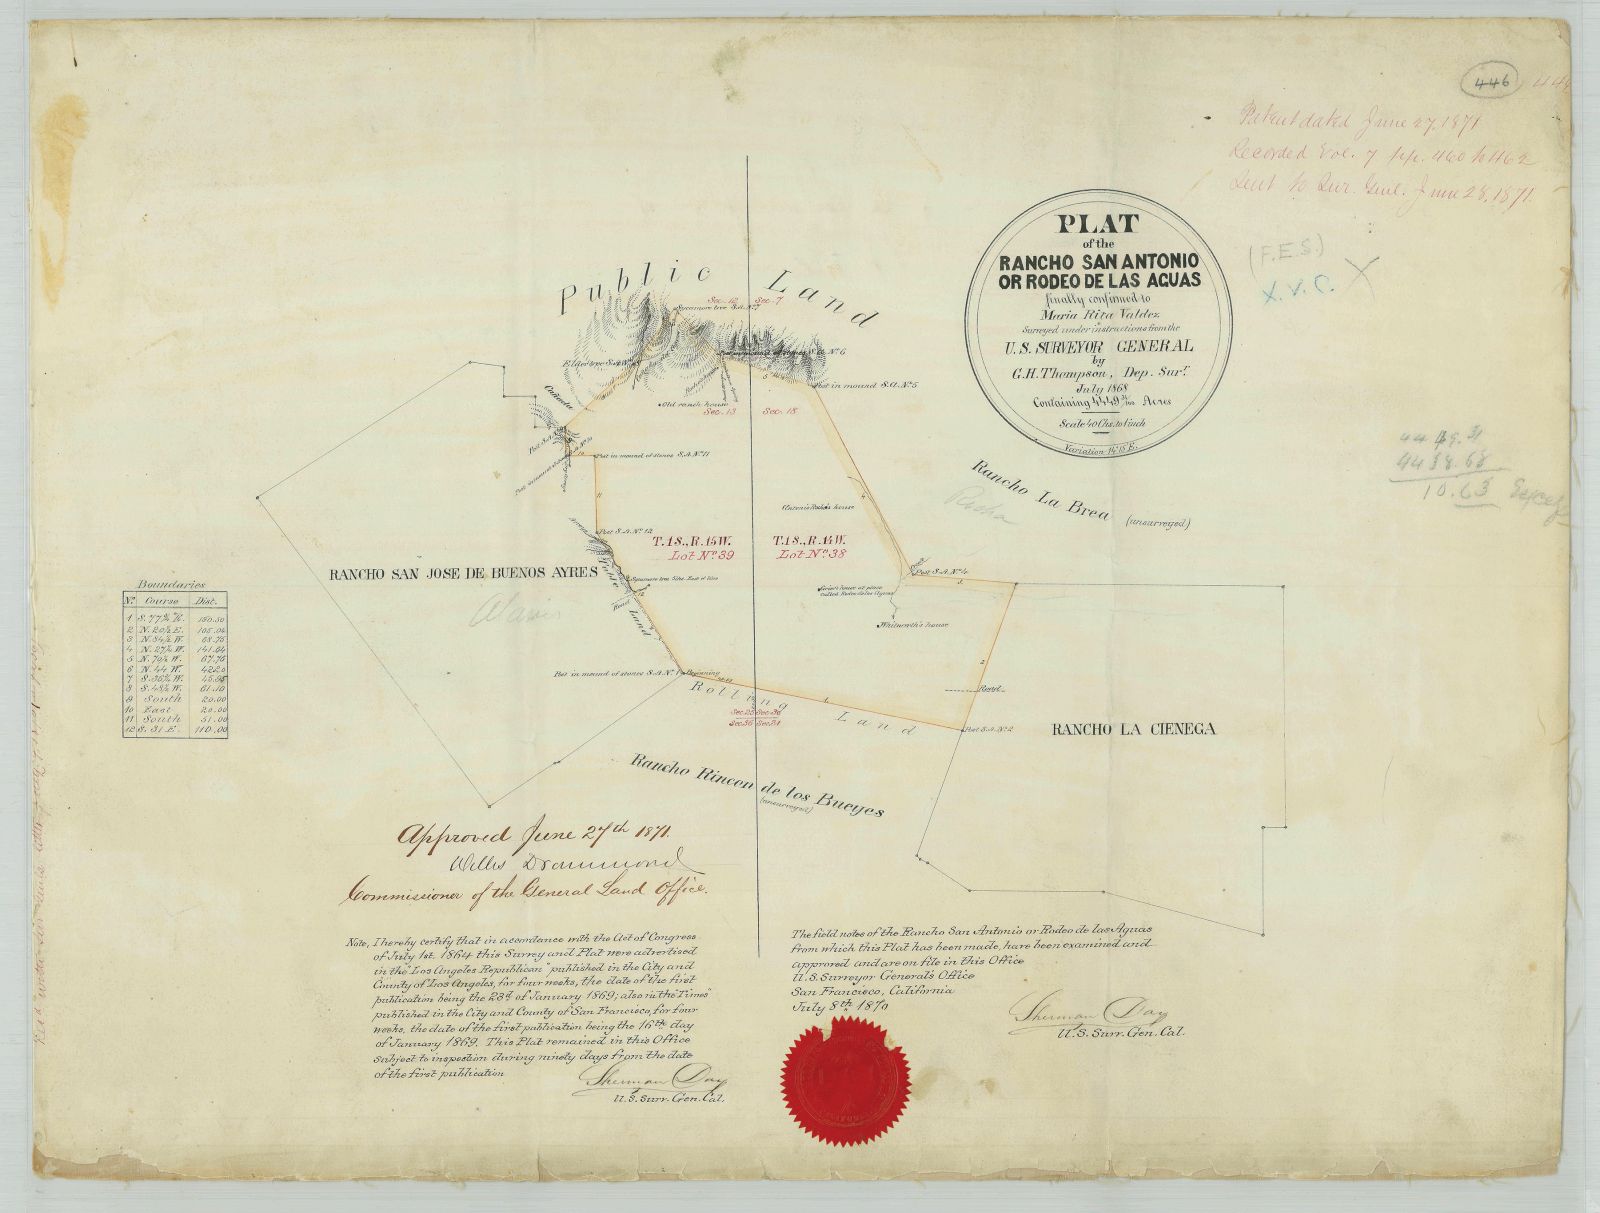
George H. Thompson (fl. 1870)
“Plat of the Rancho San
Antonio or Rodeo de las Aguas, Finally Confirmed to Maria
Rita Valdez”
1870. Manuscript survey plat, 19 x 25.5
inches. Courtesy of National Archives and Records Administration,
Record Group 49, California Private Land Claims, Survey Plats.
Reproduction, 2019.
In California, Spanish settlements extended along the California coast from San Diego to San Francisco. Over 800 private land claims required adjudication, reflecting a variety of settlements identified as presidios (forts), pueblos (towns), missions, and ranchos. The latter were large land holdings that ranged from 4,000 to 40,000 acres and rarely had precise boundaries. Displayed here is the final survey for Rancho Rodeo de las Aguas, originally granted in 1838 to Maria Rita Valdez, a granddaughter of one of the original settlers of Los Angeles. The grant was finally surveyed and approved by the General Land Office in 1871, although she sold the property in 1854.
1b. LAND 1862-1900: Surveying and Conserving the Land
In the late eighteenth century, government explorers and surveyors initiated the settler-colonial process of westward expansion. In the 1780s, Congress passed the Northwest Ordinance to establish the process for admitting new states. The laws also outlined the principles for surveying and selling public lands that the United States had gained through purchase, trickery and obfuscation, warfare and other forms of violence, forced removal, and treaty. Surveyors standardized the practice of dividing land into six-mile square townships that provided the foundation for settlement patterns in western states. Government surveys noted the land claims of earlier French and Spanish inhabitants and aimed to prove the cession of lands occupied by Native tribes.
From 1803 to 1805, Meriwether Lewis and William Clark set out to inventory and map the newly acquired Louisiana Purchase. Their trip paved the way for similar expeditions and culminated in the 1850s with the Pacific Railroad Surveys, which mapped potential routes for the first Transcontinental Railroad. Each of these efforts brought back cartographic and scientific data about the inhabitants, landscape, natural resources, and wildlife. By the final third of the century, many Americans had become concerned about conserving these natural resources and landscapes that were rapidly disappearing through economic exploitation.
For Kids
After the Civil War, large numbers of
Americans raced west in search of land and riches. Native
nations and parts of the natural world, like forests and
bison, suffered great losses as a result. Trees became lumber
and the search for fossil fuels and precious metals scarred
the land. At the same time, some Americans supported the idea
of National Parks to preserve the West’s most dramatic
landscapes.
- Can you find maps and images in this section that tell a story about what was gained as Americans expanded across North America?
- Can you find maps and images that tell a story about what was lost?
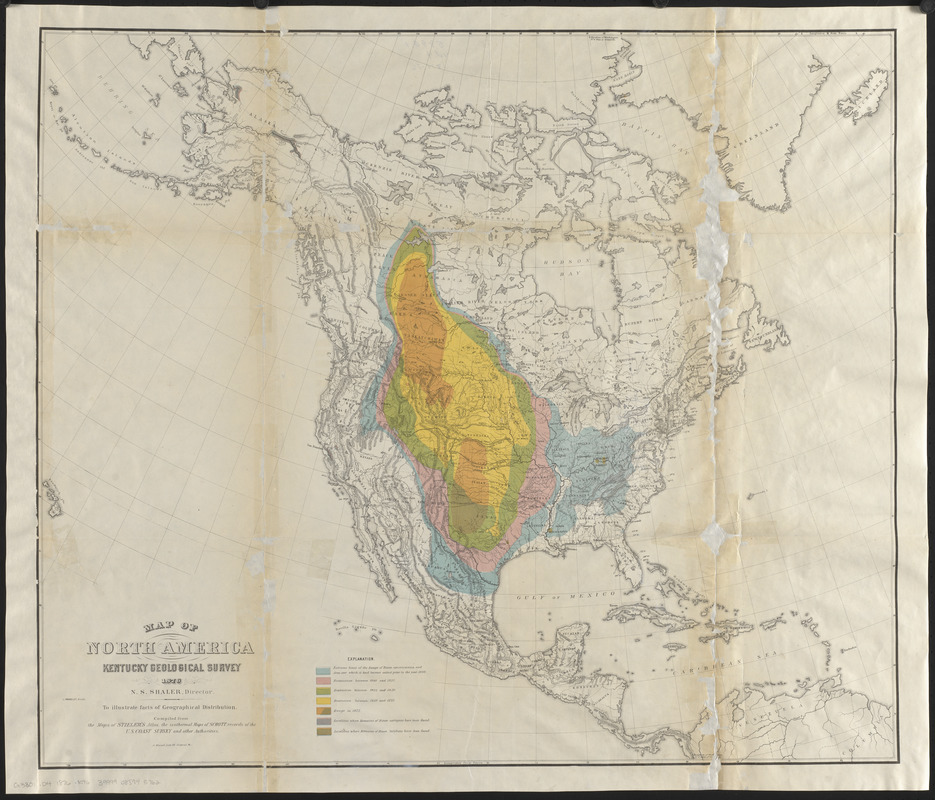
Joel A. Allen (1838-1921)
“Map of North America,”
from The American Bisons, Living and Extinct
Cambridge, MA, 1876. Printed map, 29.5 x 25 inches.
Leventhal Map and Education Center. Reproduction 2019.
This colorful map documents the diminishing range of bison
during the 18th and 19th centuries. It accompanied an 1876
report prepared by Joel Allen, an American zoologist,
mammalogist and ornithologist at Harvard’s Museum of
Comparative Zoology. The map shows the distribution of bison
before 1800 (blue), 1825 (pink), 1850 (green), 1875 (yellow)
and afterwards (orange). To emphasize the influence of
migration and railroad construction on bison, the map also
delineates the routes of the Emigrant Trail, the Union Pacific
Railroad, and other railroads in Kansas and Colorado.
Viewpoint: This map only shows trail and railroad construction, but those were not the major reasons for the demise of bison in the 19th century. Bison leather was in high demand — it was used by the government to make Army boots, and bison-leather belts powered the machines that created the industrial revolution. The leftover bones were shipped east by the new railroads in massive amounts to be made into china. The demise of bison led to forced land cessions by Native people as many tribes lost their food supply and trusted the treaties' false promises of food and supplies.
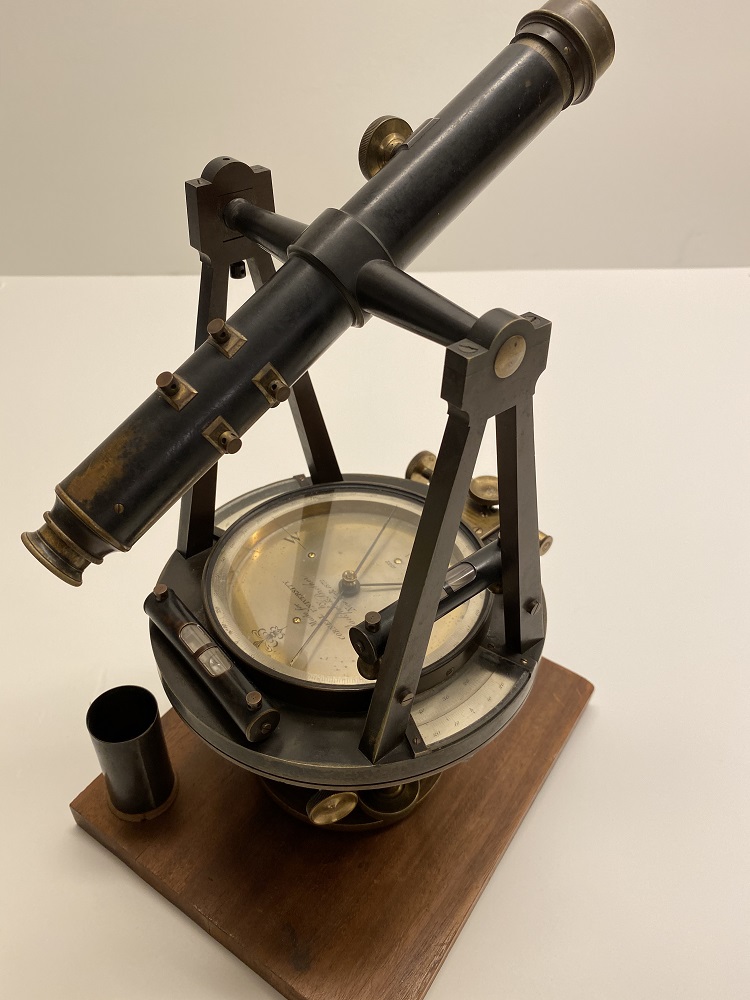
Stackpole & Brother [manufacturer]
Surveyor’s
transit, serial number 1332
New York, 1872. Gift
of Cornell University School of Civil and Environmental
Engineering.

Buff & Buff Manufacturing Co. [manufacturer]
Surveyor’s
Level
Boston. Gift of Cornell University School of Civil and Environmental
Engineering.
Surveyor’s instruments, rather than guns, were possibly the
most influential weapons used in the European conquest and
colonization of the American landscape. These tools were used
to establish administrative boundaries, delineate property
lines, lay out towns, determine transportation routes, and map
topography. This transit, which measures horizontal angles to
a highly precise degree of accuracy, was used in the
engineering school at Cornell University, New York’s “land
grant” college established under the terms of the 1862 Morrill
Act, which granted federal land to each state to establish
agricultural and scientific universities. Surveying was a
practical course for the civil engineers who would go on to
map the nation and build its infrastructure.
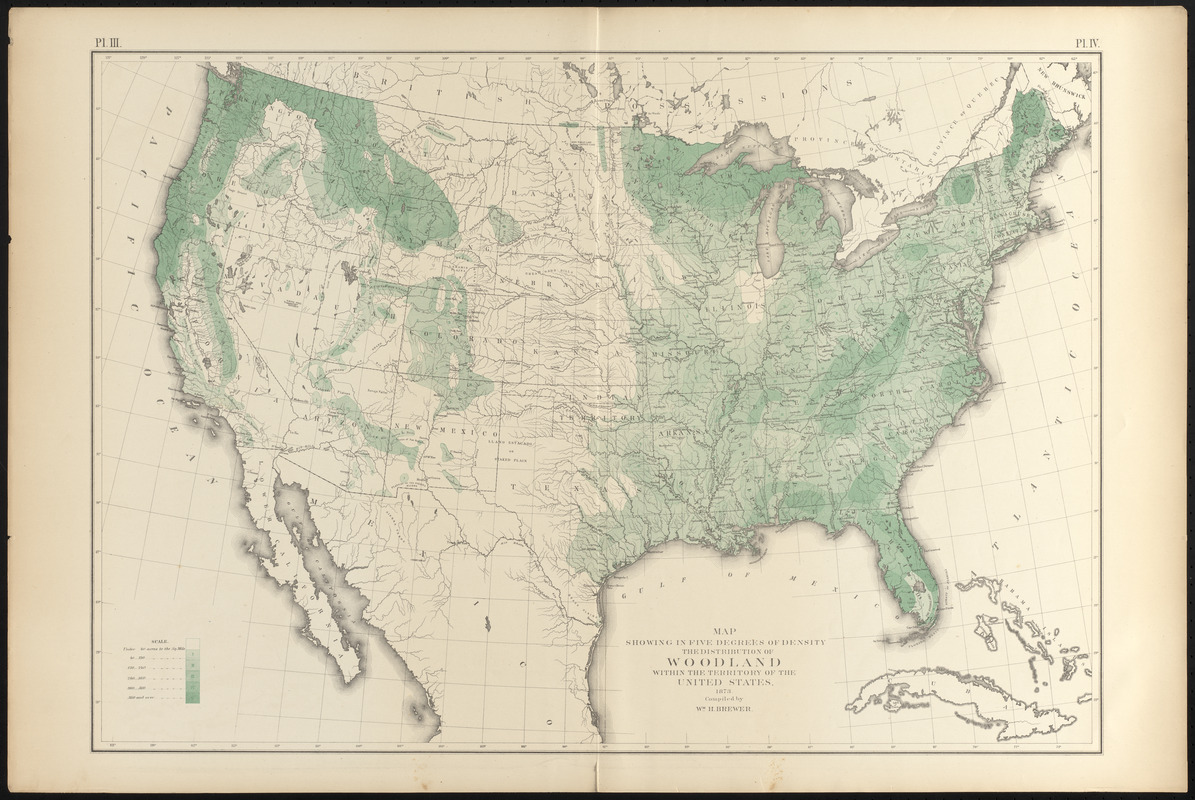
William H. Brewer (1828-1910)
"Map Showing in Five
Degrees of Density the Distribution of Woodland within the
Territory of the United States, 1873." in
Statistical Atlas of the United States …
Washington, D.C., 1874. Printed map, 22 x 33 inches.
Leventhal Map and Education Center.
Reflecting growing concerns for the nation’s diminishing
natural resources as a result of individual ownership and
overconsumption during the first half of the 19th century,
this statistical map depicts forest density at the time of the
1870 census. The most extensive woodlands were in the East,
along the northern Pacific Coast, and in the northern Rocky
Mountains. Outside these forested areas were the grasslands of
the Great Plains and the semi-arid scrub lands of the
Southwest. Much of the East, which was originally very heavily
forested, had less than 20-35 percent of the acreage in
woodland after extensive deforestation.
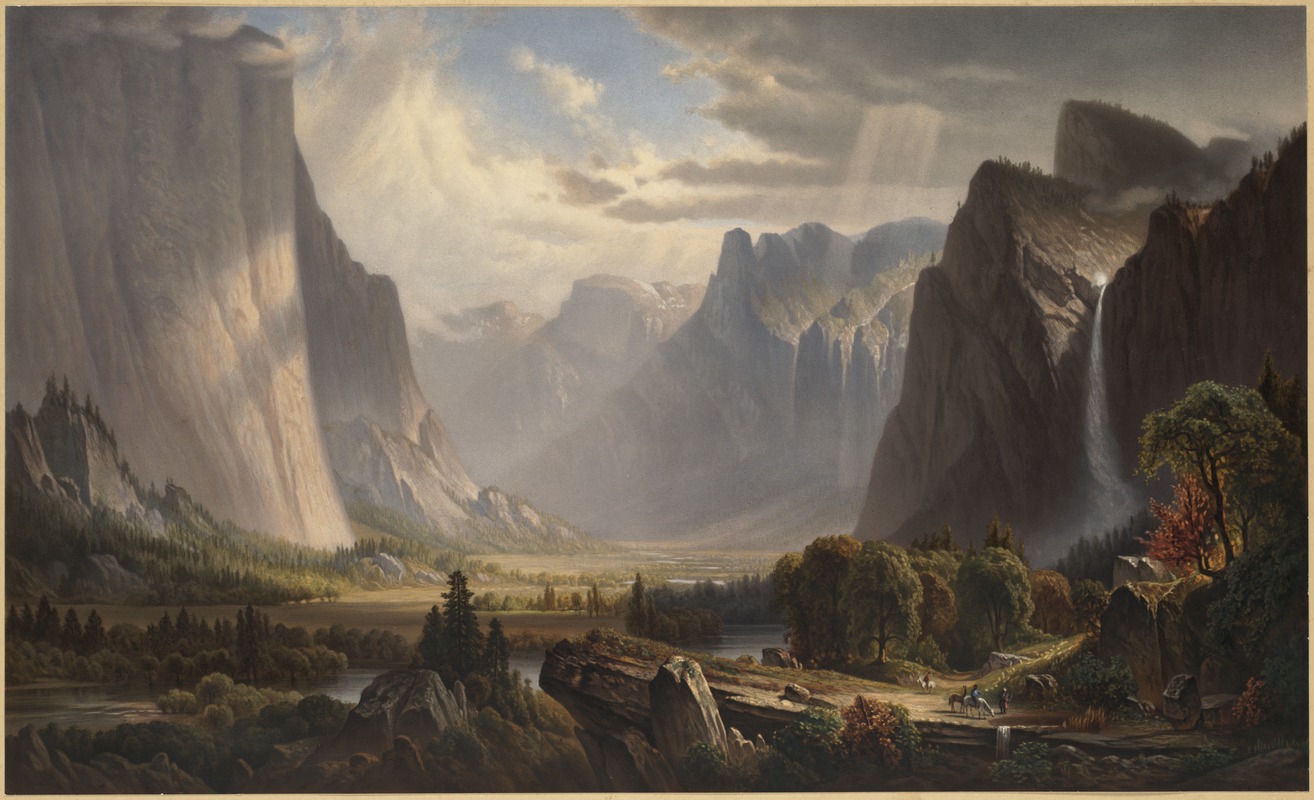
Thomas Hill (1829-1908)
Yosemite Valley
Boston: Louis Prang and Co., 1861-1897.
Chromolithograph. Courtesy of the Boston Public Library, Print Department. Reproduction 2019.
This chromolithographic print of Yosemite Valley not only
provides an example of the remaining forests found in the
Rocky and Pacific Coast mountains, but it also captures the
drama of Western landscapes. Light shines onto a fertile
valley framed by sheer mountain cliffs accentuated by a
waterfall. Louis Prang, who immigrated to Boston from Prussia,
published such popular, colorful prints, which reinforced the
idea that the West was a largely uninhabited, wild, unique
landscape.
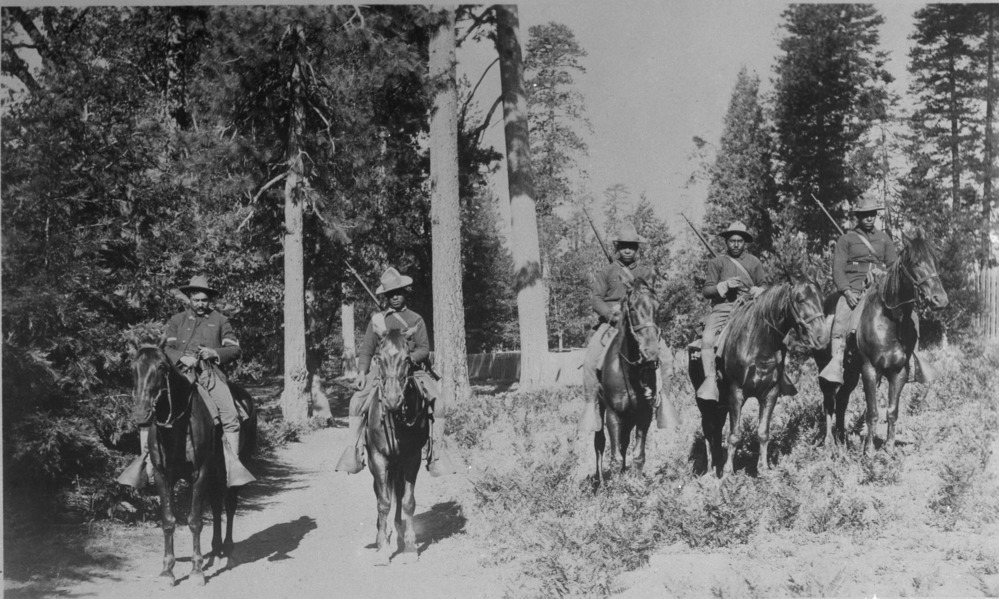
Negro Troopers of 1899 [Buffalo Soldiers] [24th
Infantry].
Film, 5 x 7 inches. Courtesy of
U.S. National Park Service. Reproduction 2019.
At the end of the Civil War, black troops enlisted into U.S.
forces, both former Union soldiers and new recruits. Known as
buffalo soldiers and consolidated into two cavalry and two
infantry regiments, these men fought against Native people and
the Mexican resistance as they provided security to settlers
moving westward. They also participated in the U.S. war
against Spain in Cuba and against Spain and the Filipino
resistance in the Philippines. Starting in 1899, soldiers of
the 9th Cavalry and 24th Infantry spent summers as the first
park rangers in two of the nation’s earliest national parks,
Yosemite and Sequoia.
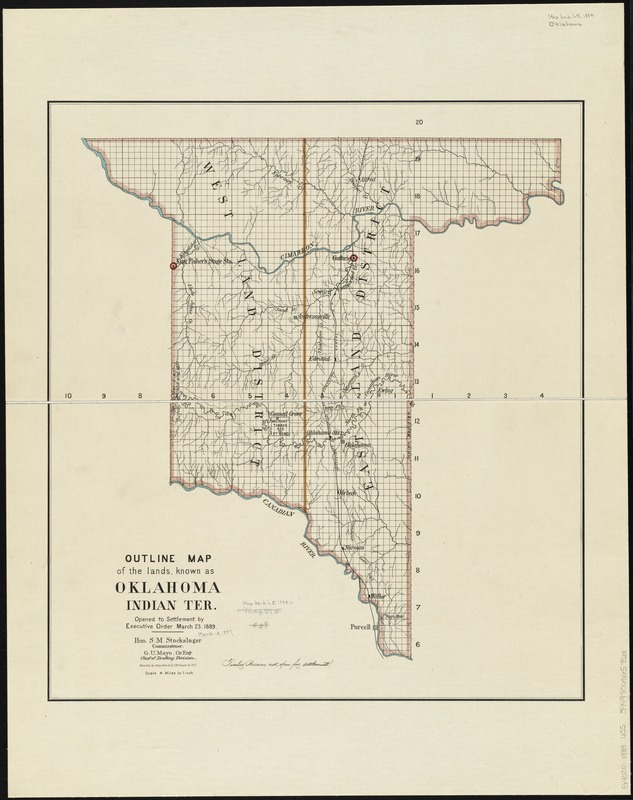
U.S. General Land Office
Outline Map of the Lands Known as Oklahoma, Indian Ter.,
Opened to Settlement …
Washington, D.C., 1889. Printed map, 24 x 21.5
inches. Leventhal Map and Education Center.
The Indian Removal Act of 1830 allocated the eastern portion
of today’s Oklahoma for the Chahta (Choctaw), Chikasha
(Chickasaw), Mvskoke (Creek), Semvnole (Seminole), and Tsalagi
(Cherokee) and other eastern tribal nations. Following the
Civil War, the U.S. government assigned much of western
Oklahoma to tribes living on the Great Plains and further
west. When President Benjamin Harrison took office in 1889, he
signed a proclamation opening 1.9 million acres of "Indian
territory" to non-Natives for homesteading. This map depicts
the territory made available for settlement on April 22, 1889.
That day, over 50,000 people raced to claim the best lands,
including lots in the emerging towns of Guthrie and Oklahoma
City.
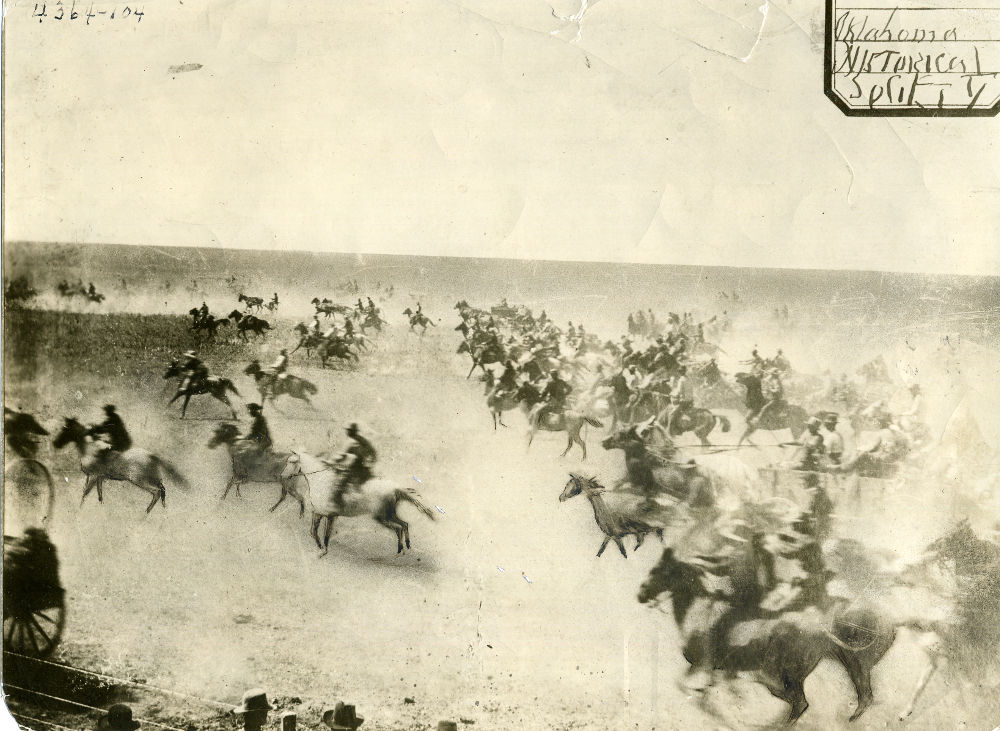
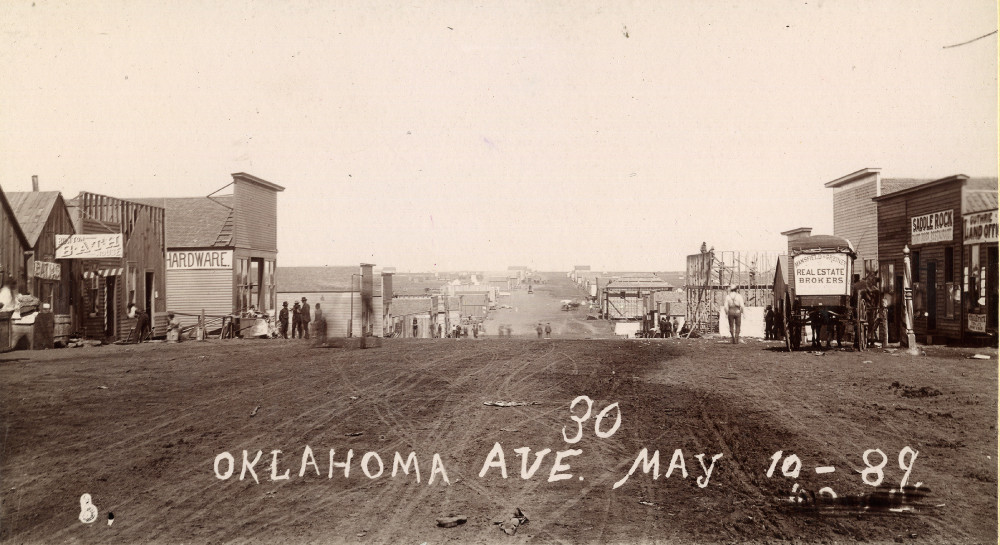
Land Rush of 1889 and
Guthrie, Oklahoma Ave., May 10-89
1889.
Photographic prints. Courtesy of
Oklahoma Historical Society. Reproductions 2019.
Two photographs illustrate Americans’ eagerness to participate
in this land rush. The first records the mass (and blur) of
people riding horses and driving wagons to stake their claims.
They quickly constructed towns and buildings to meet the terms
of the Homestead Act, which required settlers to erect
permanent dwellings. The other photograph illustrates the
growth of Guthrie, depicting Oklahoma Avenue after only three
weeks. Guthrie served as the local land office, and in 1890 it
was designated the territorial capital. Three years after
Oklahoma’s statehood in 1907, the government moved the capital
to Oklahoma City, a growing area at the juncture of major
railroads and home to a burgeoning meatpacking industry.
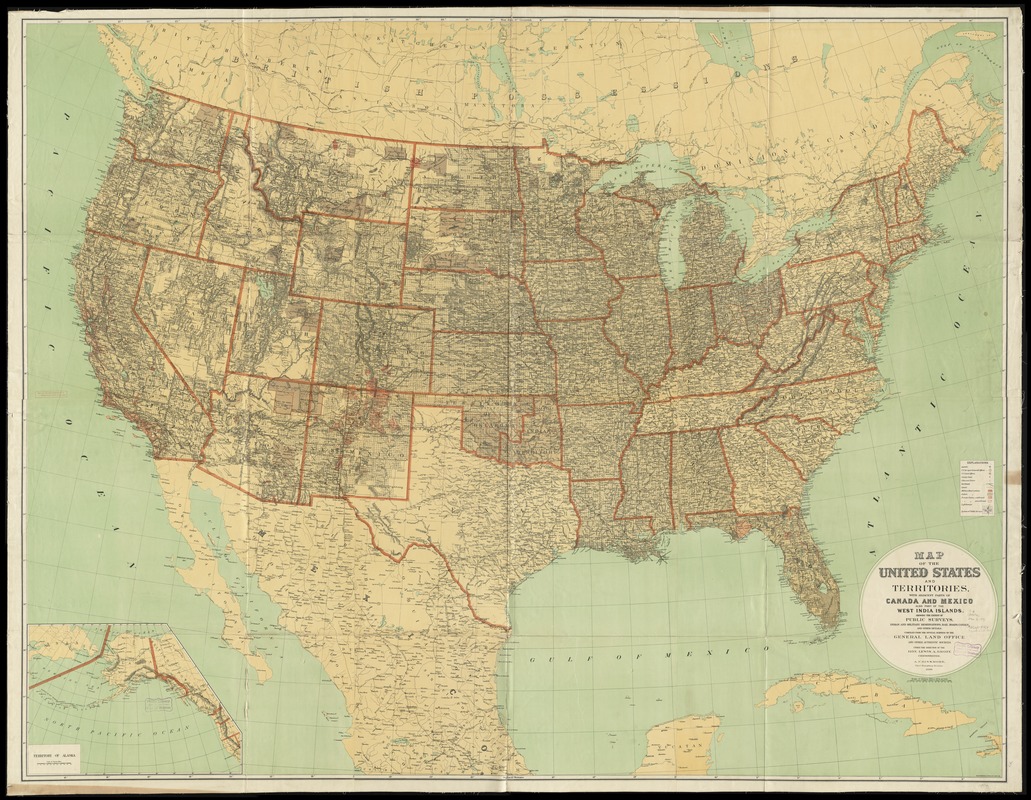
U.S. General Land Office
Map of the United States and Territories … Showing the
Extent of Public Surveys …
Washington, D.C., 1890. Printed map, 67 x 80 inches.
Leventhal Map and Education Center. Reproduction 2019.
This map highlights the federal government’s impact on transforming the American landscape by the end of the 19th century. Designed primarily to show the extent of township surveys, it uses a black grid pattern to represent lands that had been surveyed and open to settlement, which included all or most of the area in the public land states. The map shows the extent of Indian reservations (solid grey), military reservations (solid pink), and private land claims (pink cross hatch or pink outline). The latter, which represent Spanish land grants adjudicated during the 19th century, are most prevalent in Florida, New Mexico, Arizona, Colorado and California.
Viewpoint: As the U.S. government took over territory, it introduced the English concept of "land ownership" to lands that were never governed that way under Native stewardship. U.S. land acquisition literally meant that the land in question went from being perceived as "sustaining life" to "sustaining means or income.” It was a big change and it was harsh on Native people. This dynamic overturned the power structure. Systematically Native peoples' life ways and cultures came under threat. Loss of access to land meant loss of true freedom. This process of dispossession repeats itself over and over, forcing Native peoples to begin adopting a foreign way of life as a matter of survival.
Ward Burnett (1811-1884)
Township no. 25 South, Range no. III West of the 6th
Principal Meridian
1861, with later annotations. Manuscript survey plat,
16.5 x 19 inches. Courtesy of
National Archives and Records Administration, RG 49. Reproduction 2019.
The Homestead and Pacific Railroad Acts, both passed in 1862,
dramatically changed the process for granting public lands.
The former allotted 160 acres to white settlers, as well as
freed men and women, who would improve land within five years
of selection. The latter authorized construction of the first
transcontinental railroad and established the principle of
giving alternating sections (640 acres) to railroad companies.
For example, this township was surveyed in the late 1850s, but
most of the land was not selected until the 1870s. Alternating
sections marked with “RR” were granted to a railroad company,
while those sections patented through the homesteading process
are indicated by an X.
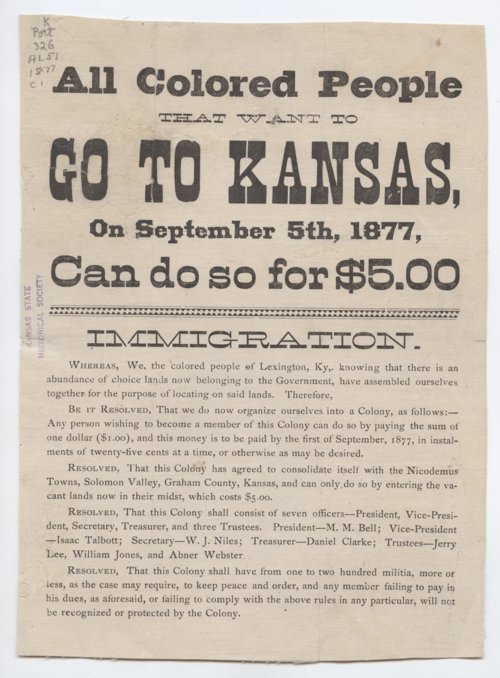
Nicodemus Town Company.
All Colored People that Want to Go to Kansas.
1877. Broadside, 10 x 7.5 inches. Courtesy of
kansasmemory.org,
Kansas State Historical Society, Copy and Reuse Restrictions
Apply. Reproduction 2019.
Following the post-Civil War Reconstruction period, African
Americans started to leave the South, migrating to northern
cities and Western states and territories. One destination was
Kansas, which was promoted in the 1870s through an organized
effort known as the Exodus. African American migrants were
told they would be moving to a “promised land,” and, as
depicted in this broadside, they were enticed with the
prospect of obtaining cheap land through the Homestead Act.
Unfortunately, by the 1870s, most of the best lands offering
good soil and climate had been claimed, and they were forced
to settle in more arid parts of the state.
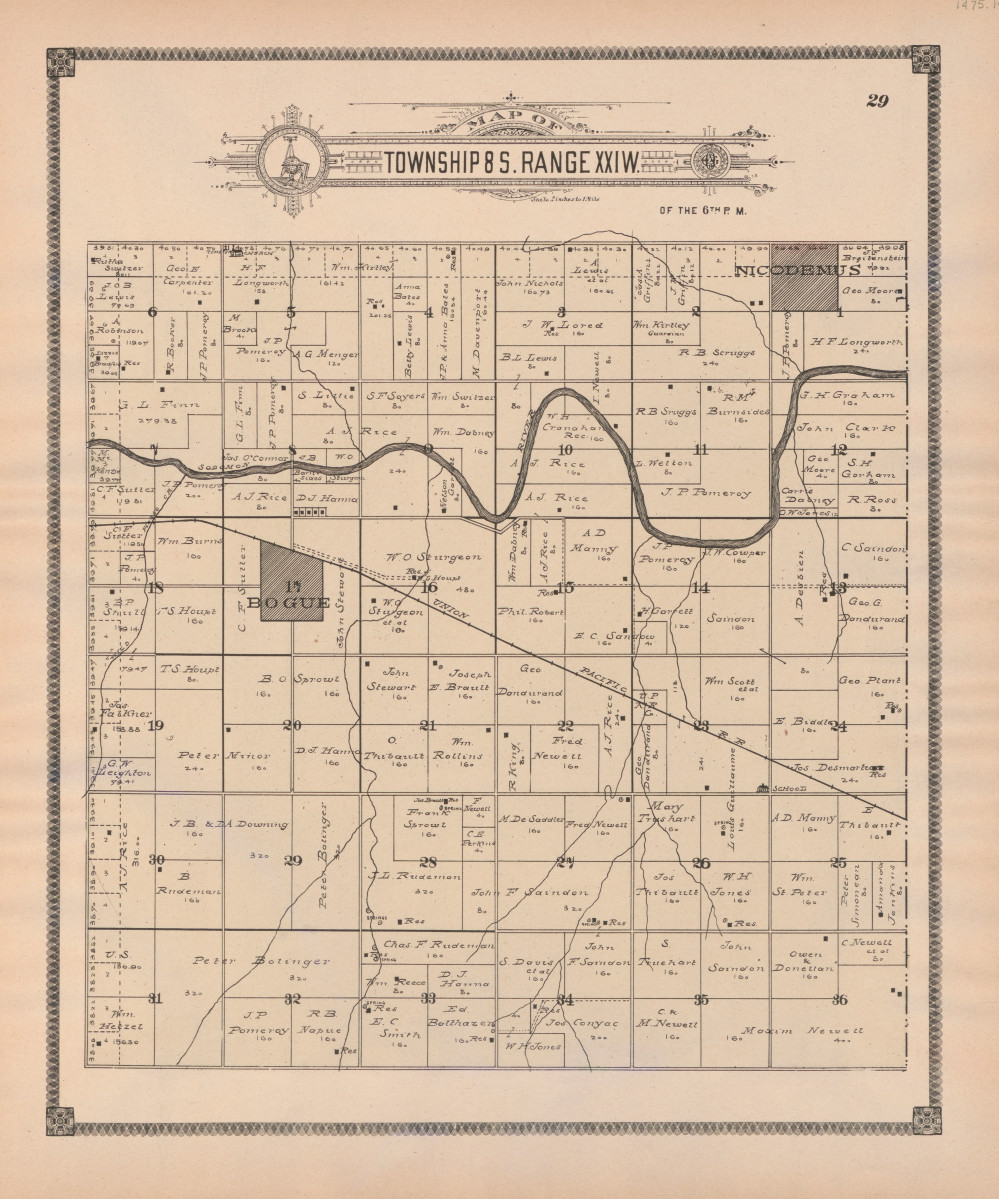
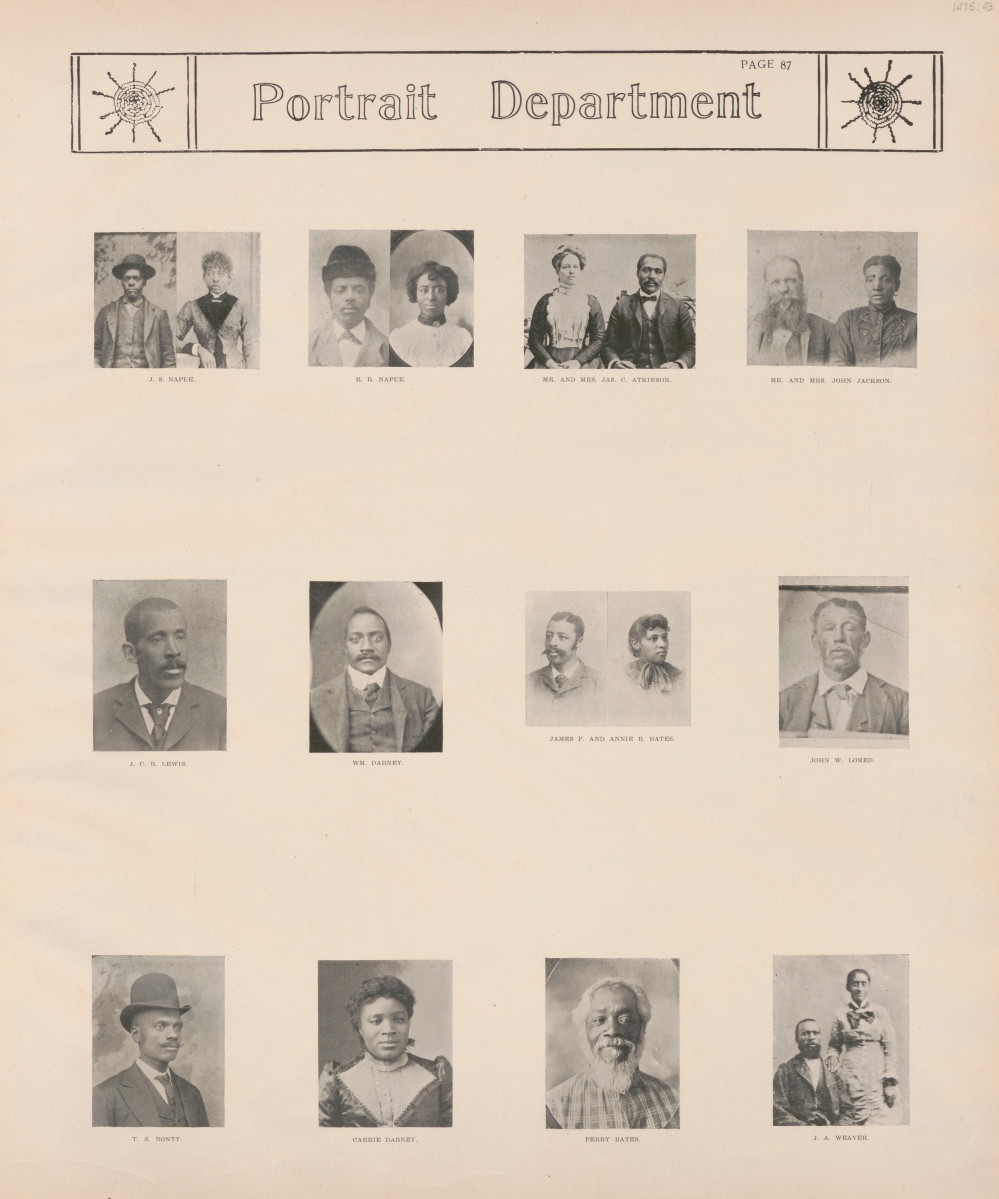
“Township 8 S. Range XXI W.” and “Portrait Department” from
George A. Ogle,
Standard Atlas of Graham County, Kansas.
Chicago, 1906. Atlas pages, 18 x 15 inches. Courtesy
of Library of Congress Geography and Map Division. Reproduction 2019.
One Black town founded during this period was Nicodemus,
located on the high plains of western Kansas, as depicted in a
county atlas. The town was founded in 1877, growing to 600 by
1880. The town’s efforts to attract the railroad failed, and
its population and prosperity were declining by the time this
atlas was published. The portrait section, a common feature of
county atlases, provides evidence of the African American
settlement, since the very last page displays portraits of 12
African American families, six of which can be located on this
township map. Others were located in surrounding townships.
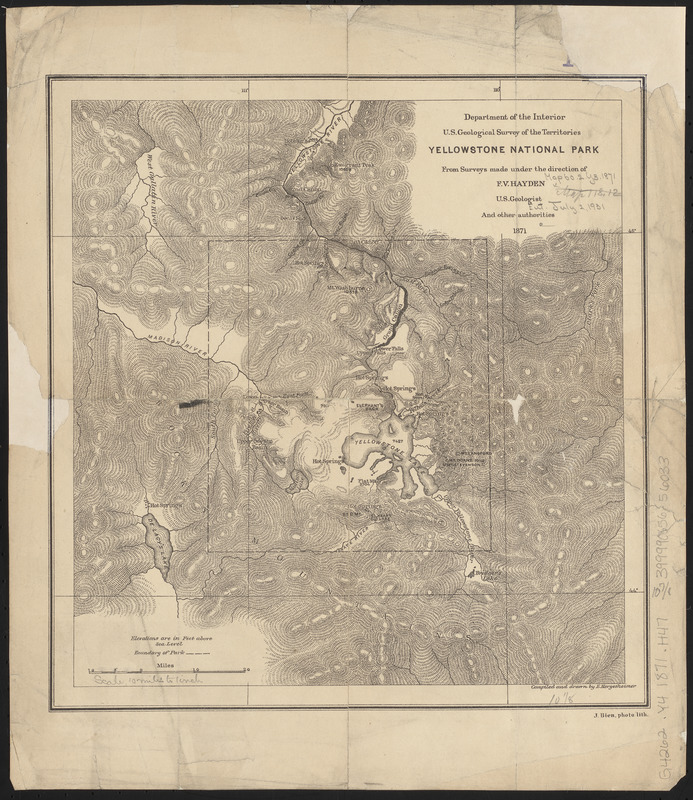
Ferdinand V. Hayden (1829-1887)
Yellowstone National Park
Washington, D.C., 1871. Printed map, 15 x 12.5
inches. Leventhal Map and Education Center.
During the last half of the 19th century, Americans expressed
concern about the environmental costs of clearing forests,
mining, and flourishing industries. Early conservation
advocates sought to preserve the spectacular scenery as well
as the land, water, and forests. However, the driving mission
of the national parks movement—to preserve natural landscapes
untouched by human interference—involved the systemic
oppression and removal of Native people. In 1872, Congress
designated the headwaters of the Yellowstone River in
northwestern Wyoming as the first national park. The pursuit
of a pristine wilderness necessitated the forcible removal of
the Bannock and Shoshone people from Yellowstone.
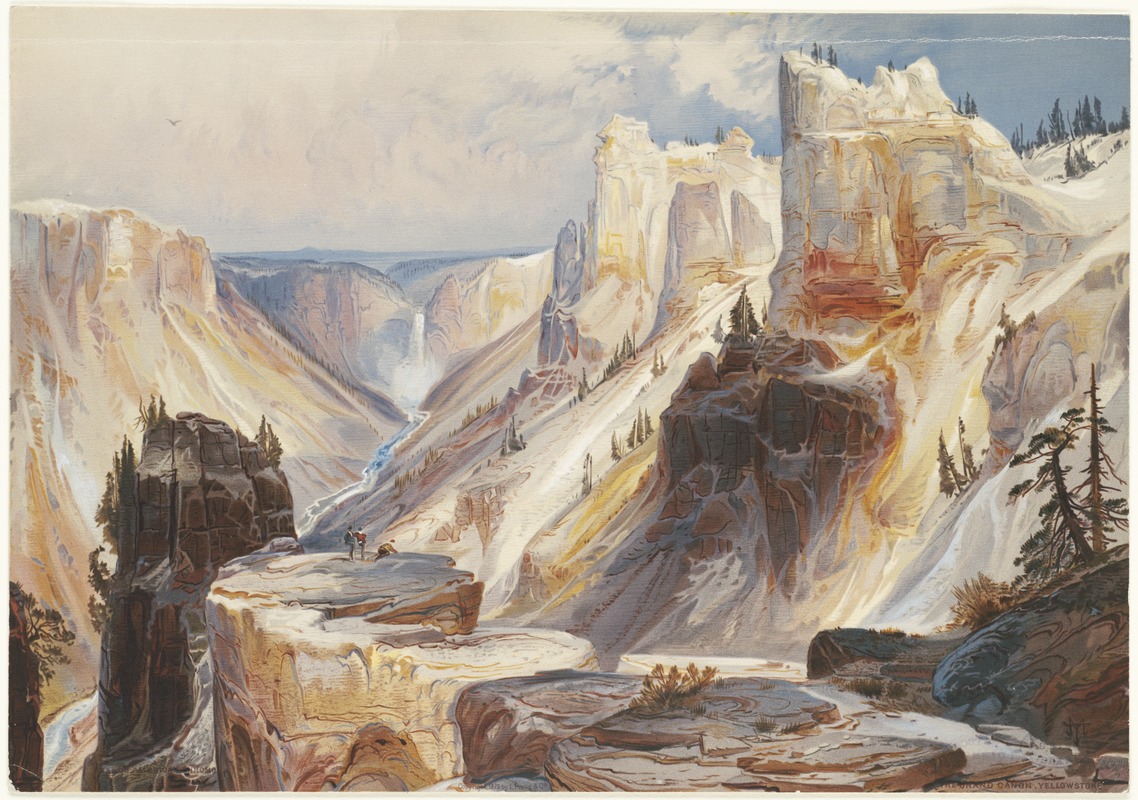
Thomas Moran (1837-1926)
The Grand Canyon, Yellowstone
Boston, 1875. Chromolithograph, 9.75 x 14 inches.
Courtesy of Boston Public Library, Print Department. Reproduction 2019.
In the mid-19th century, Americans began advocating for
landscape conservation out of fear that the West’s beauty
would be lost. In 1872, Congress designated Yellowstone as the
first national park. Louis Prang’s print of the Grand Canyon
of the Yellowstone River, based on a painting by artist Thomas
Moran, dramatizes light shining onto waterfalls carved into
mountains. Images like this reinforced the misconception that
the West was a largely uninhabited and untouched wild
environment.
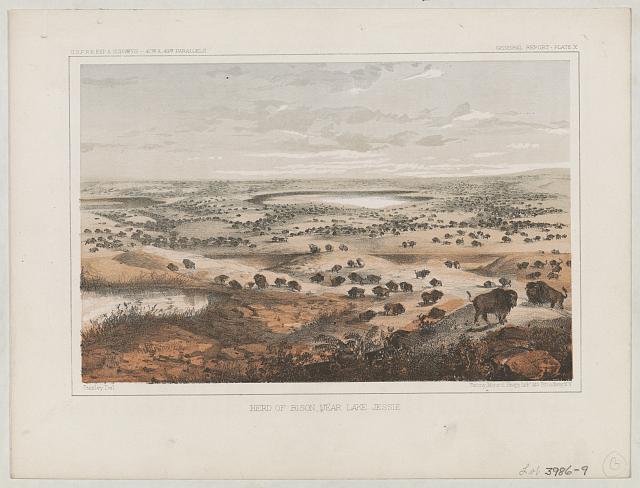
John Mix Stanley (1814-1872)
"Herd of Bison, near
Lake Jessie," from
Reports of Explorations and Surveys, to Ascertain the
Most Practicable and Economical Route for a Railroad …
Washington, D.C., 1855-1860. Lithograph print, 8.5 x
11.5 inches. Courtesy of
Library of Congress Prints and Photographs Division. Reproduction 2019.
The abundance of bison still living on the Great Plains at
mid-century is documented in this landscape view by John Mix
Stanley. It depicts a large herd dotting the North Dakota
landscape as far as the eye can see. Stanley, who served as
the lead artist for Isaac Stevens’ Northern Pacific Railroad
survey in 1853-1854, prepared a variety of views recording
scenery, Native peoples, and wildlife which were used for 55
illustrations in the final published report of the railroad
survey.
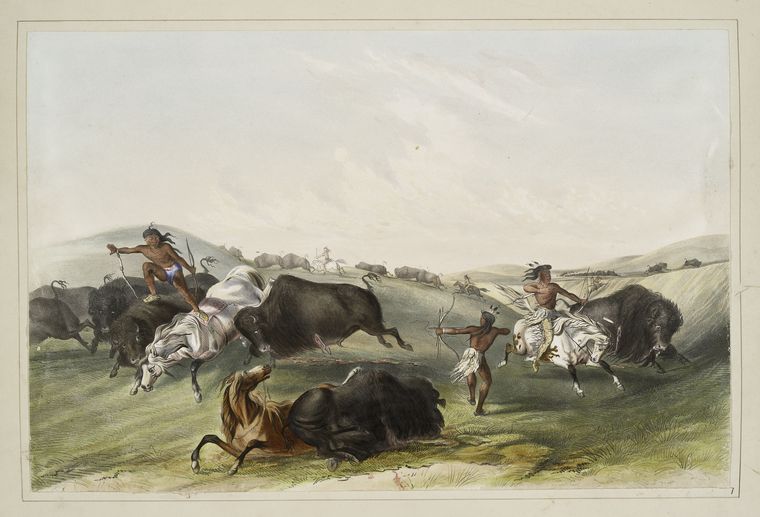
George Catlin (1796-1872)
"Buffalo Hunt, Chase," from
Catlin’s North American Indian Portfolio
New
York, 1845. Lithograph print, 16 x 22 inches. Courtesy of
New York Public Library Rare Book Division. Reproduction 2019.
In contrast, George Catlin’s illustration provides a dramatic,
romanticized, Euro-American vision of the West—armed only with
spears and bows and arrows, Native people hunt bison on
horseback. This rendition evokes excitement of the high-speed
chase and the daring of these hunters before such powerful
animals. Catlin featured the print in his
North American Indian Portfolio. He focused less on
detailing an accurate landscape, and more on manufacturing
scenes that would appeal to readers.
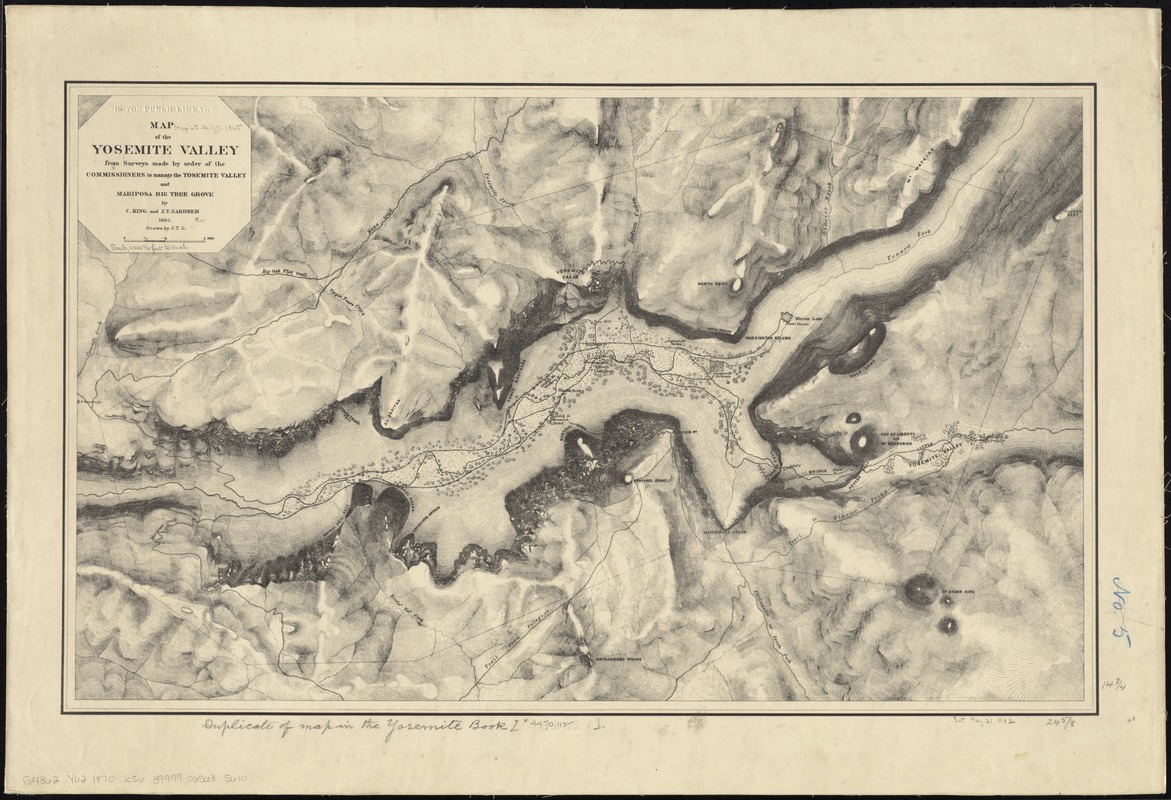
Clarence King (1842-1901) and James T. Gardiner (1842-1912)
Map of the Yosemite Valley …
Washington,
D.C., 1870. Printed map, 19.25 x 28 inches. Leventhal Map
and Education Center.
In 1890, California's Yosemite Valley became the second
national park, although it had already been set aside as a
state preserve in 1864, following the violent expulsion of the
Ahwahnechee people. Both Yellowstone and Yosemite were mapped
as part of four Great Western Surveys that preceded the
establishment of the U.S. Geological Survey in 1879. Clarence
King, who headed the Geological Exploration of the Fortieth
Parallel, mapped Yosemite in 1870, while F. V. Hayden, who led
the Geological and Geographical Survey of the Territories,
mapped Yellowstone in 1871. Both used the traditional method
of hachuring—drawing ink strokes along sloped land—to depict
the rugged terrain of these unusual landscapes.
2a. ECONOMY 1800-1862: Transforming the Landscape through Agriculture, Mining, and Industry
While many Euro-Americans believed they were settlers in an untouched wilderness, Native people had altered the landscape by managing forests, growing crops, hunting, igniting seasonal burnings, and building communities for millennia. As U.S. government officials explored, mapped and inventoried the lands west of the Appalachians, they advertised the fertility of the soil and the presence of mineral resources. American settlers cleared the forests to create farms and scarred the earth to mine for resources, which eventually drove the construction of industrial towns and cities.
Timber and coal fueled new factories in urban centers that processed agricultural and mineral products into marketable items. Under colonial and U.S. rule of law, this change was known legally as “improving” the land. Wealth generated from resource extraction and the labor of enslaved and free workers enriched the prospects of a small but very rich upper class, though new industrial jobs and small subsistence farms did lift some free laborers and farmers out of poverty.
VIEWPOINT: When looking at these maps, it's important to keep in mind that the idea of 'improving' land is an English colonial concept. Native people worked the land prior to American settlement. Disease-ravaged native populations and vast farmlands quickly returned to forest. The existing forests were managed systematically by Native peoples in different ways and for different reasons. The law said "improve", but what it meant literally was doing something to make a profit. This was usually done through farming, cutting down trees, planting crops, raising cows, chickens and pigs, and never moving. The concept that this behavior is an "improvement" is purely a European perspective.
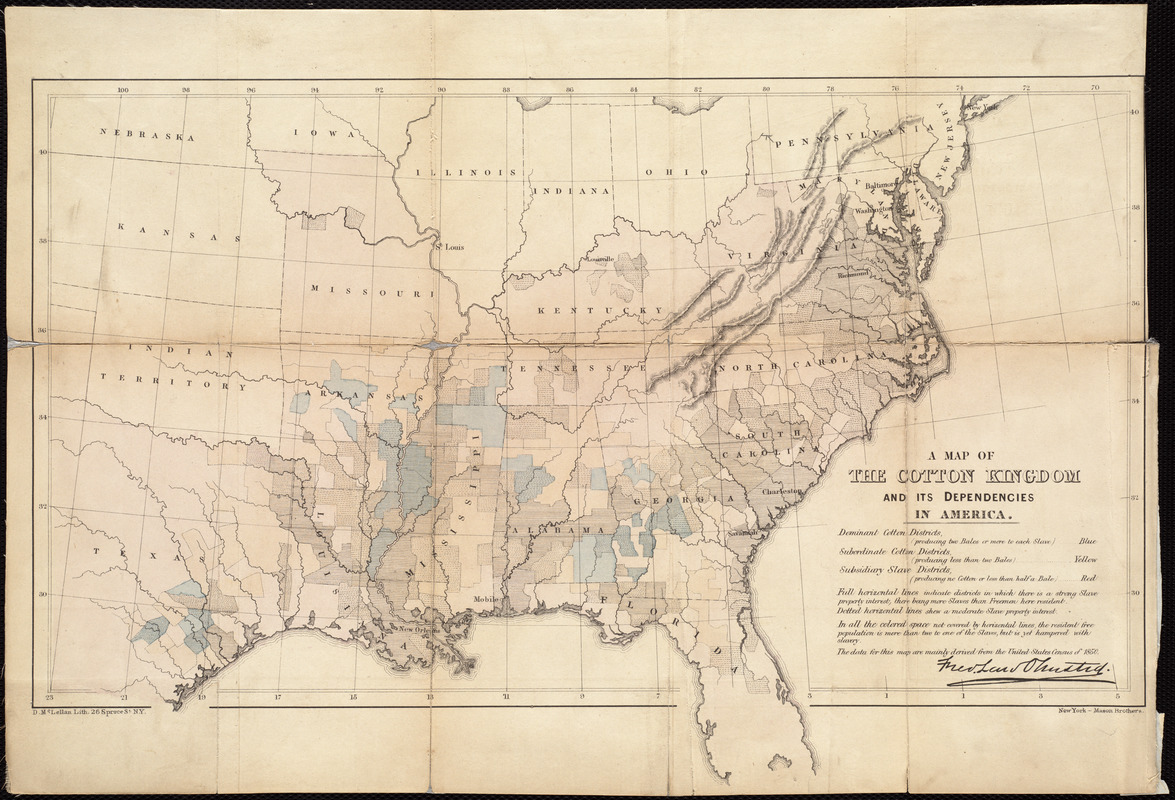
Frederick Law Olmsted (1822–1903)
“A Map of the Cotton
Kingdom and its Dependencies in America,” in “The Cotton
Kingdom”
New York, 1861. Printed map, 11 x 17 inches.
Courtesy of
Boston Public Library, Rare Books Department. Reproduction, 2019.
This statistical map addresses the importance of cotton
agriculture in the economy before the American Civil War. It
represents agricultural productivity rather than distribution
and density of cotton cultivation by mapping two variables:
productivity of cotton per enslaved laborer (blue, yellow, or
red) and ratio of enslaved people to freemen (solid versus
dashed horizontal lines). The map accompanied landscape
architect Frederick Law Olmsted’s published account of his
travels through the South during the 1850s. Hired by the “New
York Times” as a journalist to report his observations about
the region’s economy, he argued that chattel slavery was
inefficient for cotton production.
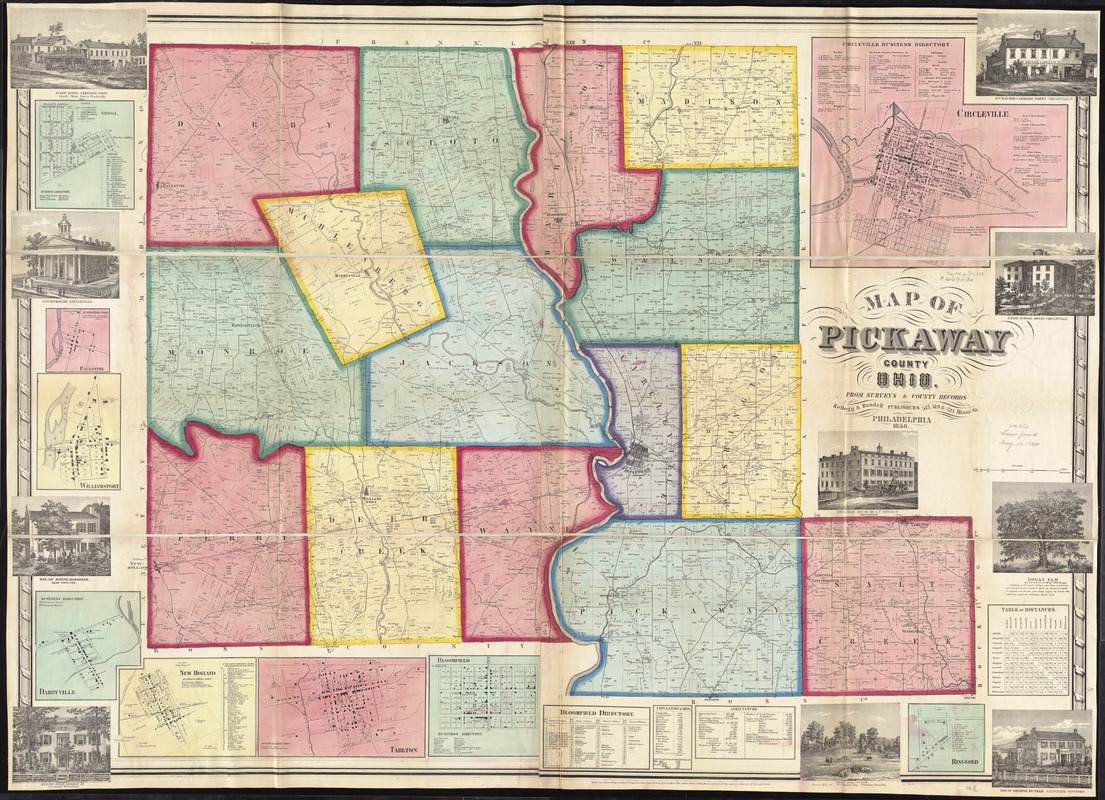
Robert Pearsall Smith (1827–1898)
“Map of Pickaway
County, Ohio, from Surveys and County Records”
Philadelphia,
1858. Printed map, 38 x 53 inches. Leventhal Map and
Education Center.
Pickaway County, located in central Ohio about 25 miles south
of Columbus, provides a good example of a rural Midwestern
county where the economy was based on diversified agriculture
during the first half of 19th century. The statistical tables
along the bottom margin of this land ownership map indicate
that the county had a population of 21,000 and farms were
valued at $6 million. Agricultural production included a
variety of livestock (horses, cows, oxen, sheep, and swine)
and crops (corn, wheat, rye, oats, hay, and potatoes). The map
also displays the boundaries of individual landholdings,
indicating that most were small farms containing several
hundred acres.
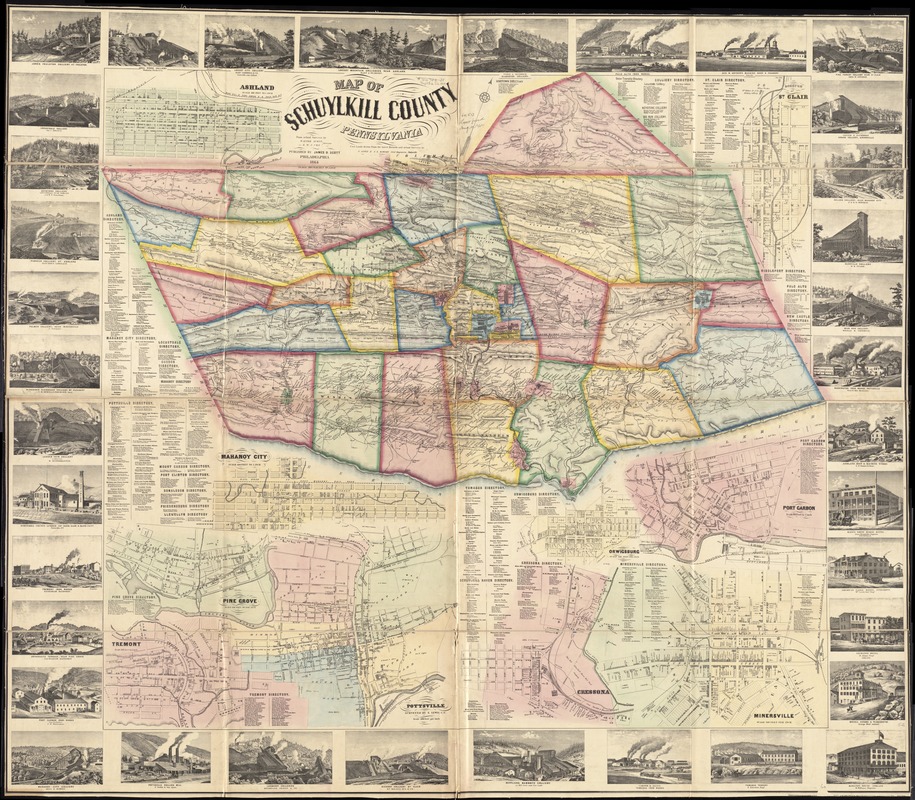
James D. Scott (fl. 1854–1889)
“Map of Schuylkill
County, Pennsylvania”
Philadelphia, 1864. Printed map,
45 x 50 inches. Leventhal Map and Education Center.
The economy of Schuylkill County, located in northeastern
Pennsylvania, focused on anthracite coal mining during the
19th century. This county map documents how that activity
dominated the landscape. Of the 37 marginal vignettes, 20
illustrate collieries – coal mines and connected buildings. An
additional ten depict local iron manufacturers, fueled by the
region’s coal. Also evident is the network of railroads and
canals that shipped these resources to New York City and
Philadelphia. The map identifies landowners’ names including
many coal companies, and also displays street plans and
directories for 23 towns, detailing retail activities and
service industries within each.
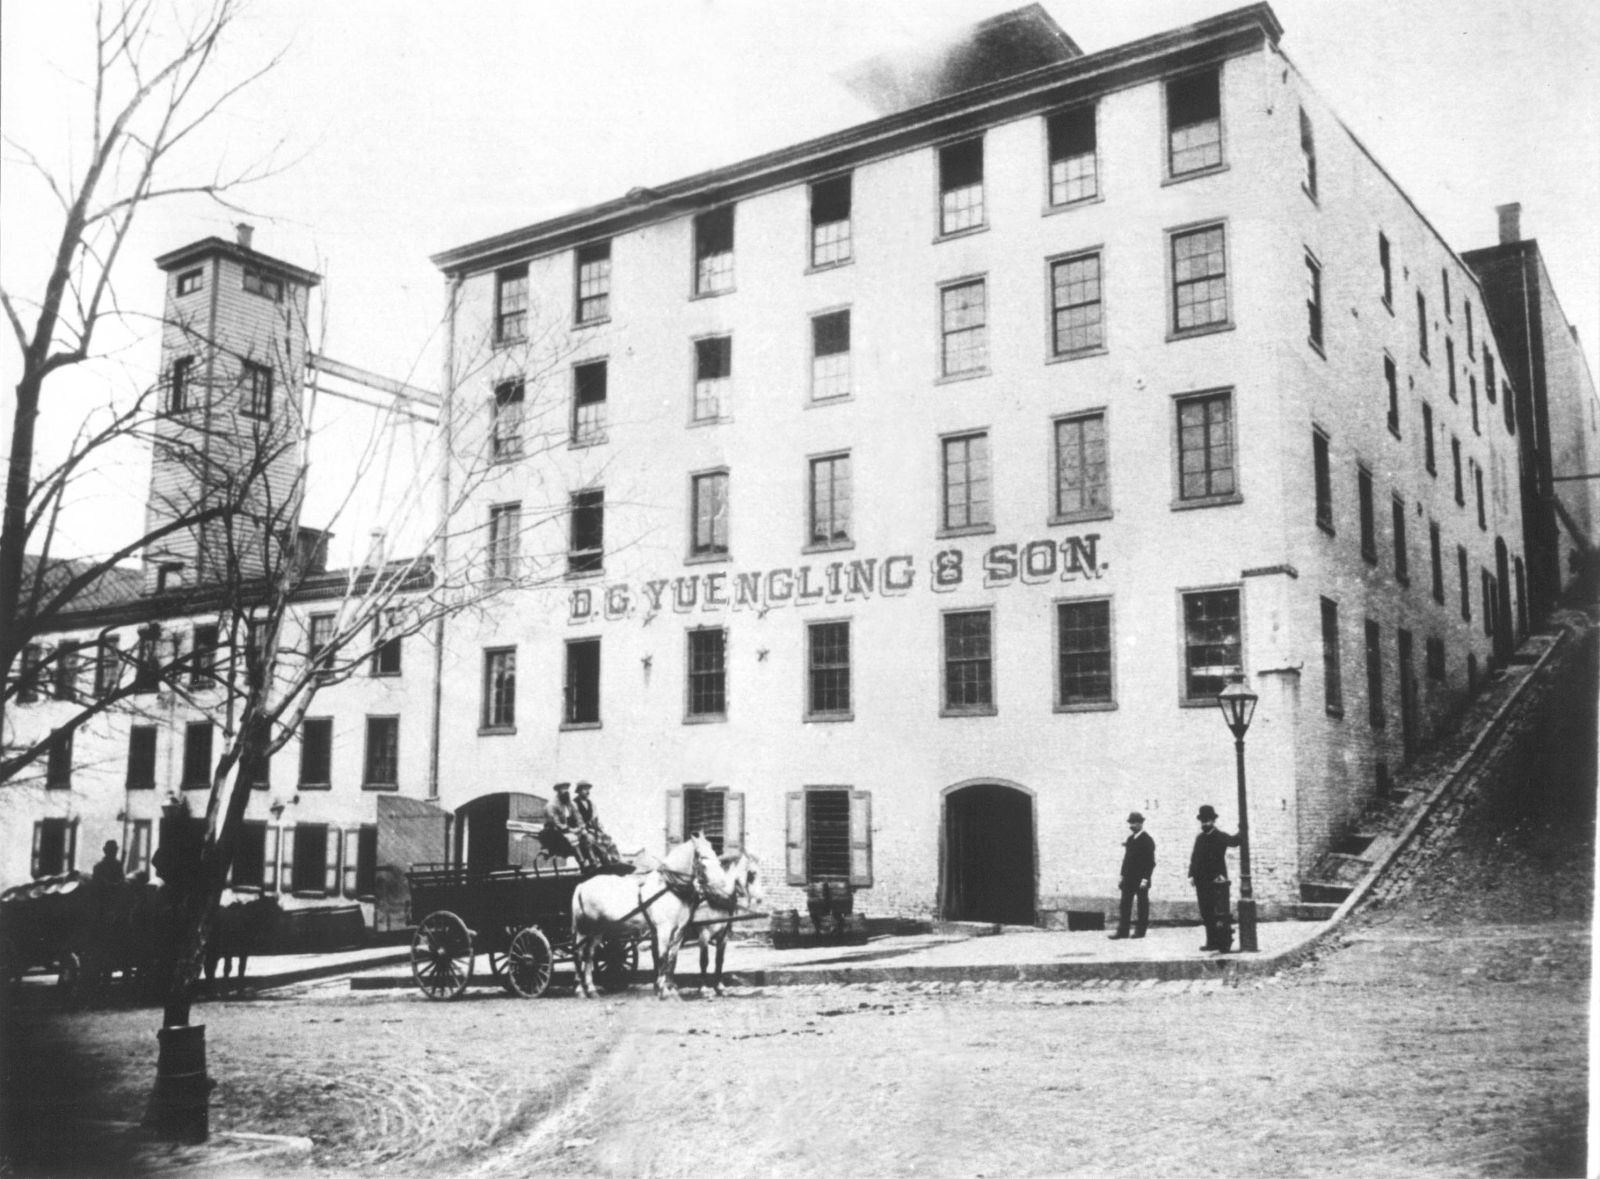
“Exterior View of D.G. Yuengling & Son Brewery”
Ca.
1855. Photographic print, 8 x 11 inches.
Courtesy of D.G. Yuengling & Son, Inc.
Reproduction, 2019.
The street map for Pottsville, the county seat and largest
town, accompanies a directory with 110 listings. Yuengling
brewery, which is the oldest brewery in the United States
still in operation today, appears in the list and is located
on the town map. This photograph, taken around 1855, is the
earliest known image of the brewery. David G. Jüngling, who
immigrated from Germany, founded the brewery in 1829. He
changed the spelling of his name to Yuengling so that
Americans could pronounce it. He anticipated that
locals—especially the many German immigrants who lived in the
region—would purchase his product.
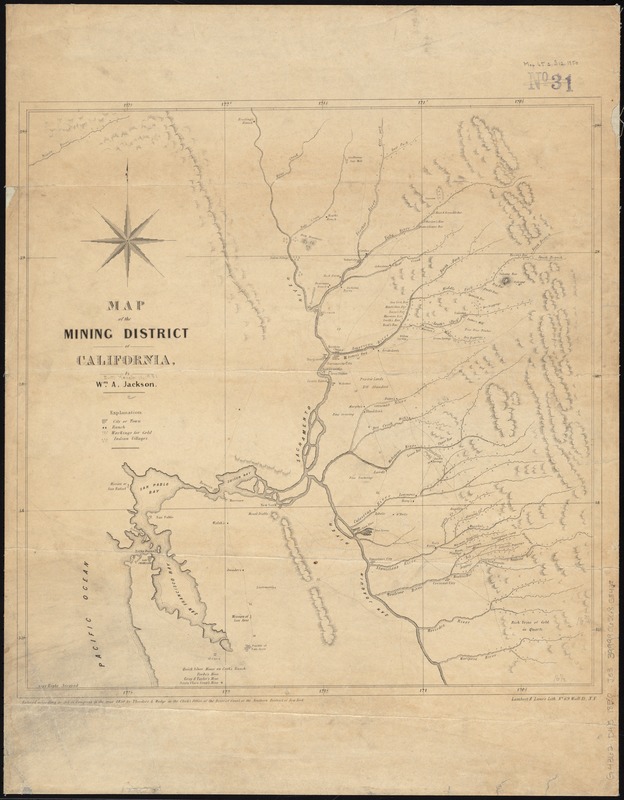
William A. Jackson (fl. 1850)
“Map of the Mining
District of California”
New York, 1850. Printed map, 17
x 17 inches. Leventhal Map and Education Center.
Immediately prior to the discovery of gold in 1848, central
California was home to Native communities; Mexican missions,
ranchos, and pueblos; the small
presidio—fortified military settlement—of San
Francisco; and a few white American residents. Published two
years later, this map testifies to the frantic pace of
settlement during the California Gold Rush. By 1855, over
300,000 immigrants from the eastern United States, Europe,
Latin America, Australia, and China established mining camps,
towns, and roads. San Francisco grew rapidly. By the 1870s,
California’s Native population plummeted from an estimated
150,000 to 30,000. Thousands were forcibly removed from their
homelands, enslaved, or killed. Early legislation in
California made it lucrative to enslave Native peoples, or to
be paid for exterminating them.
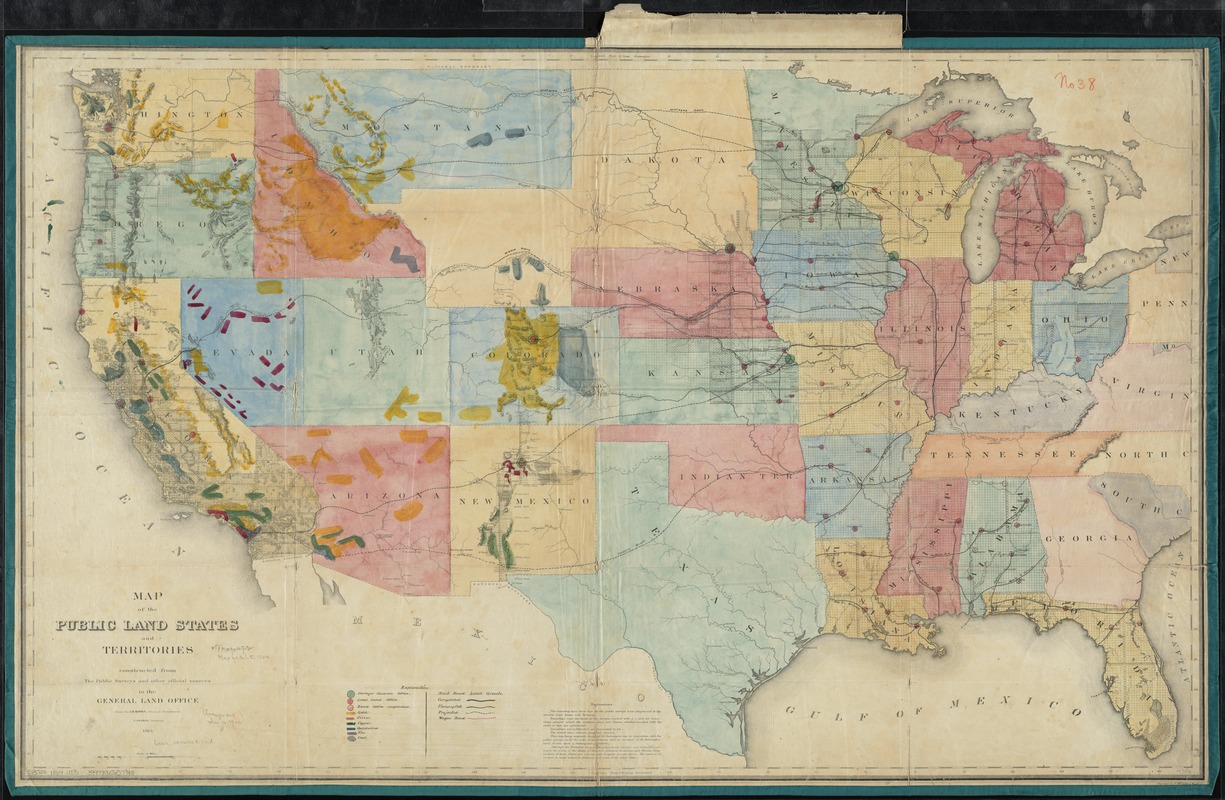
U.S. General Land Office
“Map of the Public Land
States and Territories …”
Washington, DC, 1864. Printed
map, 30 x 44 inches. Leventhal Map and Education Center.
This map, one of the first thematic maps of the United States
published by the General Land Office, provided an inventory of
the nation’s land and mineral resources. Besides showing the
extent of township surveys, it locates local land offices and
completed, uncompleted, and projected railroads. In addition,
it uses color coding to identify the locations of six mineral
resources – gold (yellow), silver (red), copper (green),
quicksilver (blue), tin (purple) and coal (gray) – primarily
covering extensive areas of the western states and
territories. Ignoring the presence of Native peoples in this
region, the map suggests that the minerals are readily
available for exploitation.
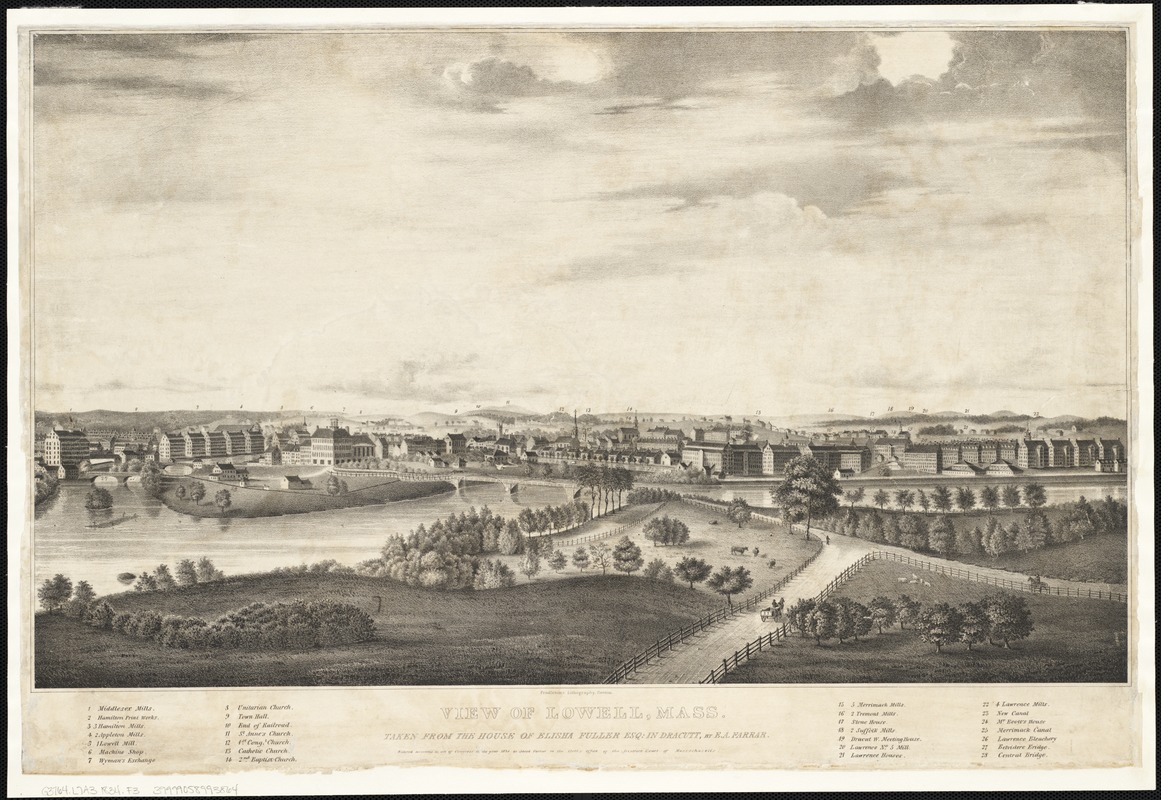
E.A. Farrar (fl. 1834)
“View of Lowell, Mass. …”
Boston,
1834. Printed view, 14.25 x 24 inches. Leventhal Map and
Education Center.
Lowell, Massachusetts, the first planned company mill town, is
recognized as the cradle of America’s Industrial Revolution.
In the 1820s, Boston financiers founded the town when they
constructed a textile factory on a canal bypassing the
Merrimack River’s Pawtucket Falls. By mid-century, Lowell was
the largest industrial complex in the United States. The
textile economy relied on cotton grown by enslaved people in
the South. The jobs attracted young women from rural New
England, and immigrants from French Canada, Germany, and
Ireland. The accompanying view, published in 1834, illustrates
how the mills dominated the city’s landscape when viewed from
the north side of the Merrimack River.
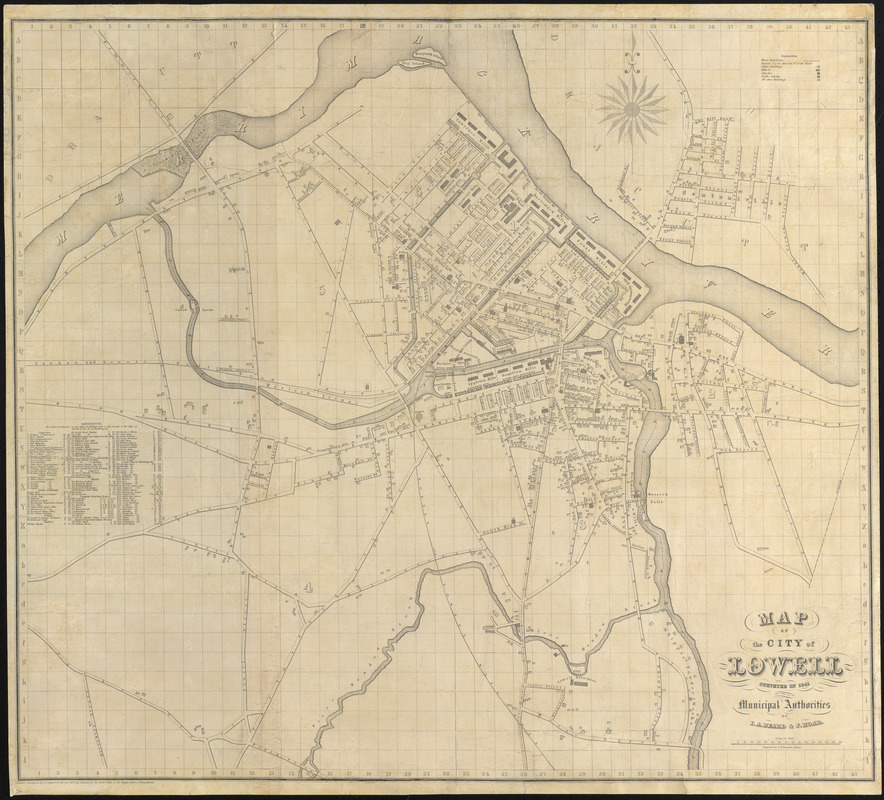
Ithamar A. Beard and J. Hoar
“Map of the City of
Lowell Surveyed in 1841 …”
Boston, 1842. Printed map, 30.5 x 34 inches. Courtesy of
Lawrence Caldwell.
By the early 1840s, when this map was prepared, Lowell had
grown to a population of more than 20,000, making it the
state’s second largest city. The map details the footprint and
function of individual buildings and demonstrates how dominant
the textile industry was in the community. The map notes ten
named textile mills as well as an additional 19 mills and
factories. Mills were located near the river and canals, which
provided waterpower for the factories. The directory lists
company boarding houses, agents and superintendent houses, as
well as numerous churches, schools, and other public
buildings.
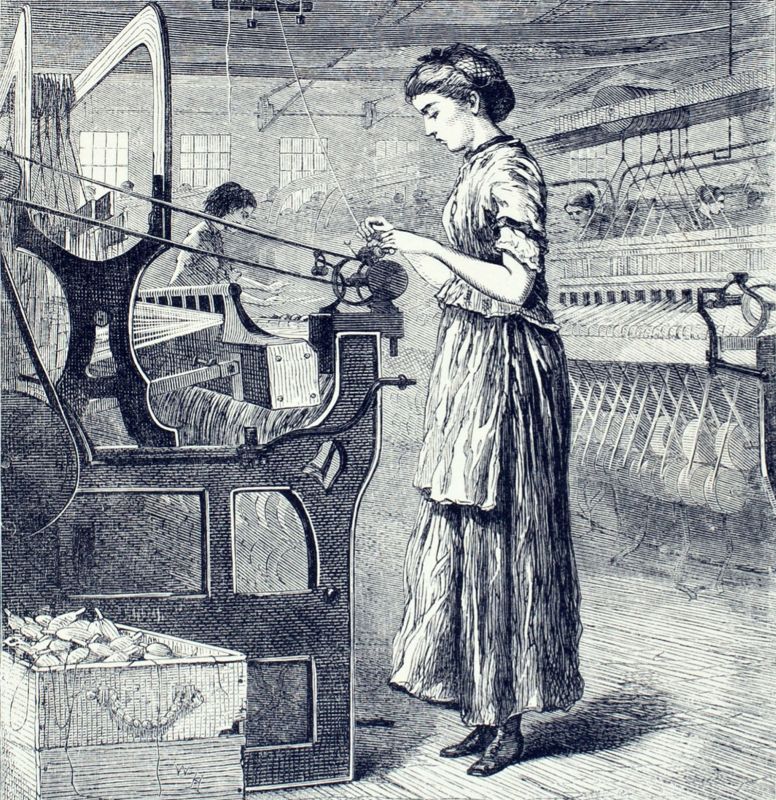
Winslow Homer (1836–1910)
“The Bobbin Girl,” from
William Cullen Bryant, “Song of the Sower”
New York,
1871. Print. Courtesy of the
American Antiquarian Society. Reproduction, 2019.
The role of women in the textile industry is reflected in this
illustration by Winslow Homer. The same year that the
accompanying view was published, the textile workers formed
the nation’s first union of working women, “turning out”
(striking) in response to proposed wage cuts and blazing a
trail for union workers.
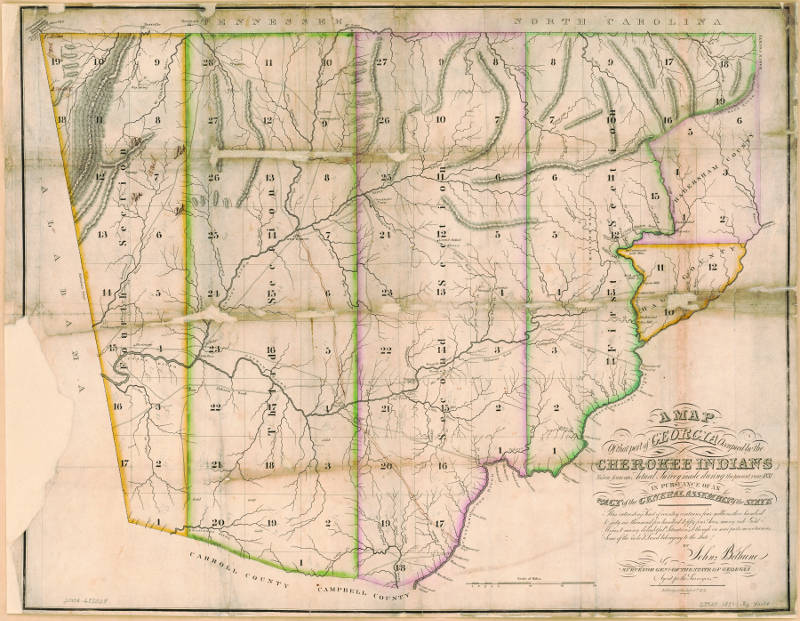
John Bethune (1770–1861)
“A Map of That Part of
Georgia Occupied by the Cherokee Indians … “
Milledgeville,
GA, 1831. Printed map, 20.5 x 26.5 inches. Courtesy of the
Library of Congress Geography and Map Division. Reproduction, 2019.
The cultural and economic landscape of northwestern Georgia
underwent dramatic changes before the American Civil War. This
region formed part of the Tsalagi (Cherokee) homelands until
the U.S. government forced the tribe’s removal to the Great
Plains from 1836 to 1839. Gold was discovered in 1828,
initiating one of the nation's first gold rushes and hastening
their expulsion. This map, prepared in 1831 by the Georgia
Surveyor General, promoted the richness of the area,
especially the gold mines and fertile soil coveted by
settlers. Besides locating a number of gold mines, the map
also displayed Tsalagi communities and roads.
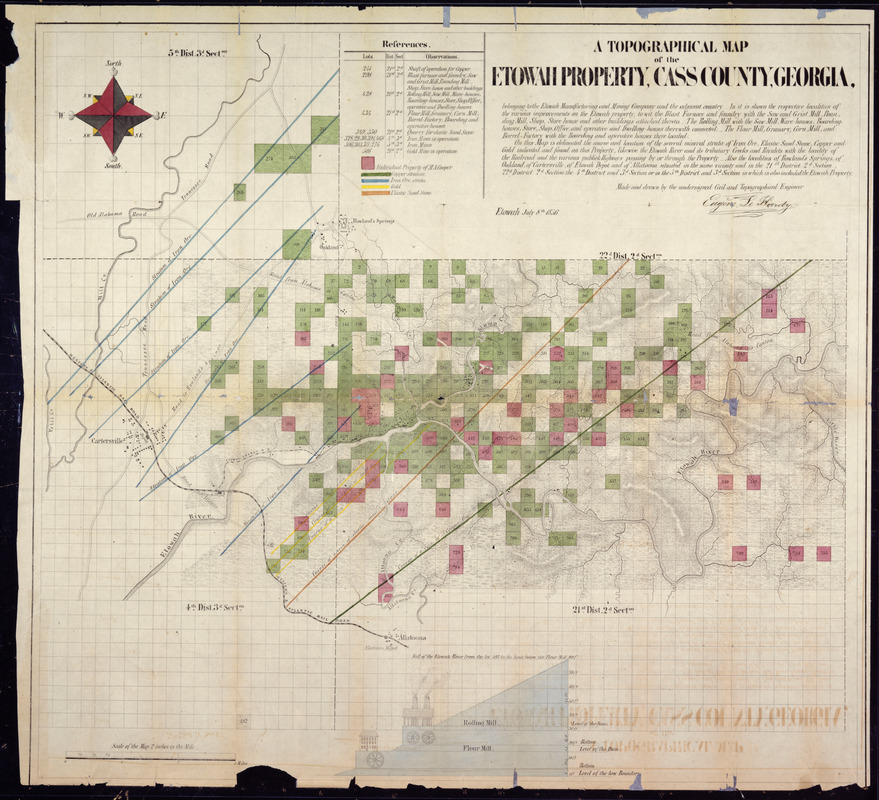
Eugene LeHardy (fl. 1856)
“A Topographic Map of the
Etowah Property, Cass County, Georgia”
Etowah, GA,
1856. Film of printed map, 5.5 x 8 inches. Courtesy of
National Archives and Records Administration. Reproduction, 2019.
Georgia’s gold rush ended by the early 1840s, but the discovery of other mineral resources, including iron, furthered the extensive exploitation of the landscape. During the first half of the 19th century, iron furnaces, which relied on charcoal, tended to be small rural operations located near iron deposits. One example is the Etowah Manufacturing and Mining Company located in northwestern Georgia. The accompanying topographic map shows that the small village encompassed the furnace, rolling mill, and workers’ housing and stores, while the company owned at least 10,000 acres of surrounding forest. This landscape was altered by cutting down massive amounts of timber to produce charcoal.
2b. ECONOMY 1862-1900: Transforming the Landscape through Agriculture, Mining and Industry
While many Euro-Americans believed they were settlers in an untouched wilderness, Native people had altered the landscape by managing forests, growing crops, hunting, igniting seasonal burnings, and building communities for millennia. Different Native peoples developed relations with Spanish, French, Dutch, and English colonial powers. In trading partnerships, especially with the French and British, they often hunted animals and finished pelts that reached Europe and Asia as part of a global fur trade.
As U.S. government officials mapped and inventoried the lands west of the Appalachians, they advertised the fertility of the soil and the presence of mineral resources to American settlers who in turn pursued a more intensive exploitation of the landscape. They cleared the forests to create farms and scarred the earth to mine for resources, which eventually drove the construction of modern cities. Timber and coal fueled new factories in urban centers that processed agricultural and mineral products into marketable items. Under colonial and U.S. legal systems, this change was known legally as “improving” the land.
For Kids
Ranchers, farmers, miners, tradespeople,
and bankers all contributed to the wealth of the expanding
United States and the growth of cities. Another group’s
relationship to the economy changed drastically after the
Civil War: formerly enslaved people and their descendants.
Though not free from racism and discrimination, their embrace
of new opportunities changed the country in meaningful ways.
- These maps show how farms, mines, factories and new cities spread across the country. What is not shown?
- What stories do the maps tell about the relationships between people, the environment and money?
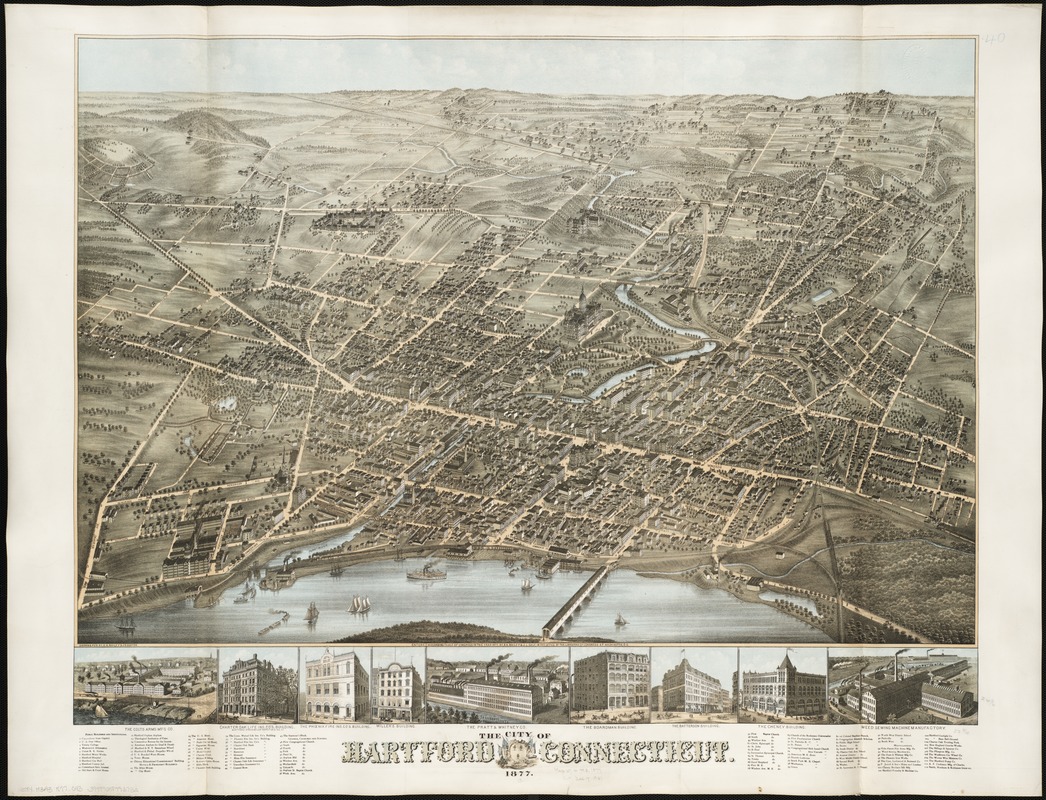
Oakley Hoopes Bailey (1843-1947)
The City of Hartford, Connecticut
Boston, 1877. Printed map, 25 x 33 inches. Leventhal
Map and Education Center.
For several decades following the Civil War, Hartford,
Connecticut ranked as the richest city in the nation. As the
headquarters for numerous insurance companies, it was known as
the “insurance capital of the world.” The city also led the
Industrial Revolution as a large producer of guns, sewing
machines, and machine tools. One marginal inset illustrates
the Colt Arms Manufacturing Company, which produced guns
widely used during the Civil War and in later conflicts with
western tribal nations. This panoramic view from the east
captures the city’s economic diversity in the 1870s, when it
had reached a population of 40,000.
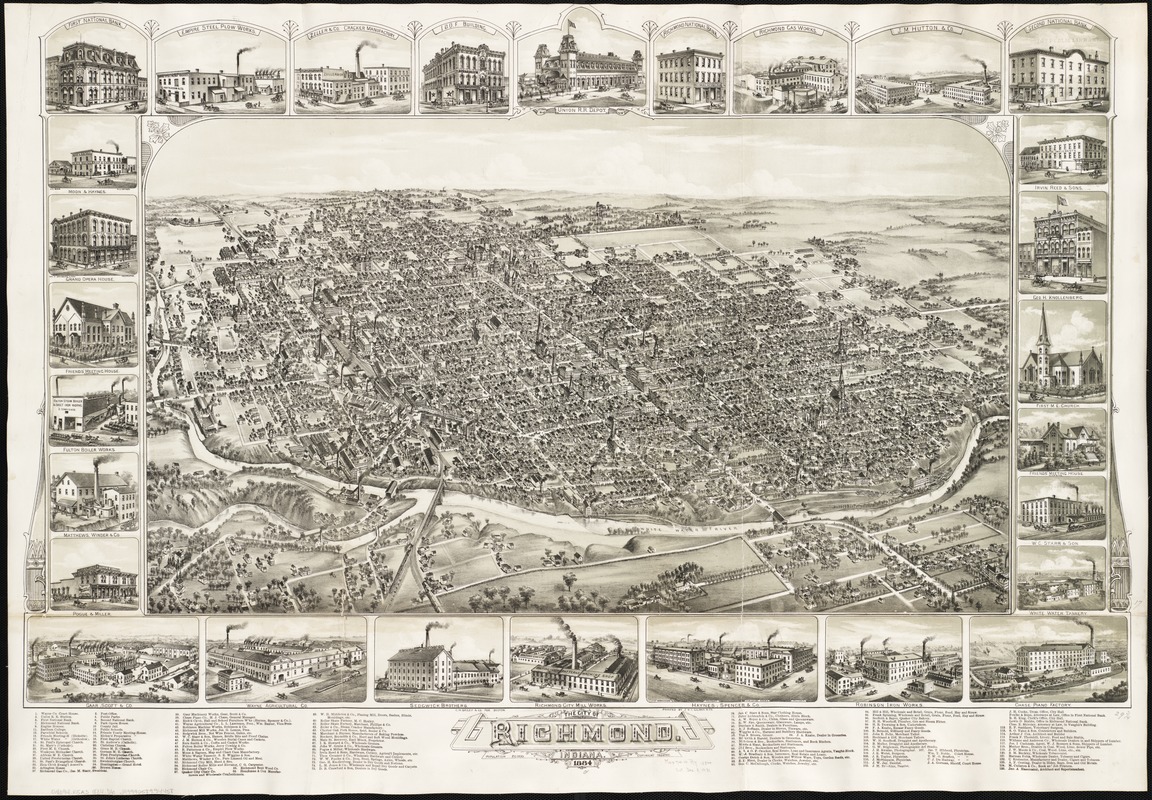
Albert E. Downs (fl. 1880-1916)
The City of Richmond, Indiana
Boston, 1884. Printed map, 24.5 x 37 inches.
Leventhal Map and Education Center.
Richmond, Indiana, located on the original National Road near
the Indiana-Ohio boundary, provides an example of a midwestern
industrial town that was a center of government, commerce,
finance, and education. Oriented with east at the top, this
bird’s-eye view places the White Water River and the railroad
crossing in the foreground. The map’s directory lists 29
industrial enterprises. Many local factories manufactured farm
implements and processed agricultural produce. The largest
companies produced threshing machines, grain drillers, and
mowers, while smaller plants made crackers, baking powder, and
linseed oil. Others built non-agricultural goods, such as
pianos, caskets, boilers, and even map cases.
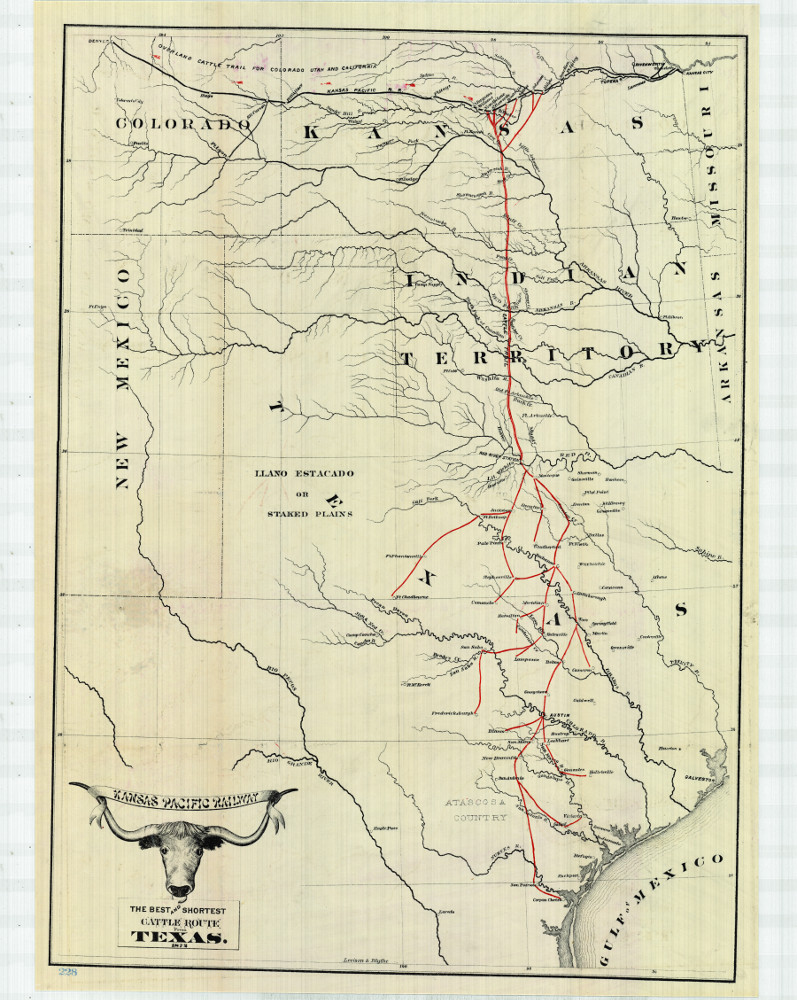
Kansas Pacific Railway
The Best and Shortest Cattle Route from Texas
St. Louis, 1872. Printed map, 20 x 14.5 inches.
Courtesy of Library of Congress Geography and Map Division. Reproduction 2019.
Modern fiction, movies, and television depict cattle drives as
an iconic image of the American West. In reality, they only
occurred from 1868 to 1886. Cowboys drove herds of 2,000 to
3,000 longhorn cattle from Texas ranches north through Indian
Territory to Kansas, as illustrated on this map. From Kansas
railheads, cattle were shipped east to stockyards and
slaughterhouses or west to mining towns and military posts.
The route provided sufficient grass, avoided tolls charged by
tribal nations, and veered around farms in eastern Kansas, but
the routes kept shifting westward to avoid expanding white
settlements. The success of the cattle industry hinged upon
the removal of Native people and wildlife.
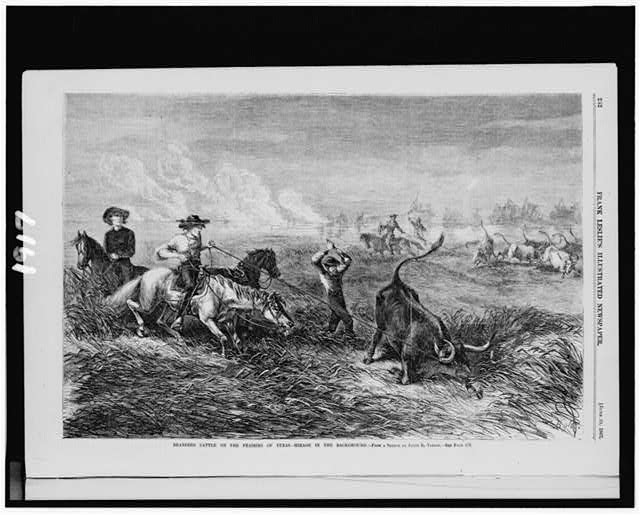
James E. Taylor (1839-1901)
“Branding Cattle on the
Prairies of Texas …” from
Frank Leslie’s Illustrated Newspaper
June 29,
1867. Wood engraving, 11 x 16 inches. Courtesy of
Library of Congress Prints and Photographs Division. Reproduction 2019.
During the late 19th century, engraved illustrations—like the
one seen here—became the first kinds of pictures that could be
produced cheaply and quickly. In this engraving, a man riding
a horse lassos a furious bull. Another man stands ready with a
brand to mark ownership, while cowboys guide groups of cattle
in the background. The engraving, and many others like it,
exalted the West as a place of excitement, where courageous
men could prove themselves by conquering animals and
nature.
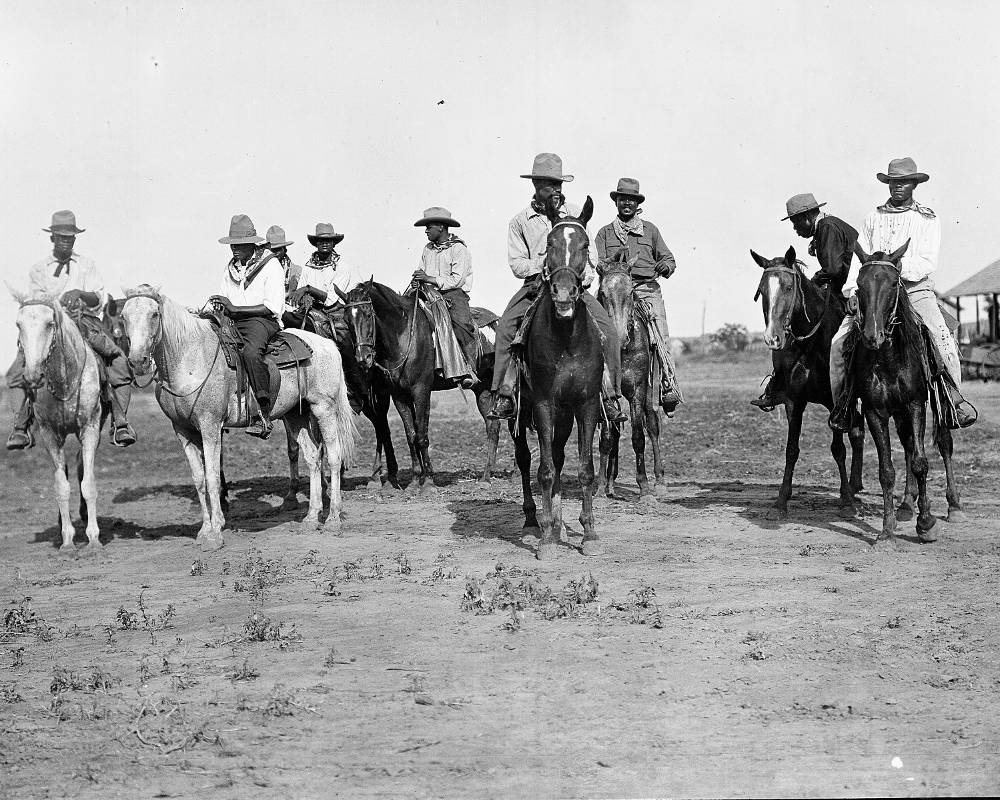
Erwin E. Smith (1886-1947)
“African-American Cowboys
with their Mounts Saddled Up.” 1911/1915, Photograph, 5 x 4
inches. Courtesy of
Amon Carter Museum of American Art, Fort Worth, Texas. Reproduction 2019.
The cowboys of popular culture have commonly been portrayed as
white Anglo men working on cattle drives in the West.
Historians estimate, however, that as many as one in three
cowboys were either Mexican or African American in the later
half of the 19th century. Many enslaved African Americans in
Texas were skilled in tending cattle from their work on
ranches. After the Civil War, these formerly enslaved men went
on to work as cowboys, one of the few jobs available to them.
While they faced discrimination from society at large, many
period sources suggest they experienced a degree of relative
equality within their cowboy crews.
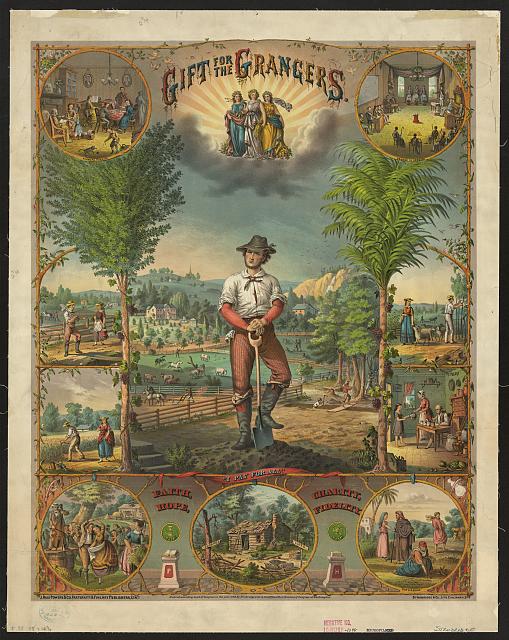
J. Hale Powers & Co.
Gift for the Grangers
Cincinnati, 1873. Chromolithograph, 21.5 x 17 inches.
Courtesy of
Library of Congress Prints and Photographs Division. Reproduction 2019.
A colorful poster portrays prosperous farmers to promote the
National Grange of the Order of Patrons of Husbandry. Founded
in 1867, the Grange, advocated for farmers’ political
interests, especially against powerful railroad companies and
provided an opportunity for farmers—men and women alike—to
socialize and learn about agricultural innovations. The
central illustration depicts a farmer, shovel in hand, in
front of his farm. Smaller images feature a Granger meeting, a
harvest dance, and men and women working on their farm.
According to this print, the Grangers helped farmers overcome
“ignorance” and “sloth” (as represented in the image in the
bottom middle) and improve their lives.
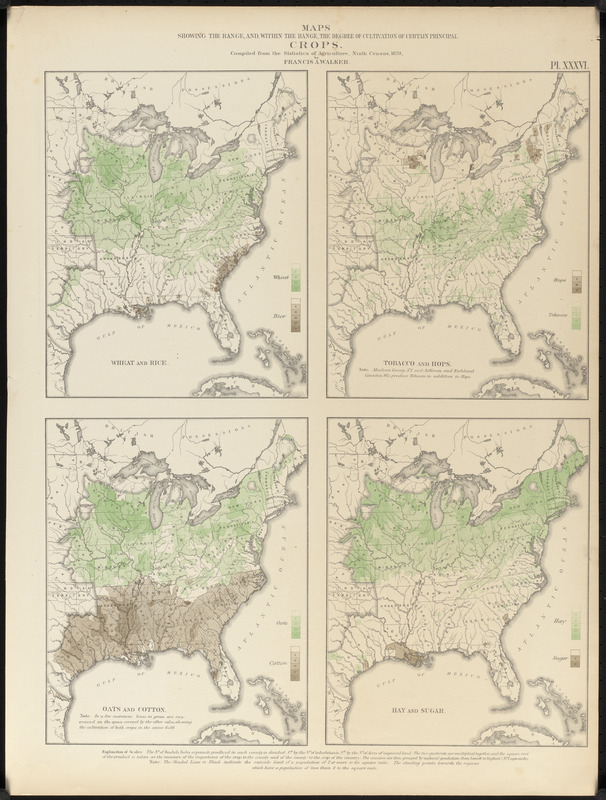
Francis A. Walker (1840-1897)
“Maps Showing the Range
… of Certain Principal Crops,” from
Statistical Atlas of the United States …
Washington, D.C., 1874. Printed map, 22 x 16.5 inches.
Leventhal Map and Education Center.
Agricultural production in the eastern United States is
represented by this plate from the statistical atlas
illustrating the 1870 census. There are four maps, each
showing the distribution and degree of cultivation of two
major crops. As the first national atlas, this prize-winning
volume was a landmark publication displaying an unprecedented
number of visual statistics and thematic maps. It was compiled
by Francis Amasa Walker, Superintendent of the ninth and tenth
censuses (taken in 1870 and 1880) and Commissioner of Indian
Affairs (1871-1872). Walker transformed the census, acquiring
and tabulating vast quantities of geographic information about
the rapidly expanding country. However, this furthered the
ability of the federal government to manage and control "the
Indian as an obstacle to the national progress," as Walker
described Native tribes in 1879.
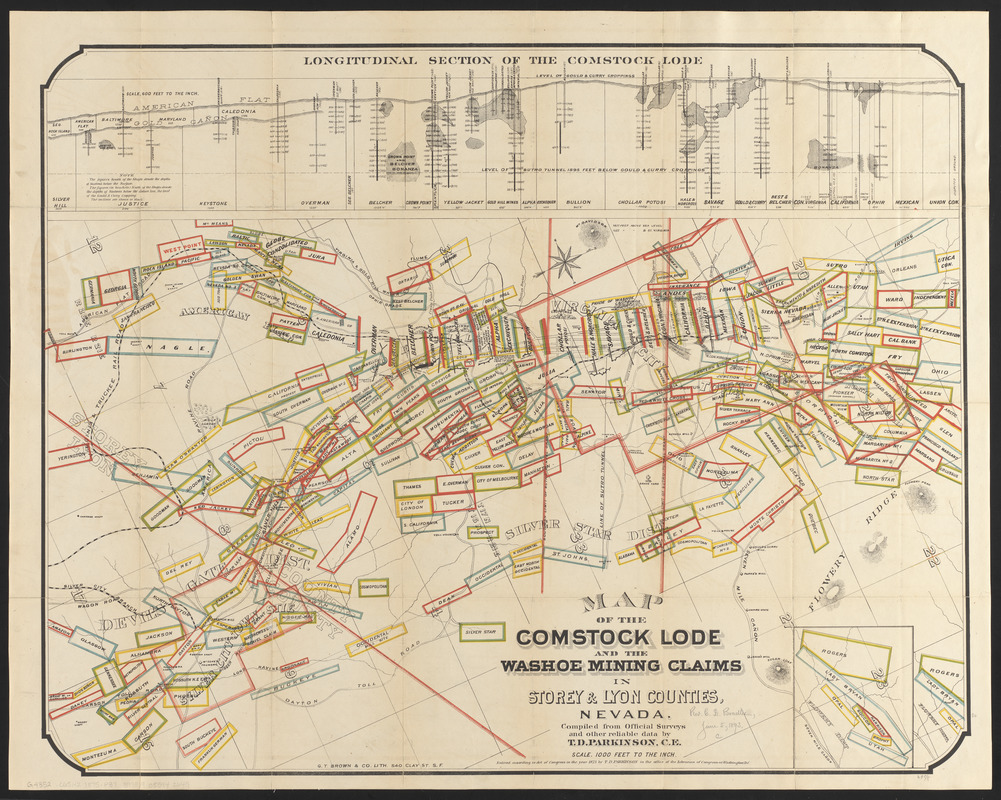
T.D. Parkinson
Map of the Comstock Lode and the Washoe Mining Claims in
… Nevada
San Francisco, 1875. Printed map, 25.5 x 32.5 inches.
Leventhal Map and Education Center.
In 1859, major deposits of silver known as the Comstock Lode were discovered on the Nevada side of the Sierra Nevada Mountains. Mining spurred the rapid growth of Virginia City, which reached a population of 15,000 by 1863, prompting Nevada’s statehood in 1864. This 1875 map delineates the boundaries of the many mineral claims while the cross sections indicate deep shafts to the silver deposits. Large debris piles at each mine’s entrance left a distinctive scar on the landscape.
VIEWPOINT: When the federal government codified place names, they often relied on local input, including derogatory terms which reflected cruel racial attitudes. This practice was especially frequent in mining towns, not because there were large numbers of African Americans, but because the presence of a single one was sufficiently conspicuous to suggest calling a place by a racial epithet. In this map, the offensive term “Nigger Ravine” appears towards the lower left. The name was replaced by “Negro Ravine” by the Board on Geographic Names in 1962. Stewart Udall, Secretary of the Interior at the time, explained why the agency had chosen to remove all instances of the word "Nigger" from federal maps: “I do not see how the Federal Government can in conscience require the use of the word in any connection.”
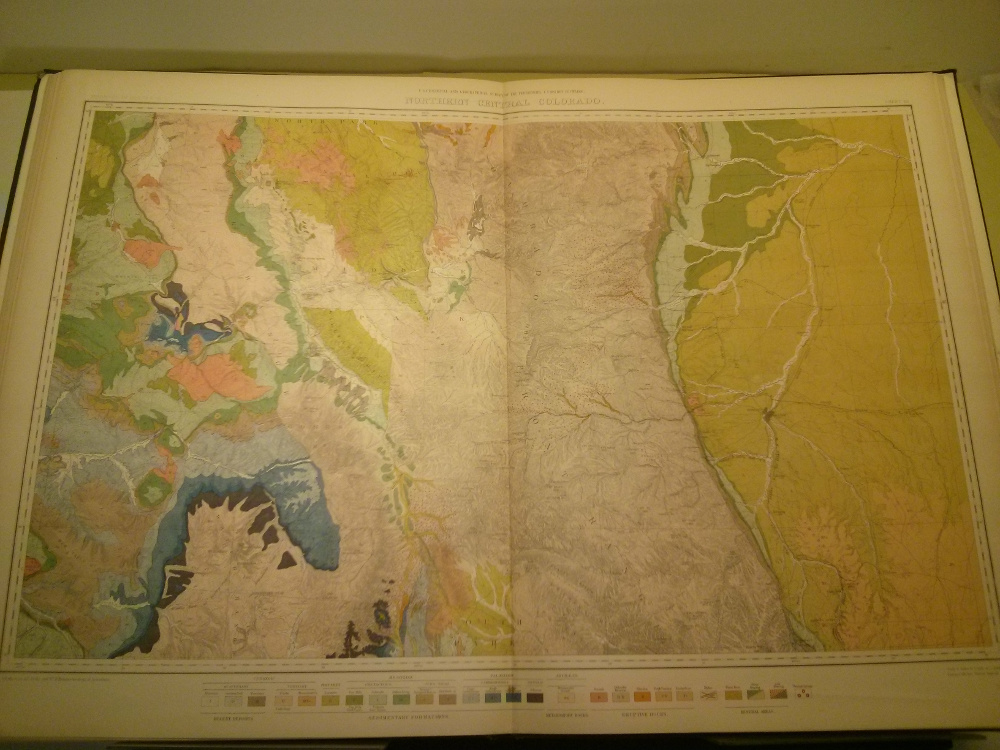
F. V. Hayden (1829–1887) and U.S. Geological and
Geographical Survey of the Territories
“Northern Central Colorado,” in
Geological and Geographical Atlas of Colorado and
Portions of Adjacent Territory.
[New York], 1877. Atlas plate, 27.5 × 21 inches.
Leventhal Map and Education Center.
Scientific expeditions consisting of geologists and
cartographers were sent out by the federal government to
document the landforms of the western states. The goal was not
simply to add to geographic knowledge, but also to identify
sources of mineral deposits and promote the development of a
mining industry. This 1877 atlas of Colorado shows the bedrock
geology in colors corresponding with the age and type of rock,
while formations likely to yield silver and gold are
identified with dotted patterns. A silver boom in 1879 led to
the establishment of quick-build mining towns, while Denver,
shown here towards the right center of the map, grew from just
over 4,000 people to more than 100,000 between 1870 and 1890.
Today, many of Colorado’s mountainous landscapes that were
once valuable for mineral extraction are now valuable for a
different purpose: outdoor activities like skiing and
backpacking.
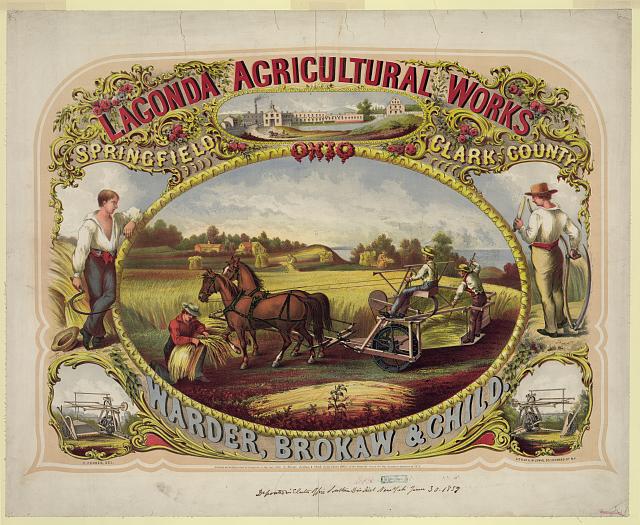
Edwin Forbes (1839-1895)
Lagonda Agricultural Works, Springfield, Clark County,
Ohio
New York, 1859. Chromolithograph, 24 x 30 inches.
Courtesy of Library of Congress Prints and Photographs Division. Reproduction 2019.
Many midwestern towns manufactured machinery to help farmers
increase their productivity. This colorful image advertises
the Lagonda Agricultural Works based in Springfield, Ohio. In
the center, three men demonstrate how to use one of the
machines. On the left and right, two men stand with manual
tools in their hand, yearning for this new technology. The
vignettes in the bottom corners showcase additional tools
available for purchase. It is no accident that the
advertisement portrays these farmers as uniformly white and
male. These characteristics embody physical ideals mirroring a
national identity that reinforced and benefited from
stereotypes of whiteness and western civilization.
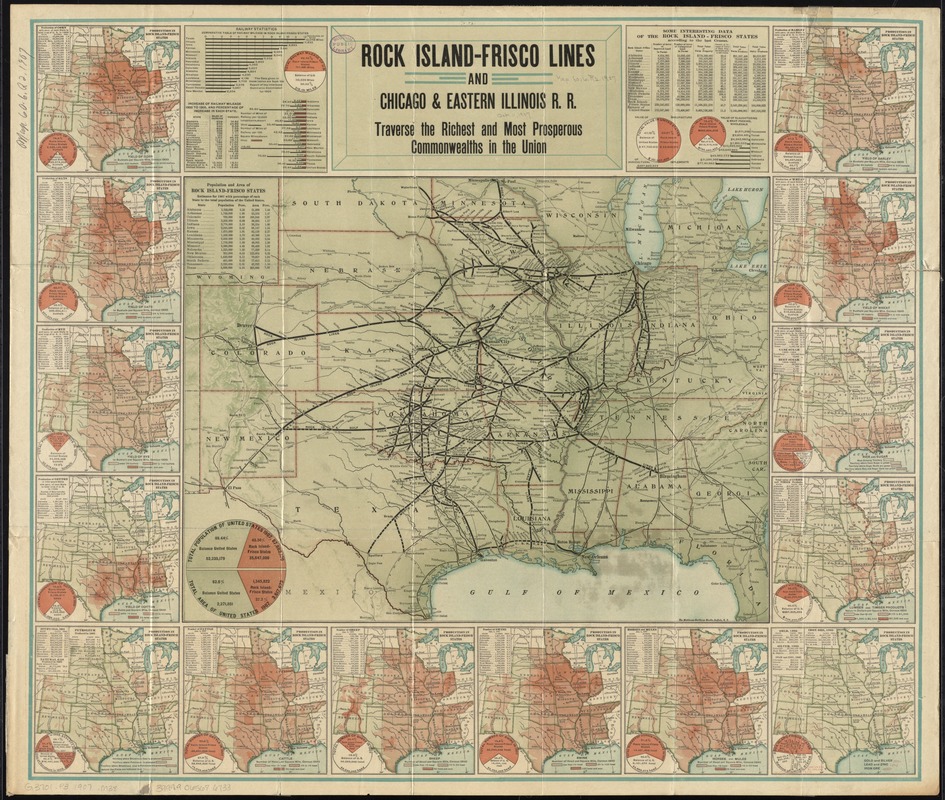
Matthews-Northrup Works
Rock Island-Frisco Lines and Chicago & Eastern
Illinois R.R. ...
Buffalo, 1907. Printed map, 13.5 x 18 inches.
Leventhal Map and Education Center.
This map, promoting the Rock Island, Frisco, and associated
rail lines, illustrates the variety and quantity of
agricultural commodities produced in the central third of the
country at the beginning of the 20th century. This region,
which included much of America’s richest agricultural lands,
encompassed 37 percent of the country’s total land area and 41
percent of its population. It produced over half of the crops
of corn, oats, wheat, cotton, rice, and sugar, and livestock
of cattle, swine, horses, and mules. Marginal inset maps and
pie diagrams demonstrate the geographic extent and percentages
of each agricultural product.
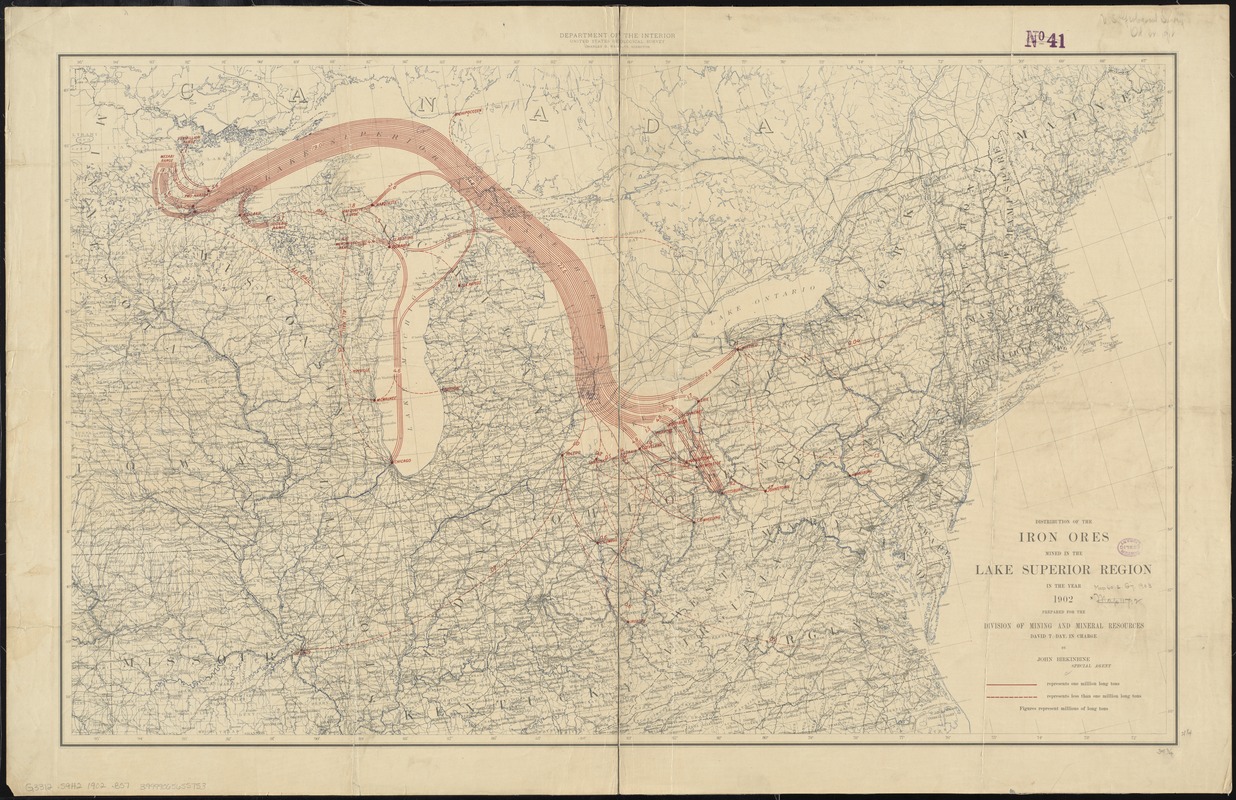
John Birkinbine (1844-1915)
Distribution of the Iron Ores Mined in the Lake Superior
Region in the Year 1902
Washington, D.C., 1902. Printed map, 21.5 x 35
inches. Leventhal Map and Education Center. Reproduction
2019.
This map depicts the geography of the iron and steel industry
during the last half of the 19th century when coke from coal
was introduced into the manufacturing process. Consequently,
iron and steel factories moved closer to the coal sources,
since coal was bulkier and more expensive to transport than
iron ore. This map uses flow lines, a graphic statistical
device innovative for the time, with the width of the lines
representing the tonnage of iron coming from Michigan’s Upper
Peninsula and northeastern Minnesota and shipped to ports in
the lower Great Lakes, including Chicago, Toledo, Cleveland,
Erie, Buffalo, and Pittsburgh.
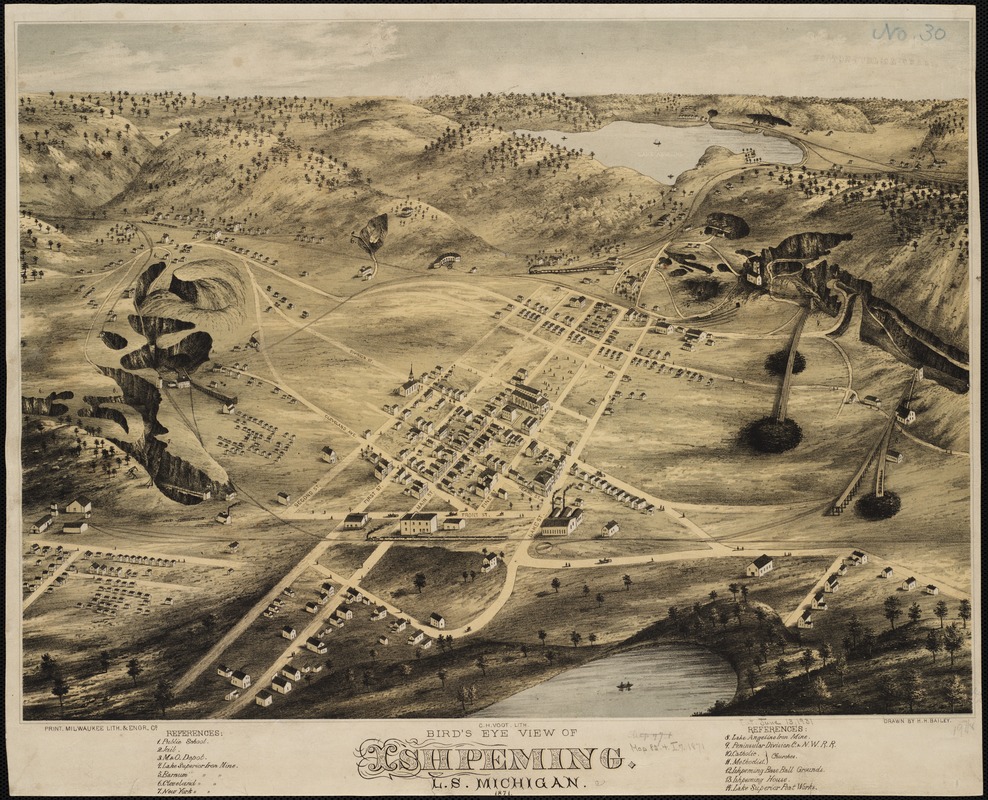
Howard Heston Bailey (1836-1878)
Bird's Eye View of Ishpeming, L.S. Michigan
Milwaukee, 1871. Printed map, 15 x 29 inches.
Leventhal Map and Education Center.
The Lake Superior region became the nation’s major supplier of
iron ore after its discovery in Michigan’s Upper Peninsula in
the 1840s, while reservations were established and Anishinaabe
(Ojibwe) lands were ceded. This view of Ishpeming, Michigan,
provides an example of an iron mining community and the
effects of mining operations on the surrounding landscape. The
shaded areas on the surrounding hills depict open-pit iron
mines. In the foreground, a train cuts across the landscape
toward one mine, while a network of railroad tracks service
other mines. Laid out in 1869, the town grew rapidly, reaching
a population of 6,000 by the time this view was published.
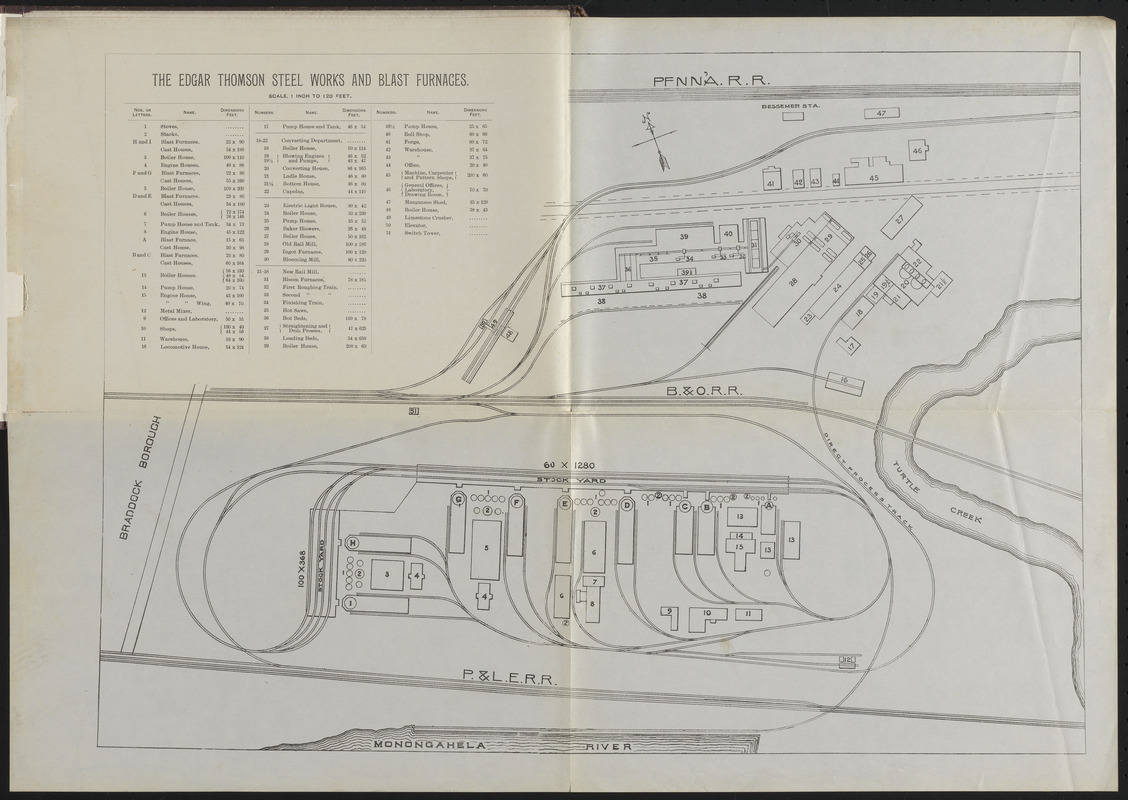
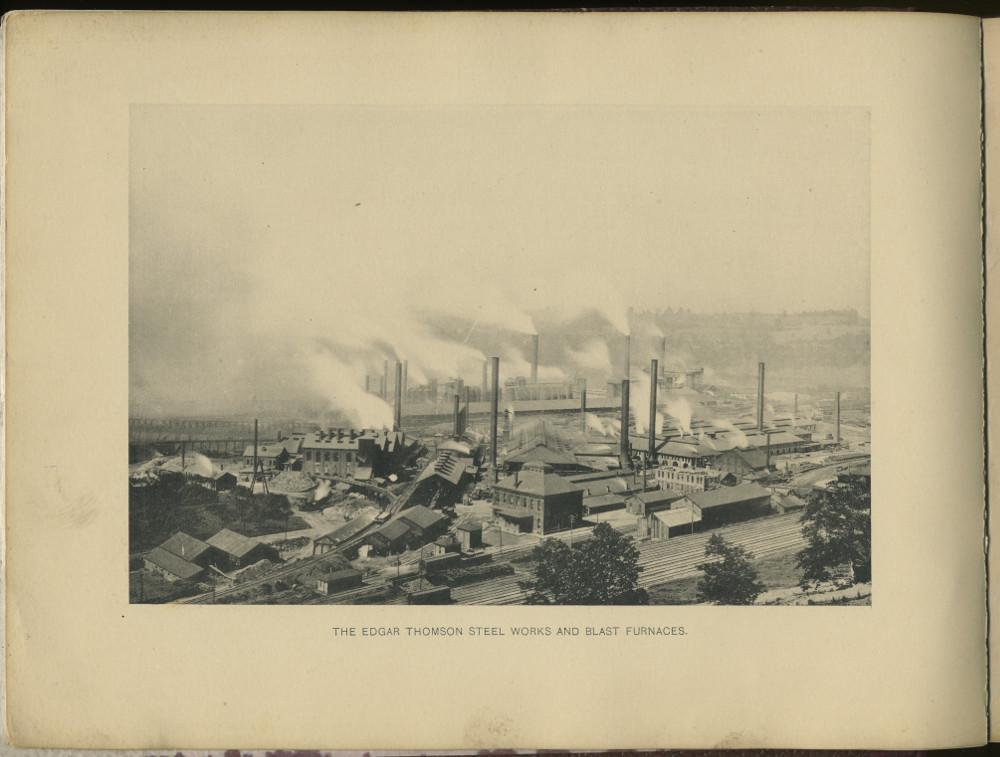
Andrew Carnegie (1835-1919)
[Site Plan] and
[Photograph] in
The Edgar Thomson Steel Works and Blast Furnaces
Pittsburgh, 1890. Printed plan, 14 x 20 inches;
photographic print, 7.5 x 10 inches. Courtesy of Lawrence
Caldwell. Reproduction 2019.
By the second half of the 19th century, anthracite and
bituminous coal fueled the iron industry. As a result, iron
furnaces and steel mills were larger complexes located near
midwestern coalfields, with iron ore transported more cheaply
from the upper Great Lakes region. The Edgar Thomson Steel
Works, near Pittsburgh, exemplifies this trend. Constructed by
Andrew Carnegie in the 1870s and today owned by U.S. Steel, it
is one of the few steel manufacturers still in operation in
the United States. This site plan identifies individual
buildings while the photograph shows smoke billowing from the
chimney, then a symbol of a growing economy.
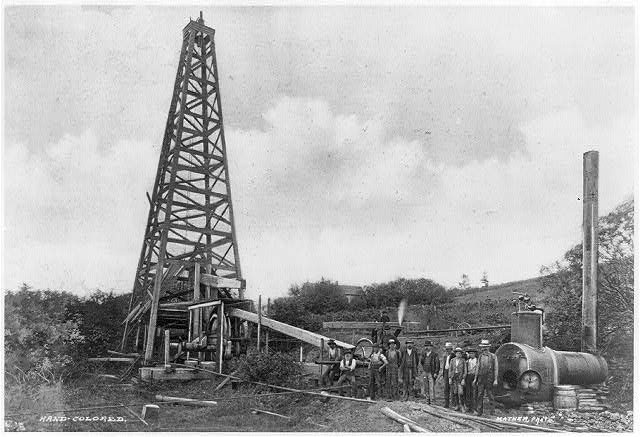
Oil Rig at Titusville, Pa.
Photo by Mather,
ca. 1900. Photographic print, 6.5 x 9 inches. Courtesy of Library of Congress Prints and Photographs Division. Reproduction 2019.
Pennsylvania was one of the first states where mineral
resources were exploited. Besides the anthracite coal fields
in the northeastern part of the state, there were other
resources like bituminous coal and petroleum. With the first
successful oil well, drilled in 1859 by Edwin Drake near
Titusville, Pennsylvania oil fields became the nation’s major
petroleum producer during the last half of the 19th century.
This photograph depicts a typical oil rig in the Titusville
area. By the early 20th century, newly opened fields in
northern Ohio, Texas, Oklahoma, and California surpassed
Pennsylvania’s oil production.
3a. TRANSPORTATION 1800-1862: Making Connections by Road, Water, and Rail
At the beginning of the 1800s, the West was not an impenetrable, uncharted wilderness. Tribal nations had developed extensive trading networks via a web of navigable streams, rivers, lakes and overland trails. Many of the routes followed by early explorers and fur traders traced well-established trails forged by Native people. As the U.S. government planned for expansion, locations for roads, canals and railroads were pursued based on potential profits for investors.
Because of poor road conditions, traveling by water was initially the most efficient option. Travel became faster and less costly over the course of the century. Landmarks in transportation technology started with the introduction of the steamboat, which made travel up the Mississippi and other rivers possible. The completion of the Erie Canal in 1825 connected the Atlantic Ocean to the Great Lakes, and the first railroad made its inaugural trip in 1830.
Congress later made large land grants to help finance the
construction of transcontinental railroads. By the end of the
century, a complex network of railroads crisscrossed the
nation and made speedy and inexpensive land travel possible
for moving people and manufactured goods.
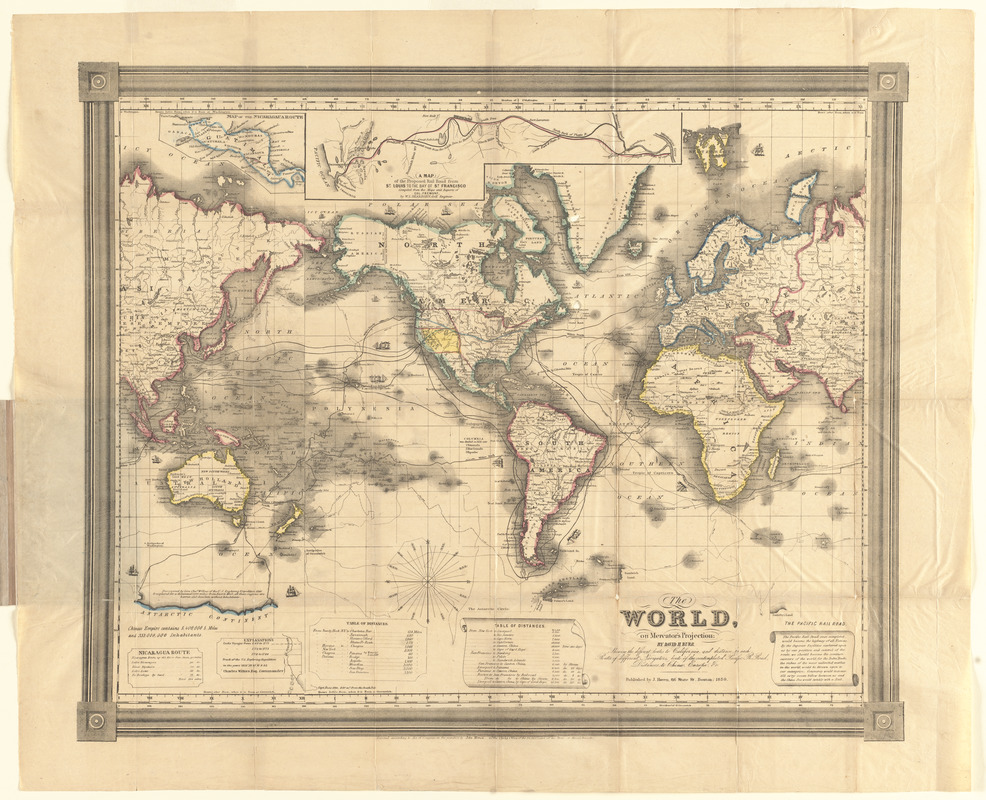
David Burr (1803–1875)
“The World on Mercator’s
Projection, Showing the Different Routes to California …
“
Boston, 1850. Printed map, 18.5 x 22.5 inches.
Leventhal Map and Education Center.
During the first half of the 19th century, it was not easy to
travel from the East to the West Coast. This map, published
after the discovery of gold in California, displays several
possibilities. One route was the lengthy ocean voyage from the
East Coast, around the southern tip of South America, to San
Francisco. Quicker alternatives, lasting one to three months,
combined ocean travel with a short land passage across Central
America. Travelers could also cross North America via the
Oregon Trail, which took four to six months. While this map
appears to emphasize ocean navigation, it also promoted a
proposed railroad route from Saint Louis to San Francisco.
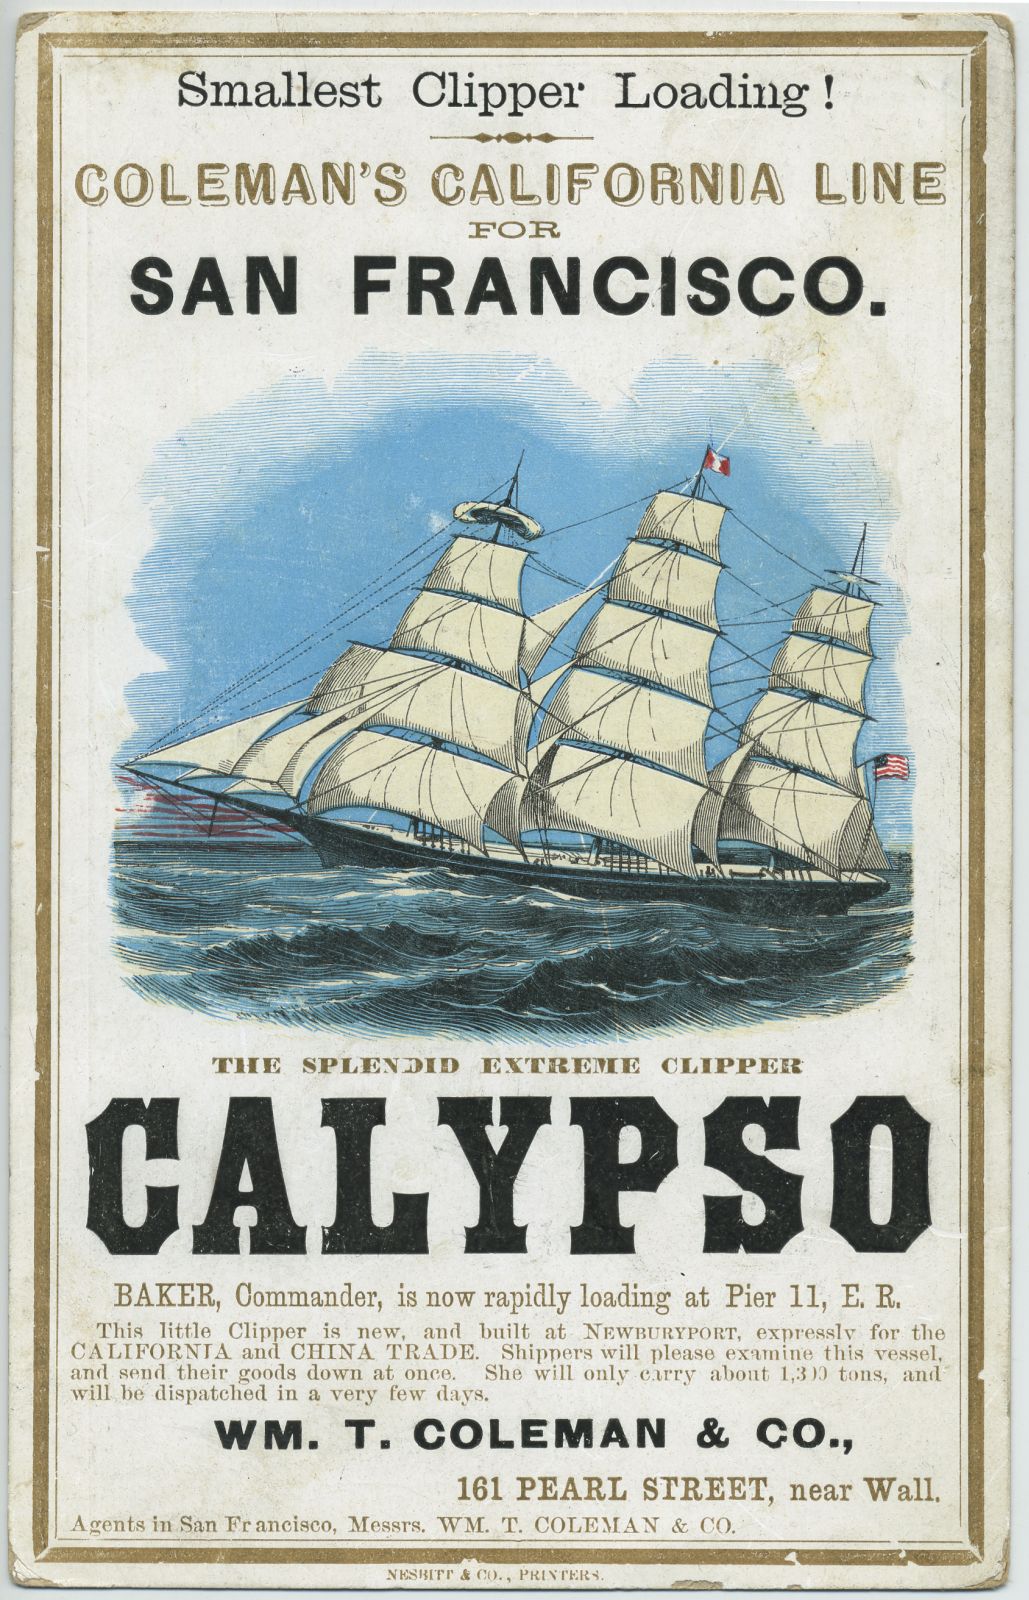
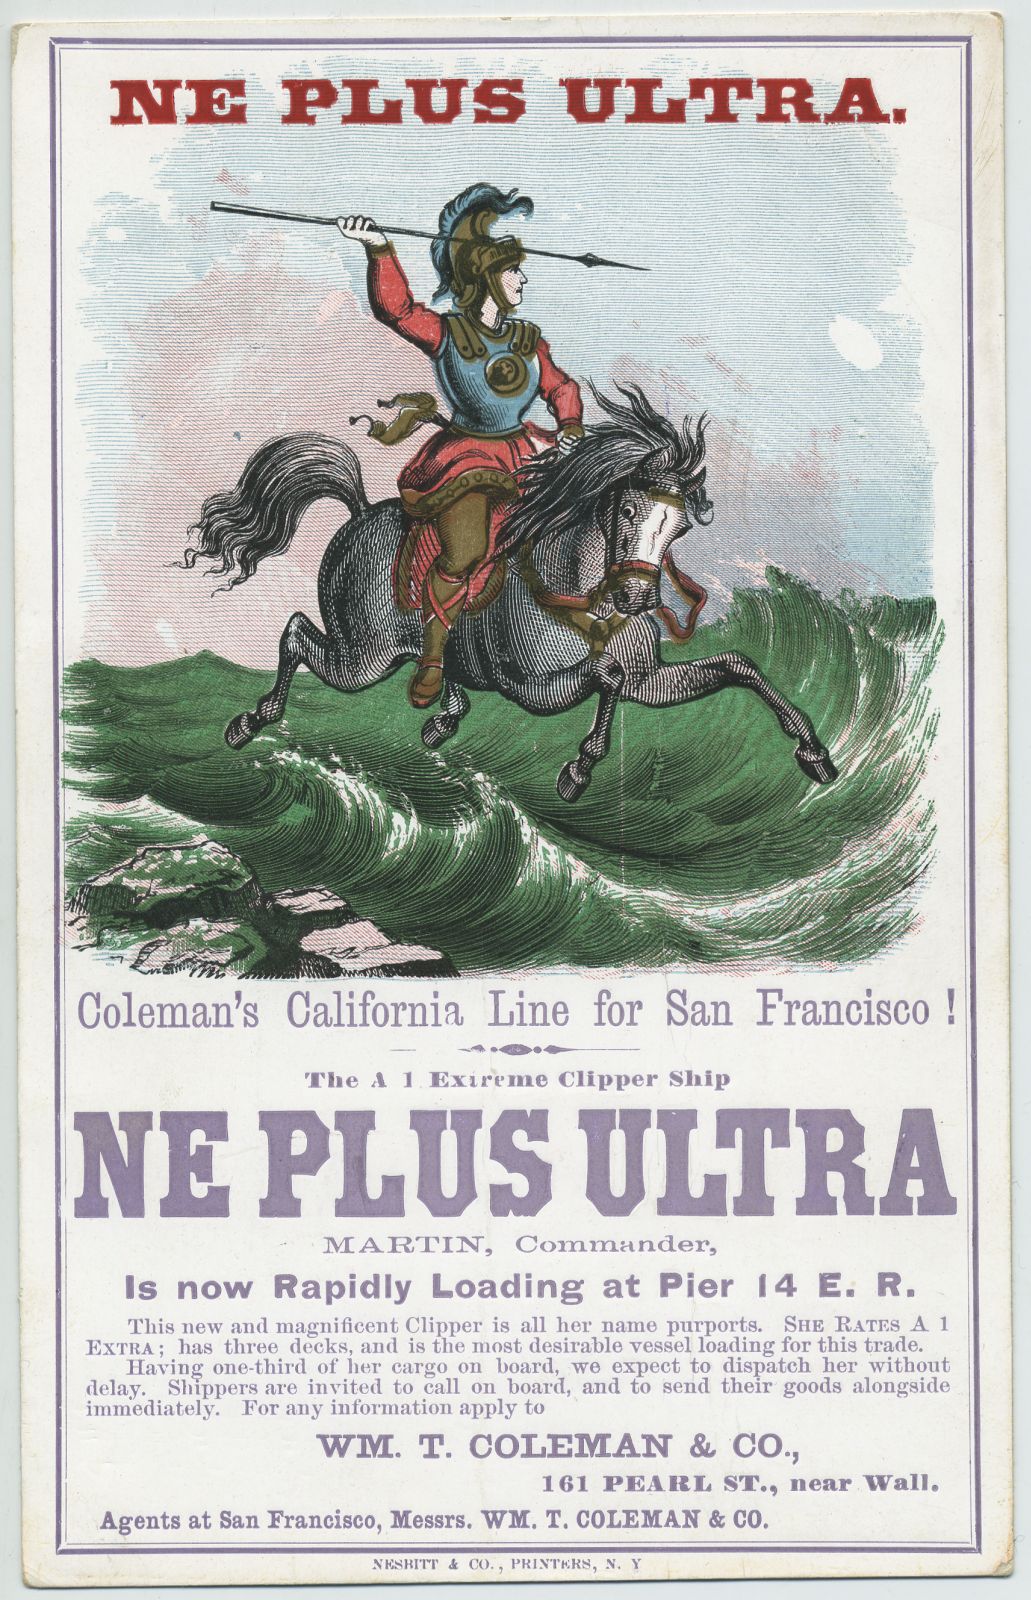
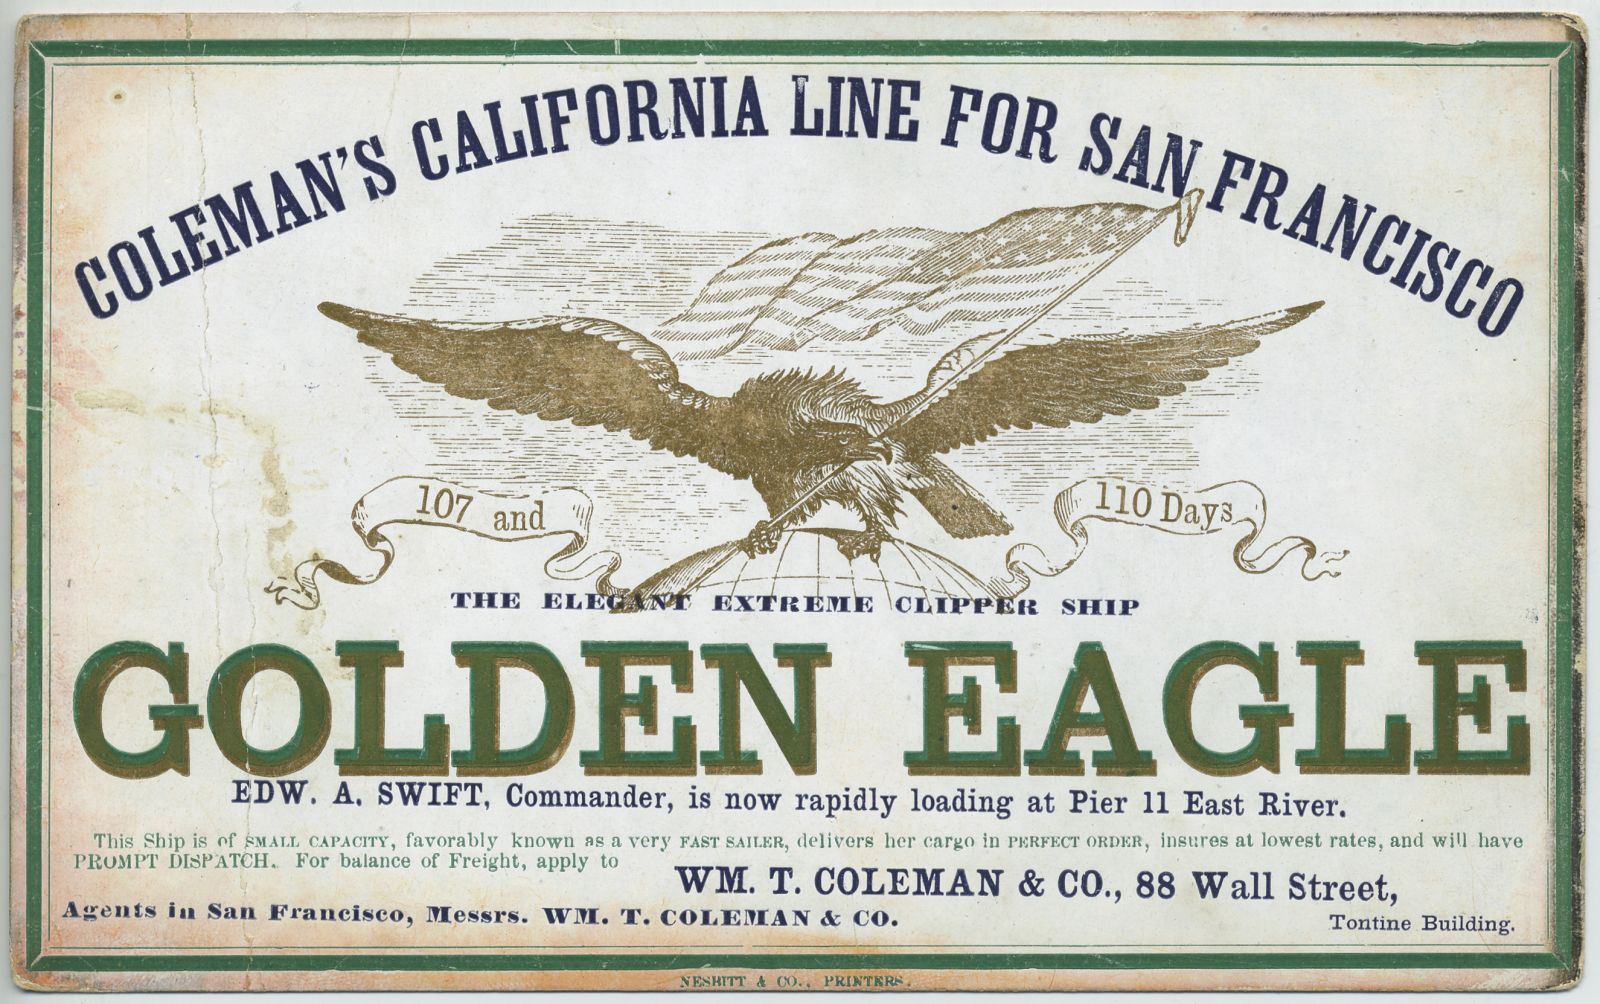
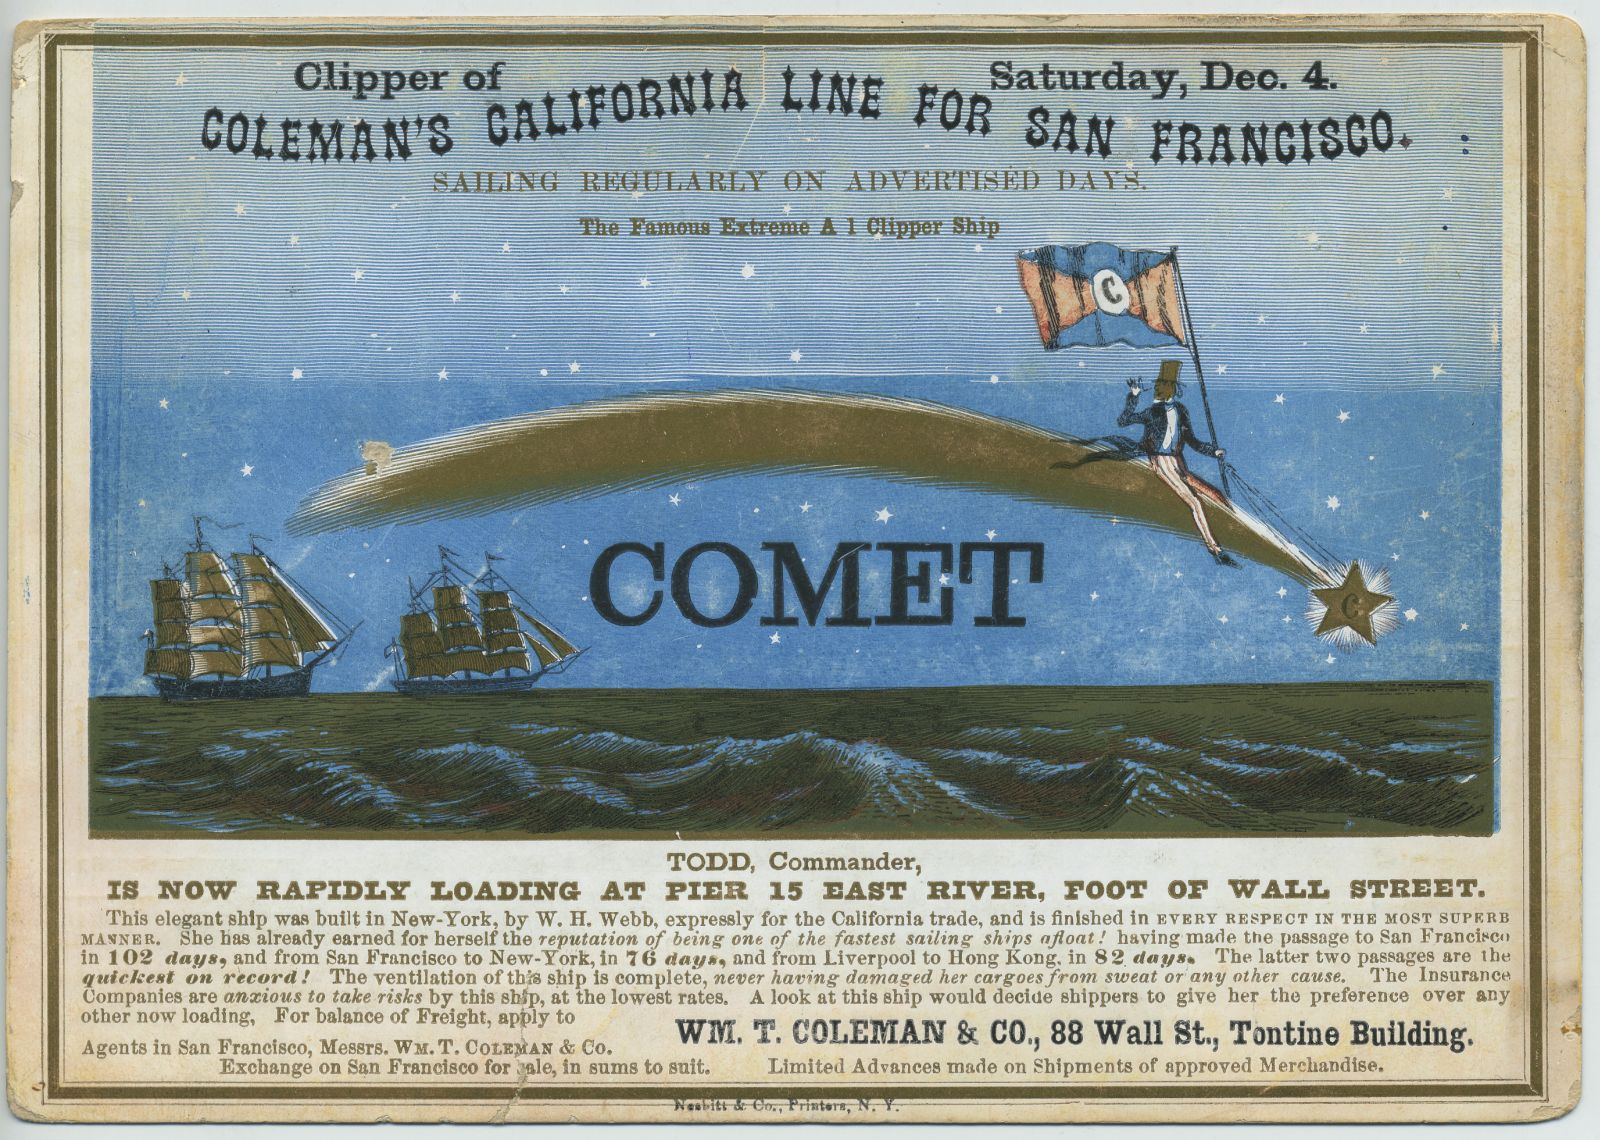
“Calypso,” “Ne Plus Ultra,” “Golden Eagle,” and “Comet”
Printed
cards, each 7 x 4 inches. Courtesy of Lawrence Caldwell.
In the 1840s and 1850s, the use of speedy clipper ships for
ocean navigation boomed. These ships proved vital for the
China trade and travel to California during the Gold Rush.
American clipper ships, characterized by three tall masts and
square rigging, were first built in Baltimore, but some of the
fastest were constructed in East Boston and Medford,
Massachusetts. These promotional cards provide evidence of the
role clipper ships played in mid-19th century transportation.
Such cards, which date from the 1850s and 1860s, advertised
the departure of individual ships, primarily from New York and
Boston to San Francisco.
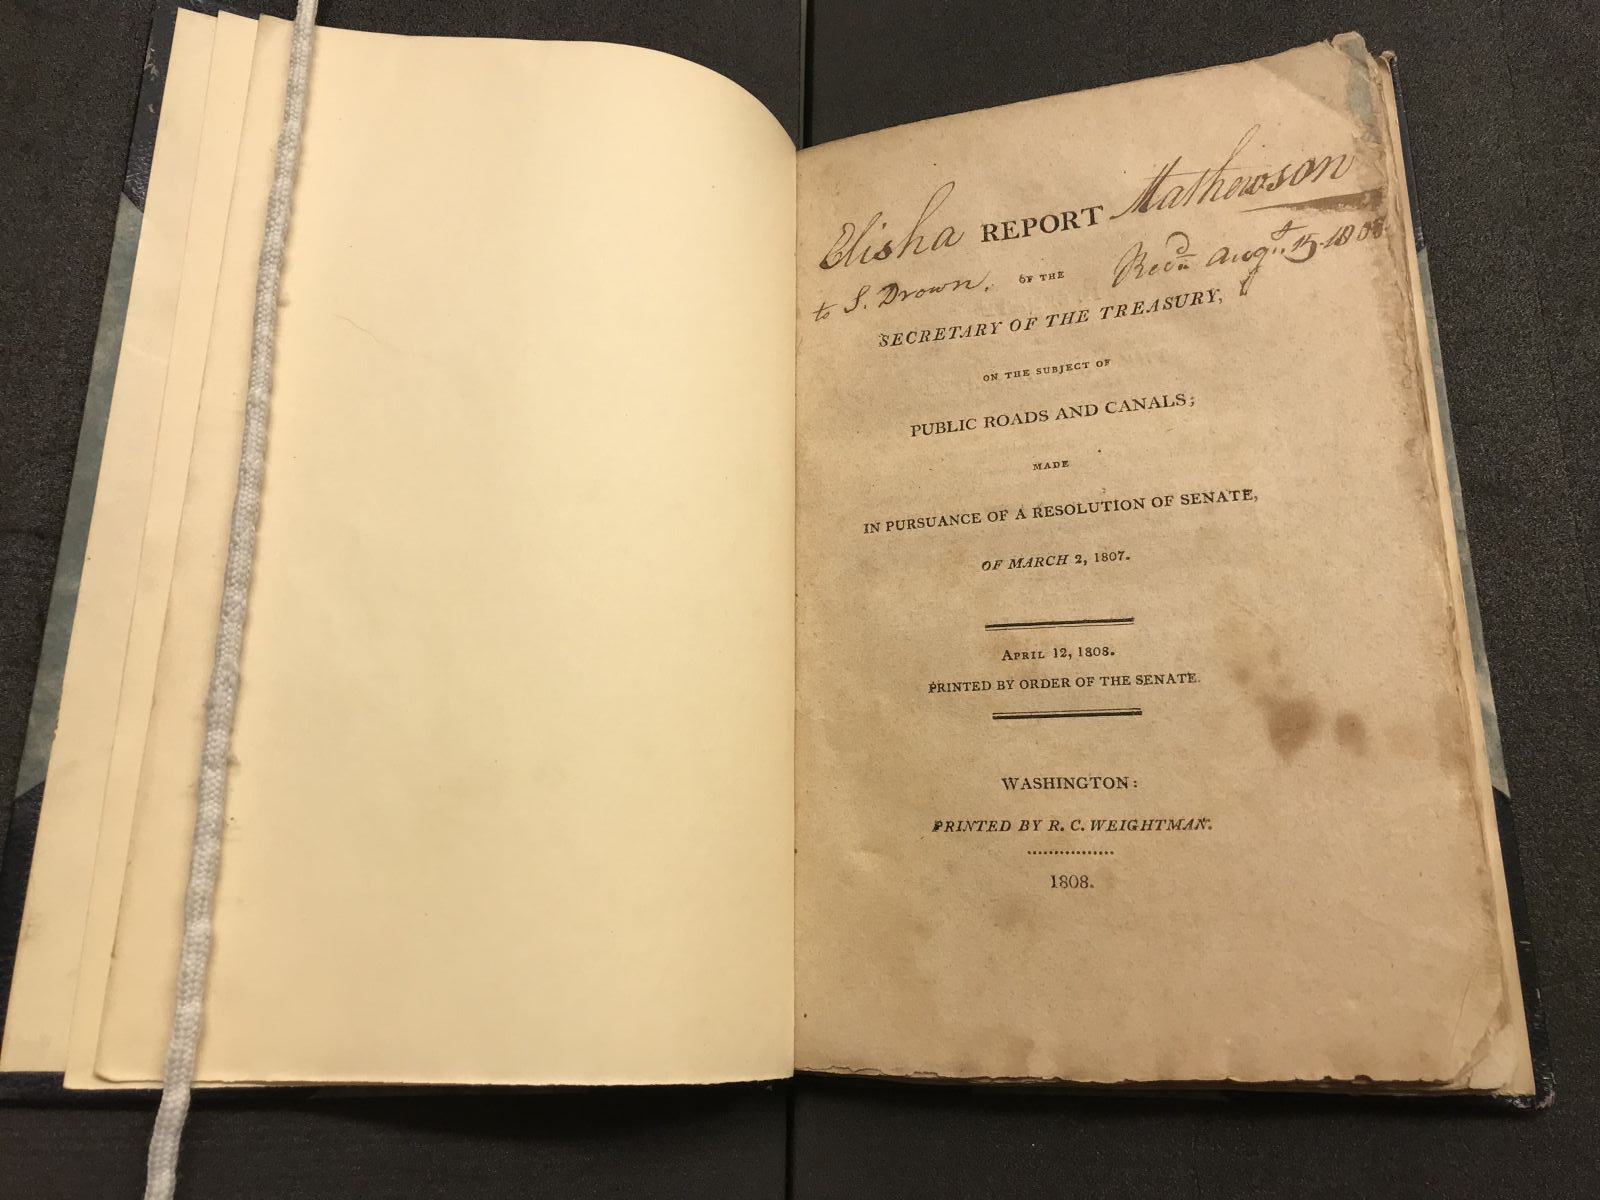
Albert Gallatin (1761–1849)
“Report of the Secretary
of the Treasury, on the Subject of Public Roads and
Canals”
Washington, DC, 1808. Printed title page, 9 x 6
inches. Courtesy of Lawrence Caldwell.
While serving as Thomas Jefferson’s Secretary of the Treasury,
Albert Gallatin developed a comprehensive plan for the
construction of a national system of roads and canals to be
financed by the federal government. His report called for
canals and a national turnpike along the Atlantic seaboard, as
well as canals connecting the Atlantic rivers with the western
rivers, St. Lawrence River and Great Lakes. Although Congress
rejected the plan, it was visionary. Several proposals, such
as the National Road and the Erie Canal, were eventually
completed using a combination of federal, state, local or
private funds.
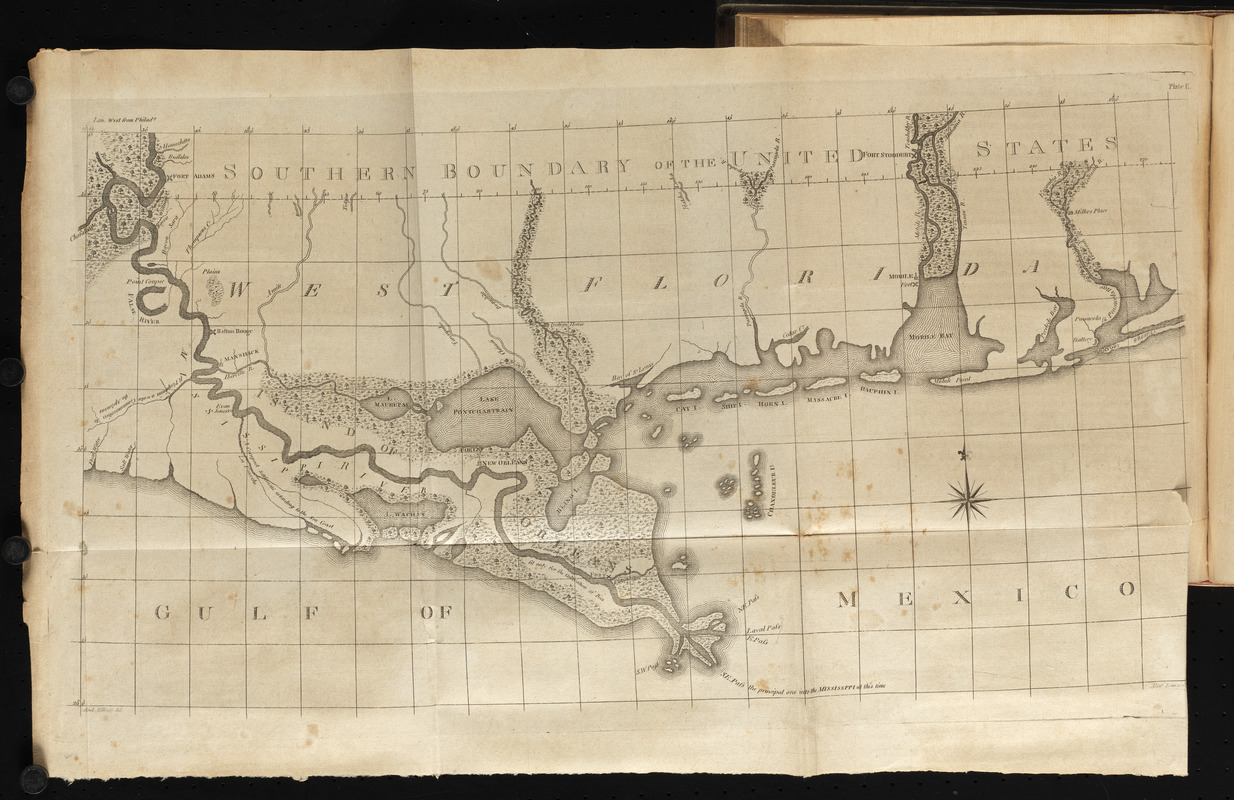
Andrew Ellicott (1754–1820)
“Map of Lower Mississippi
River” from “The Journal of Andrew Ellicott …”
Philadelphia, 1803. Printed map, 14 x 28 inches. Courtesy
Lawrence Caldwell.
This map showing the meandering course of the Lower
Mississippi River and seven other maps of the Mississippi and
Ohio Rivers prepared by Andrew Ellicott highlight the
significance of the two rivers for travel in the interior part
of the United States. Ellicott, best known for surveying the
boundaries of the District of Columbia and completing the plan
for the new capital city in 1791–1792, was commissioned by
President George Washington to survey the nation’s
southwestern boundary with Spanish West Florida. Ellicott’s
observations from 1796–1800 were published in 1803, when
interest in the geography of the newly acquired Louisiana
Territory gained national attention.
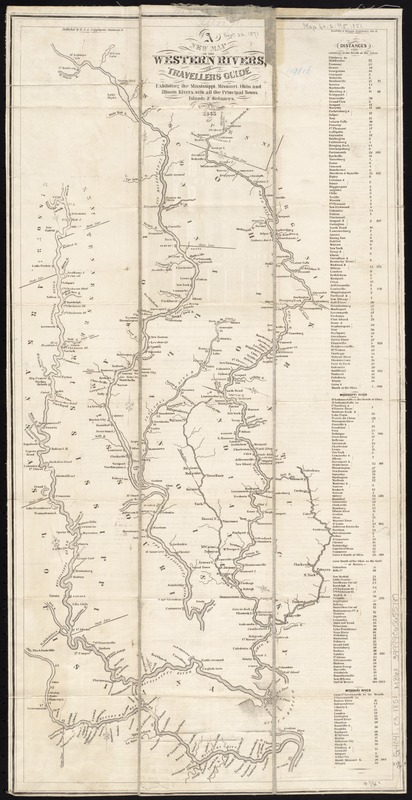
Samuel B. Munson (1806–1880)
“A New Map of the Western
Rivers, or, Travellers Guide …”
Cincinnati, 1851.
Printed map, 22 x 11 inches. Leventhal Map and Education
Center.
This map, designed for travelers, compressed the Mississippi
River and its major tributaries—the Ohio, Illinois, and
Missouri—onto one compact sheet, providing a succinct guide to
towns and distances along the navigable portions of the
rivers. The Mississippi River and its tributaries provided
transportation arteries for exploration, commerce, and travel.
Starting in the early 19th century, steamboats dominated
transportation on these navigable rivers. Canals, also
introduced in the early 19th century, improved transportation,
but they required significant investments into infrastructure.
Steamboats, on the other hand, could travel on existing
waterways and, unlike boats that relied on sails, against the
current.
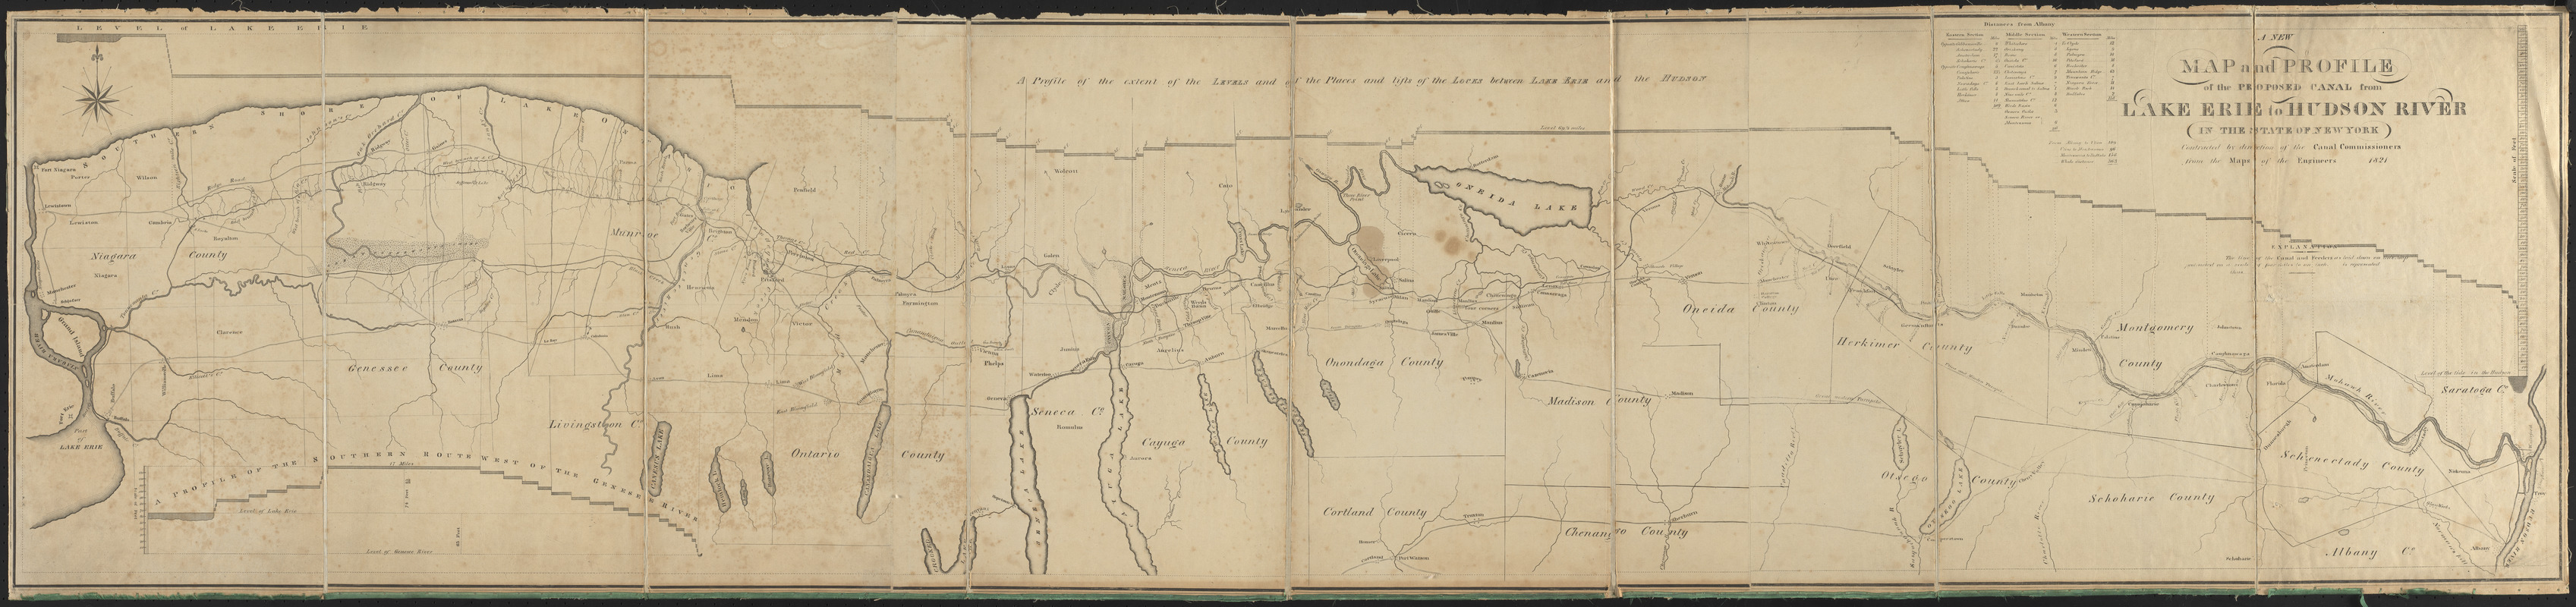
New York Canal Commissioners
“A New Map and Profile of
the Proposed Canal from Lake Erie to Hudson River …”
New York, 1821. Printed map, 16 x 68 inches. Courtesy of
Lawrence Caldwell. Reproduction, 2019.
The Appalachian Mountains presented an obstacle for traffic
flow from the Atlantic seaboard to the Midwest. After
considering various projects to cross this barrier, the New
York state government built the Erie Canal. Constructed from
1817 to 1825, the canal extended 363 miles connecting Albany
(on the Hudson River) with Buffalo (on Lake Erie). Taking
advantage of a natural break in the mountain chain, the route
climbed an elevation of 568 feet, using 83 locks and 18
aqueducts, as depicted on this 1821 plan. Its successful
completion and profitable operation ushered in an era of canal
building in the United States.
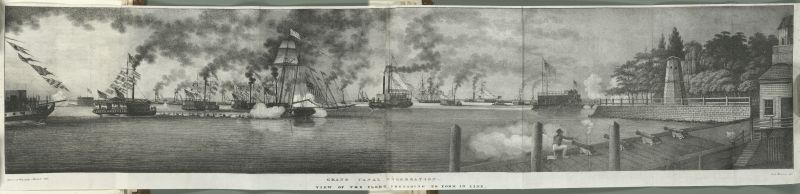
Archibald Robertson (1765–1835)
“Grand Canal
Celebration . . .” from “Memoir Prepared at . . . the
Celebration of the Completion of the New York Canals”
New
York, 1825. Printed view, 10 x 47 inches. Courtesy of
New York Public Library.
Reproduction, 2019.
This engraving, originally published in 1825, documents the
jubilant celebration of the Erie Canal’s completion held in
New York City’s Harbor. A fleet of boats assembled for the
occasion. Their tall masts display their colors as well as the
American flag. New York City, already the nation’s largest
city, benefited the most from the canal’s success. Between the
canal’s completion in 1825 and 1850, the city’s population
grew from 180,000 to 700,000. This rapid growth resulted from
increased commerce, via the Hudson River and Erie Canal, with
a hinterland that encompassed the Great Lakes and Mississippi
River Valley.
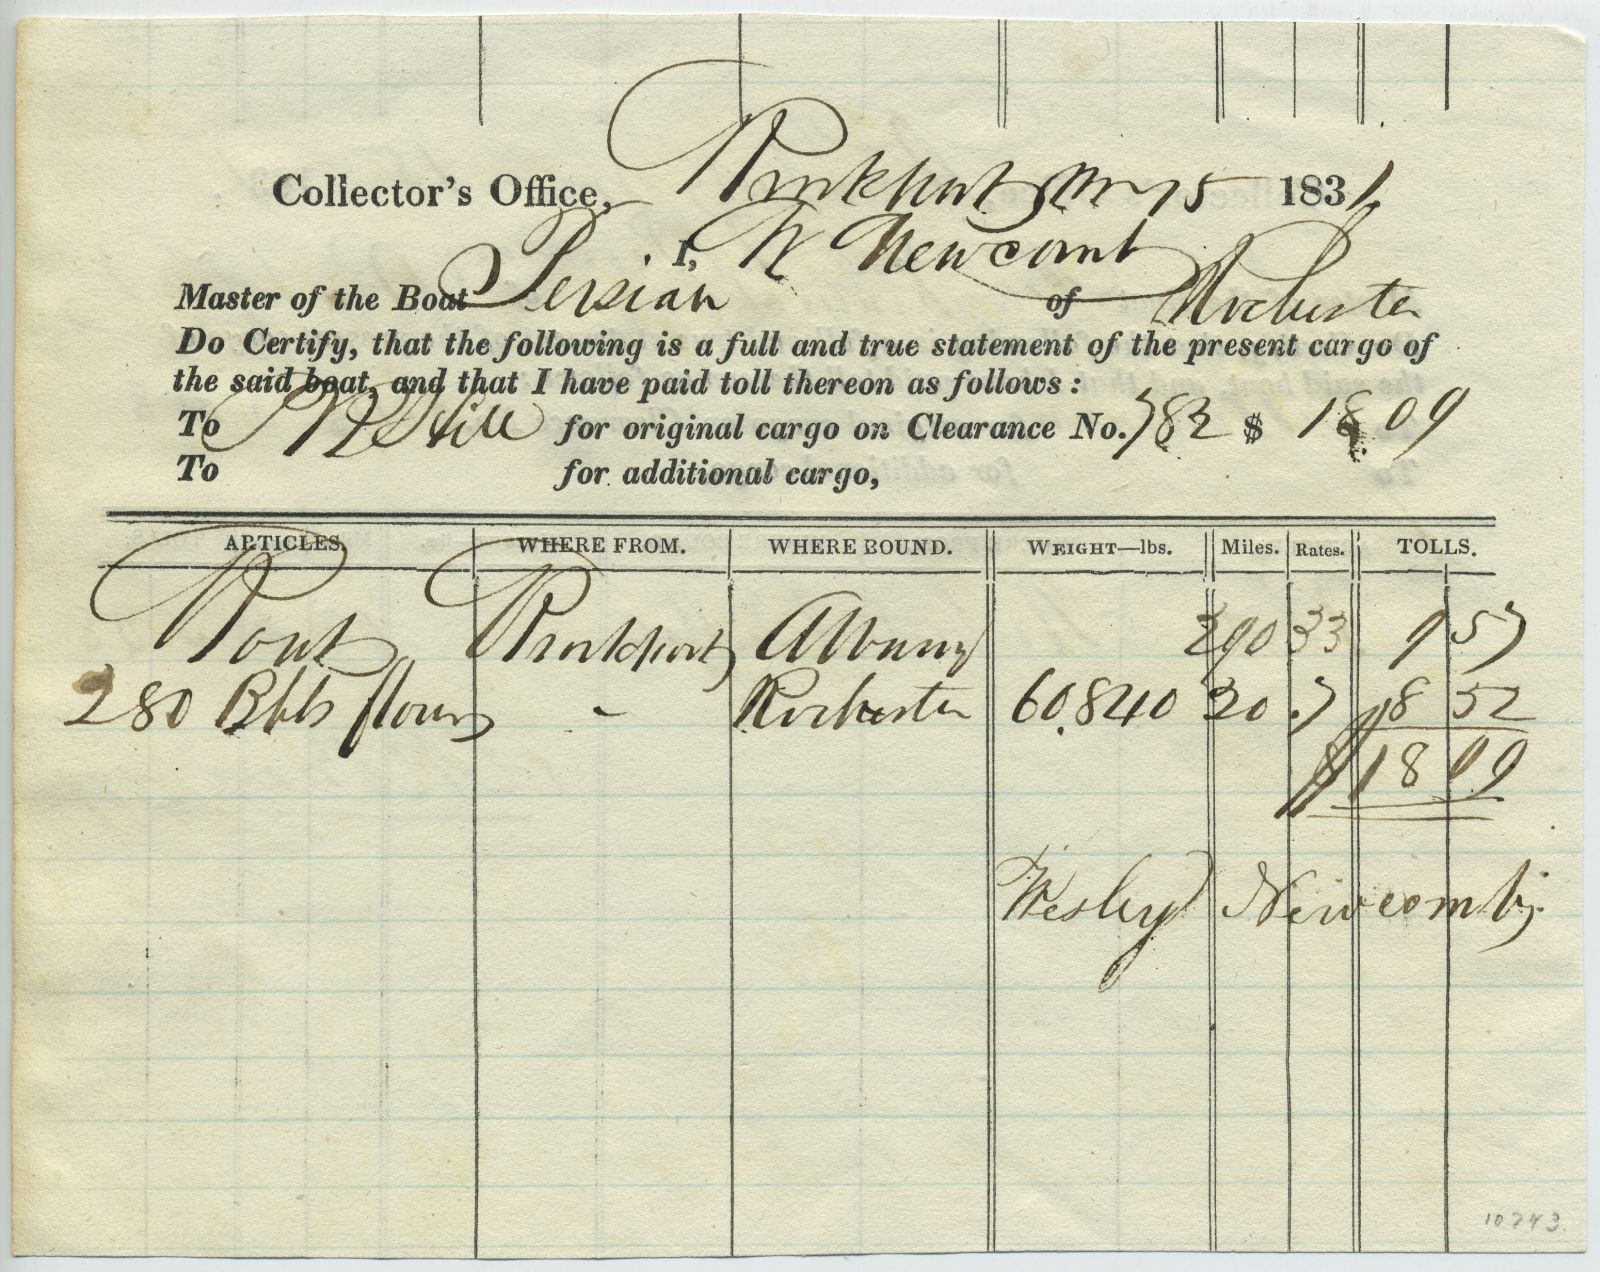
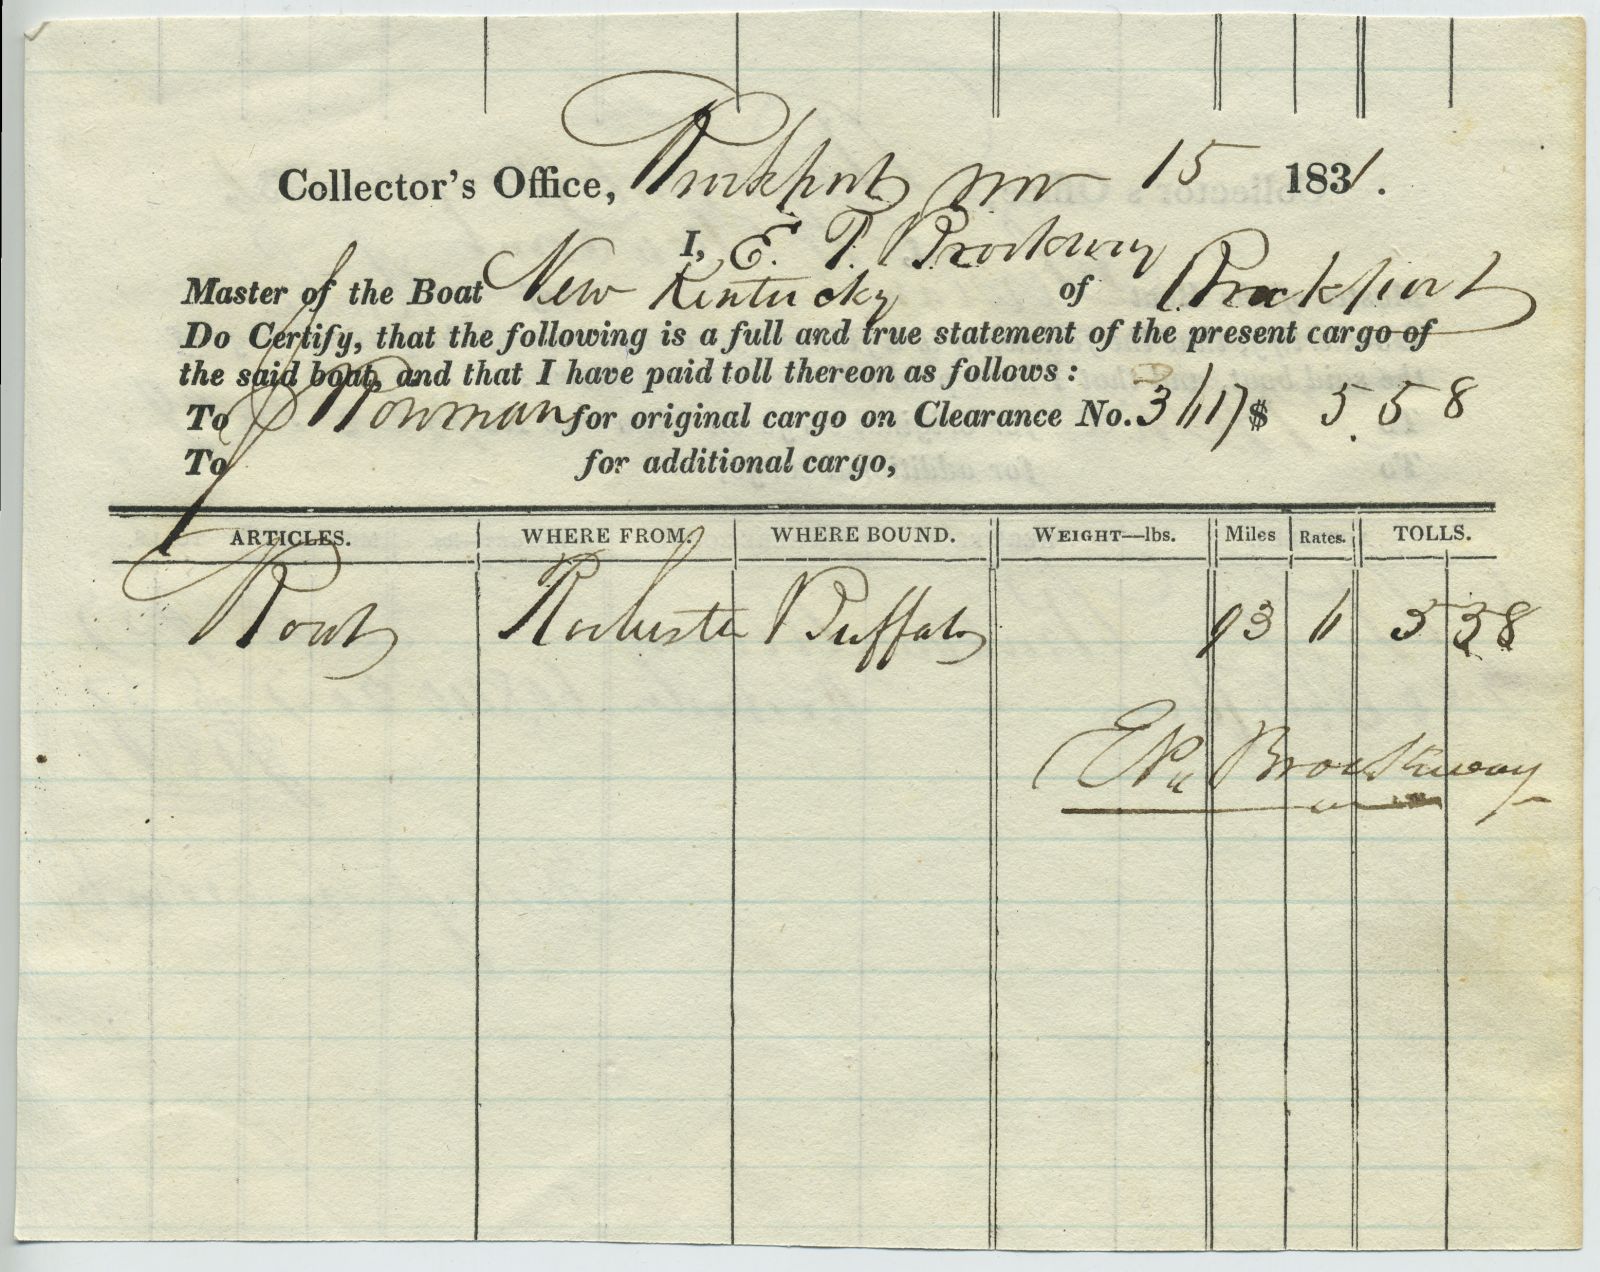
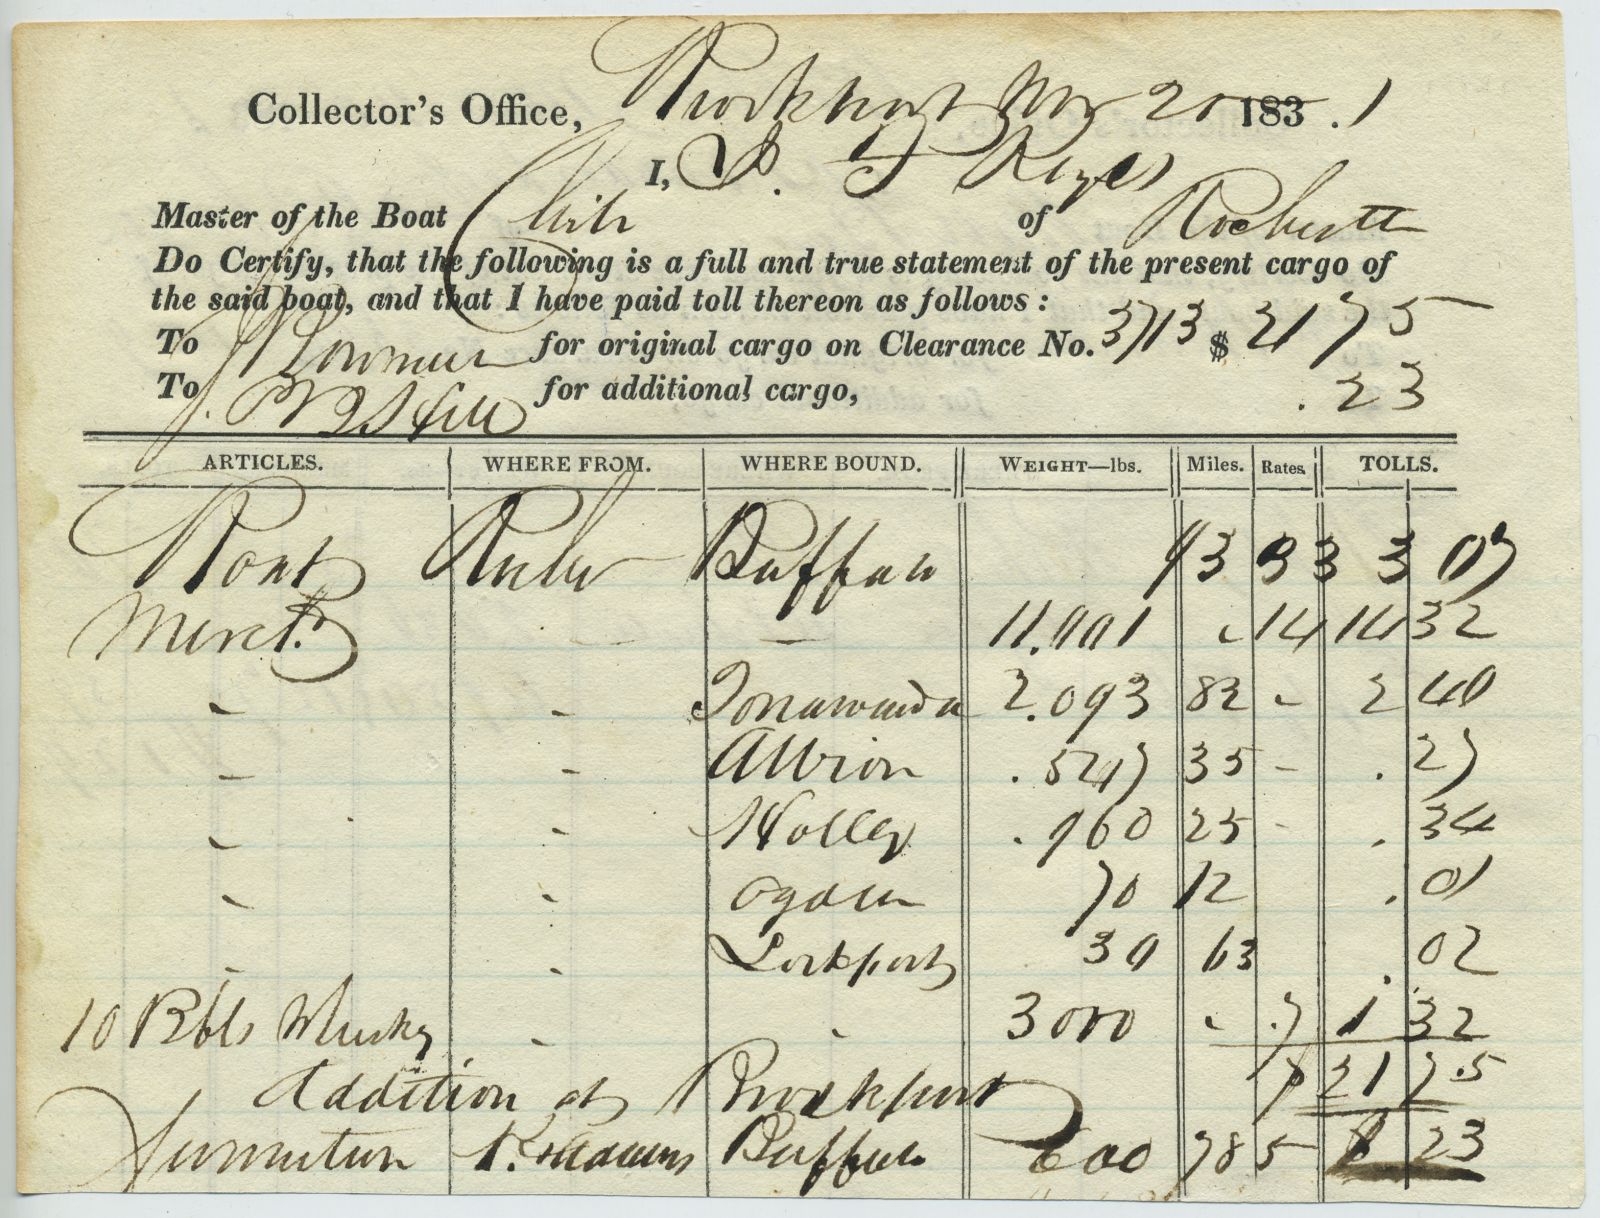
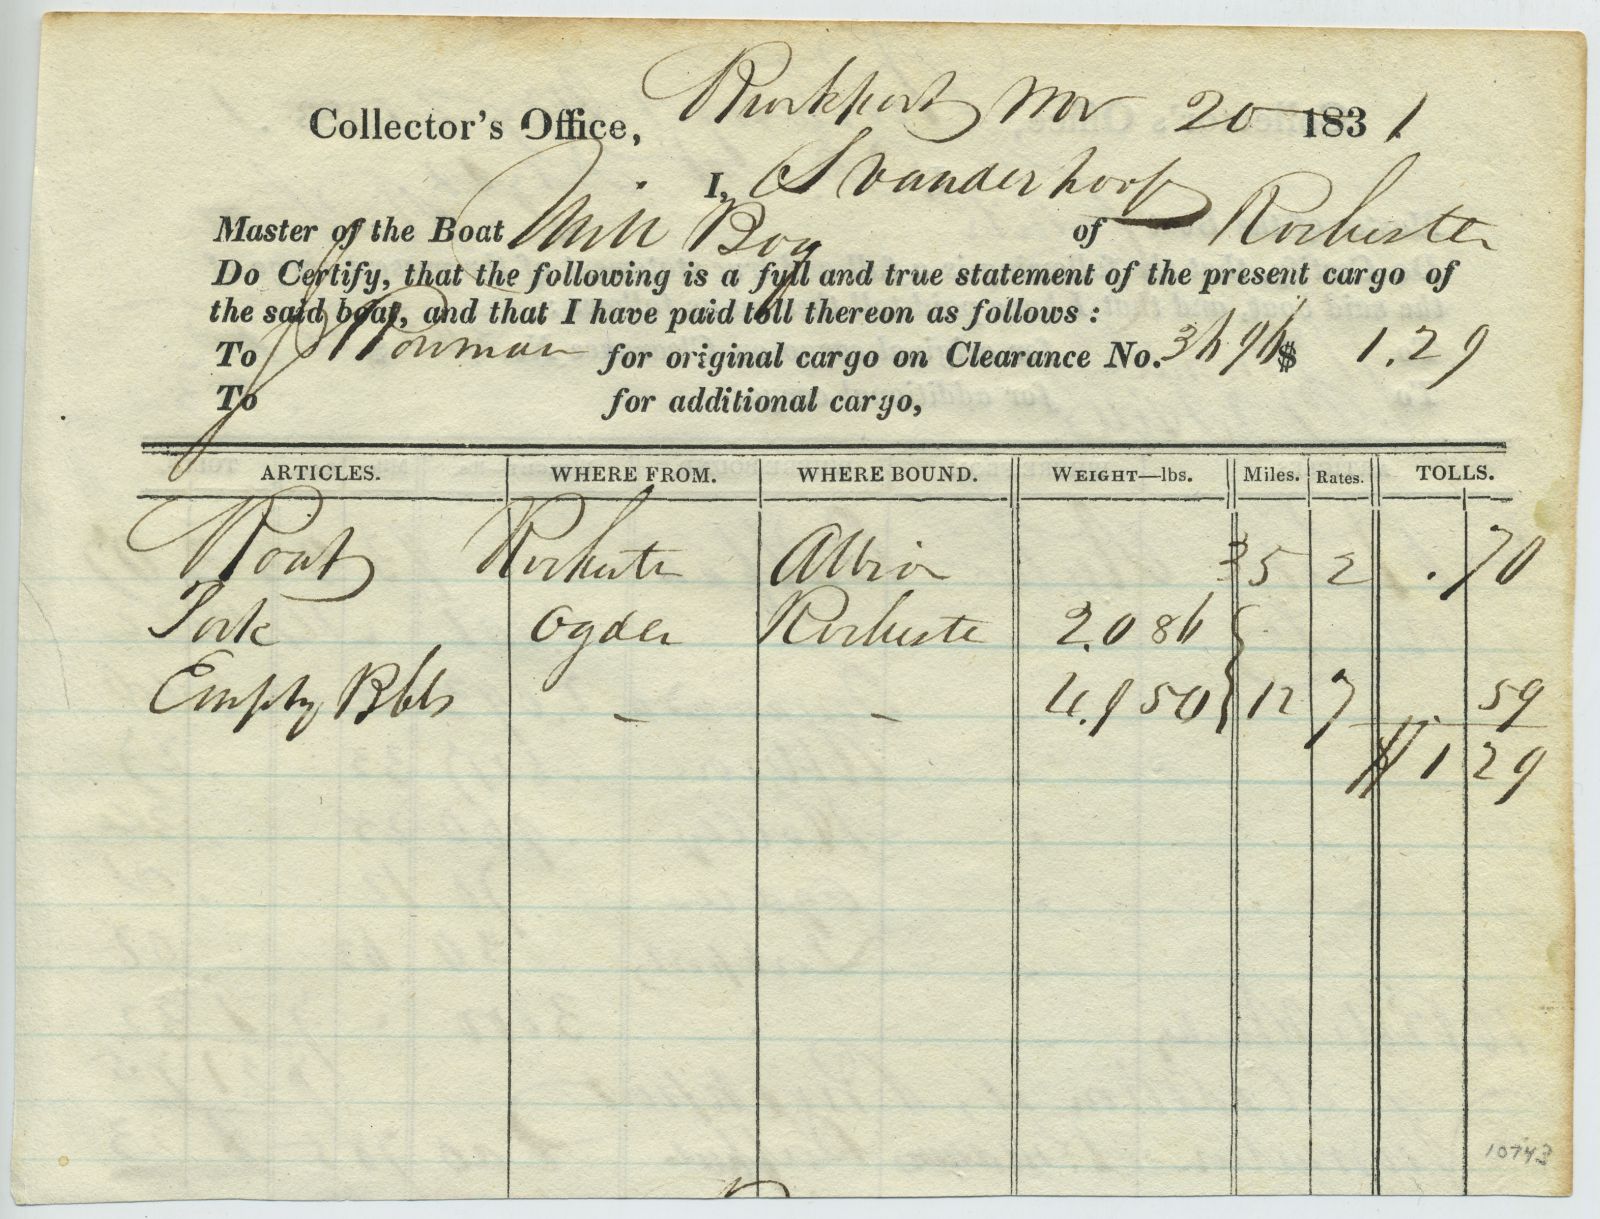
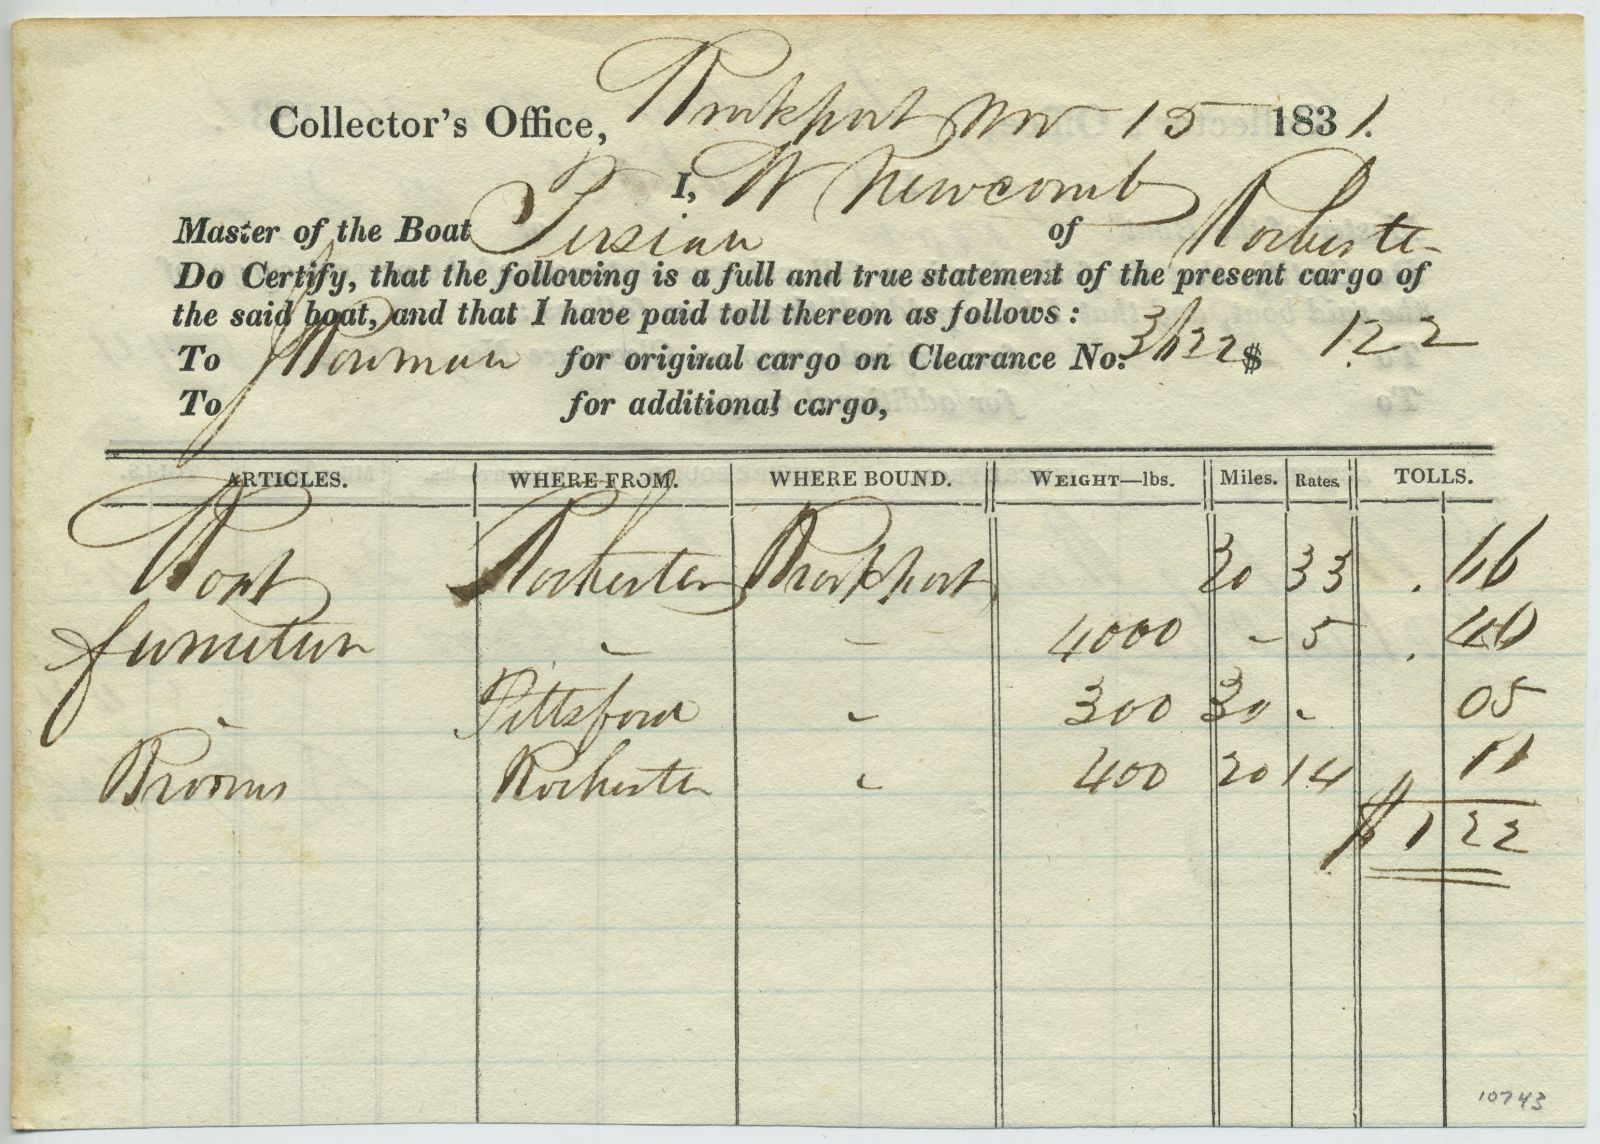
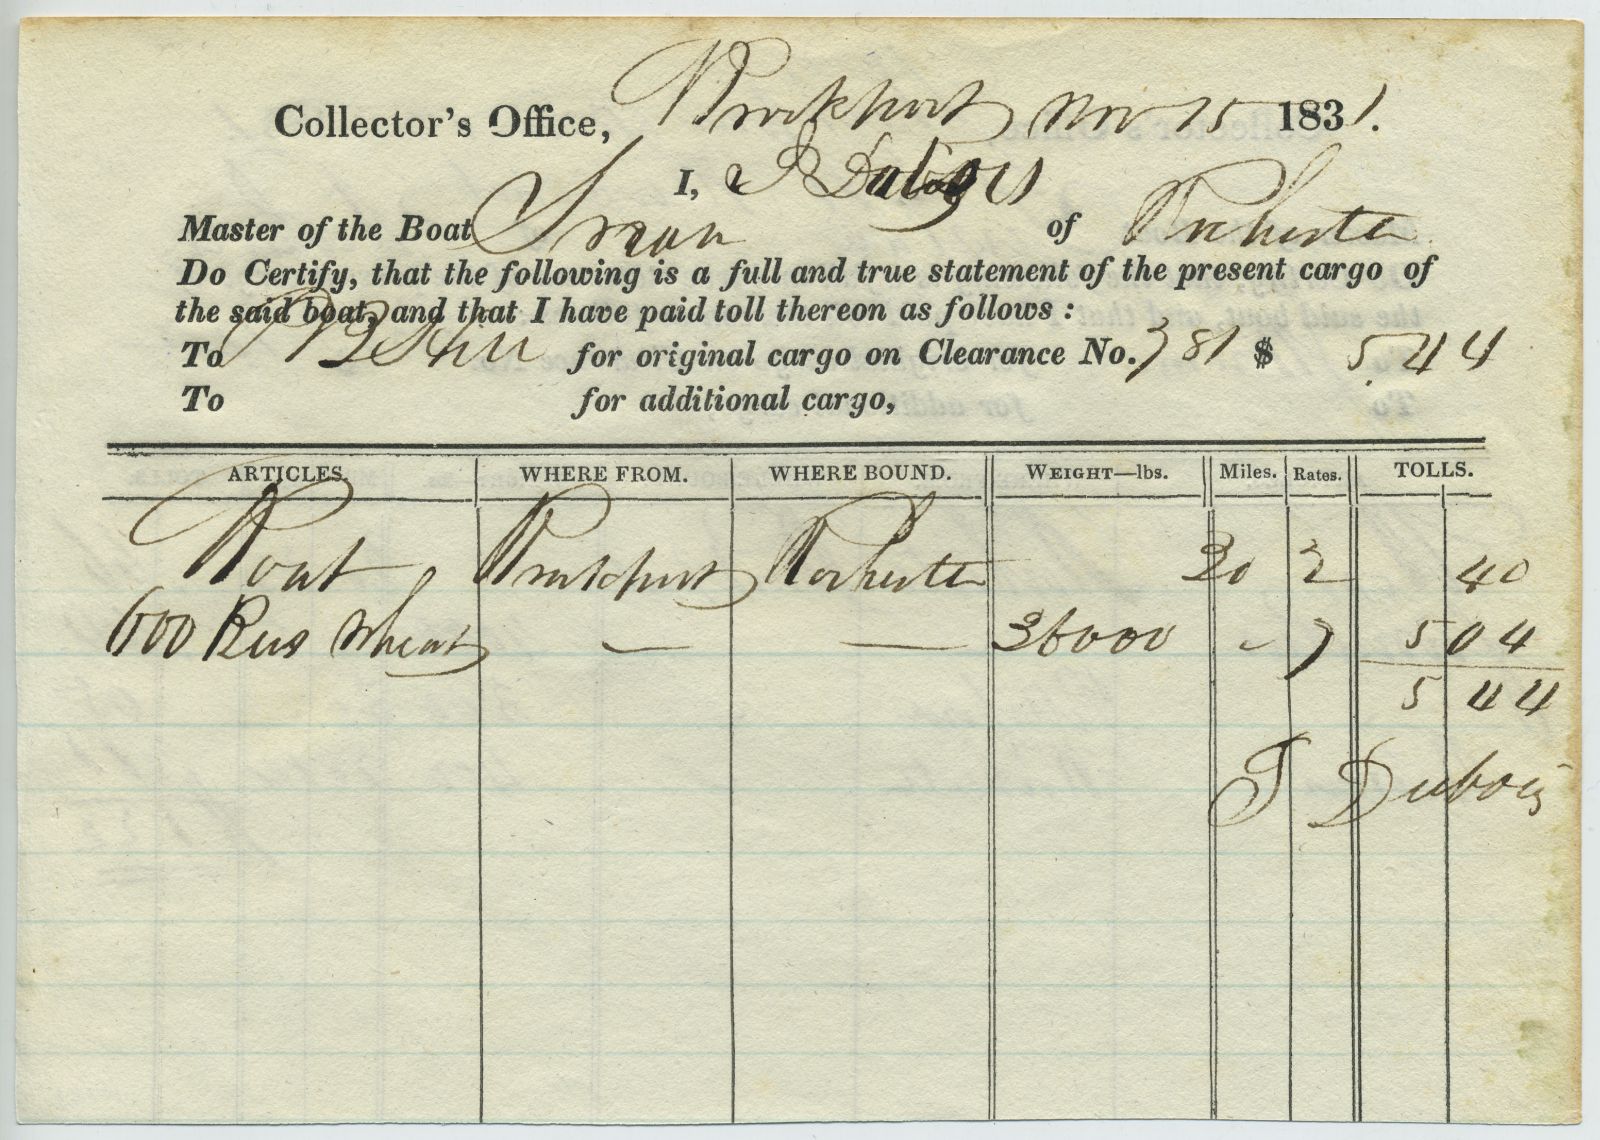
“Cargo Tickets Used on Erie Canal”
1831. Annotated
form, 6 x 7.5 inches. Courtesy of Lawrence Caldwell.
For New Yorkers along the route, the Erie Canal made travel
much faster and cheaper than travel by wagon on bumpy roads.
Merchants took advantage of this new form of transportation,
and the price of shipping goods dropped 90 percent. Examples
of three cargo tickets dated 1831 certify that a trader paid
the tolls to ship cargo via the canal. These receipts, which
list the cargo, its origin, and its destination, reveal
various types of freight—wheat, flour, whiskey, and furniture.
Despite the canal’s success, within decades steamships and
railroads became more popular for fast and efficient
travel.
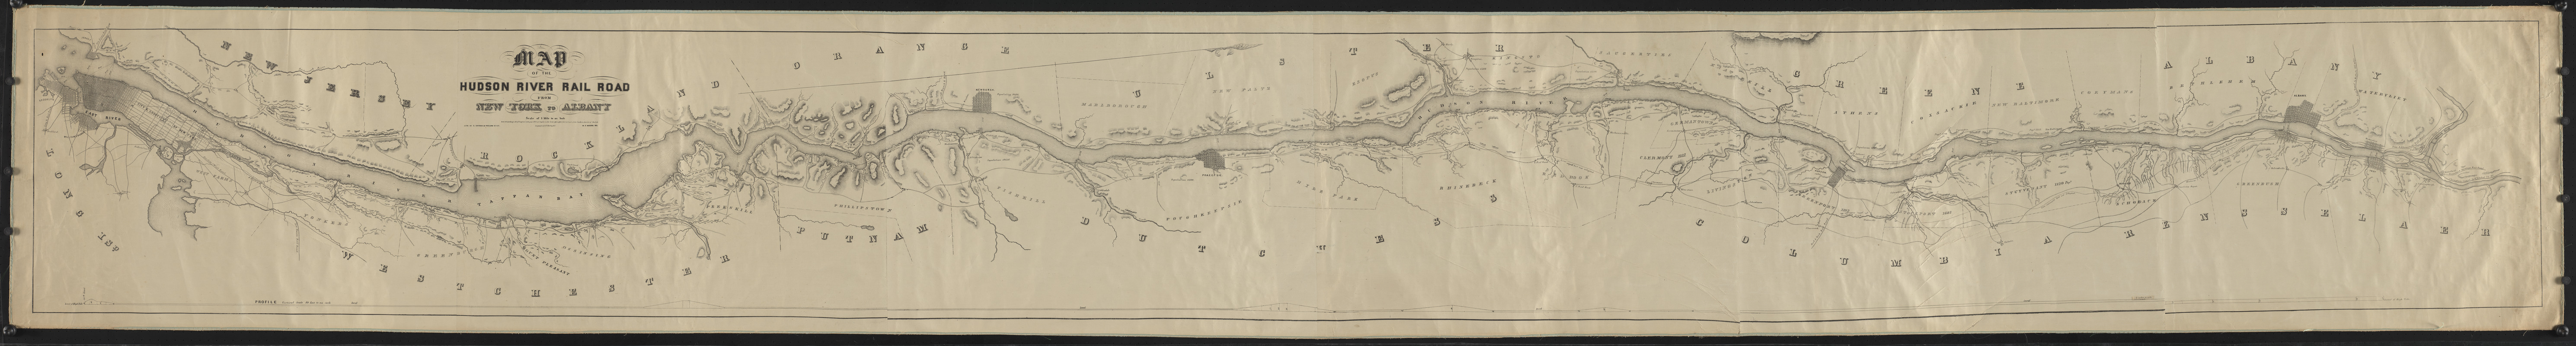
W.C. Moore (fl. 1848)
“Map of the Hudson River Rail
Road from New York to Albany”
New York, 1848. Printed
map, 17 x 151 inches. Courtesy of Lawrence Caldwell.
Reproduction, 2019.
For 18th-century French, British, and American colonists, the
Hudson River was strategically important as part of the
corridor linking New York City and Montreal. With the
completion of the Erie Canal, it became part of the route
connecting the Atlantic Ocean to the Great Lakes. This
topographic strip map, published in 1848, emphasizes the
navigable portion of the river and marks the route of the new
Hudson River Railroad, chartered in 1846. The map identified
major towns and villages, some of which were becoming
industrial centers that manufactured goods for markets in New
York City or for export.
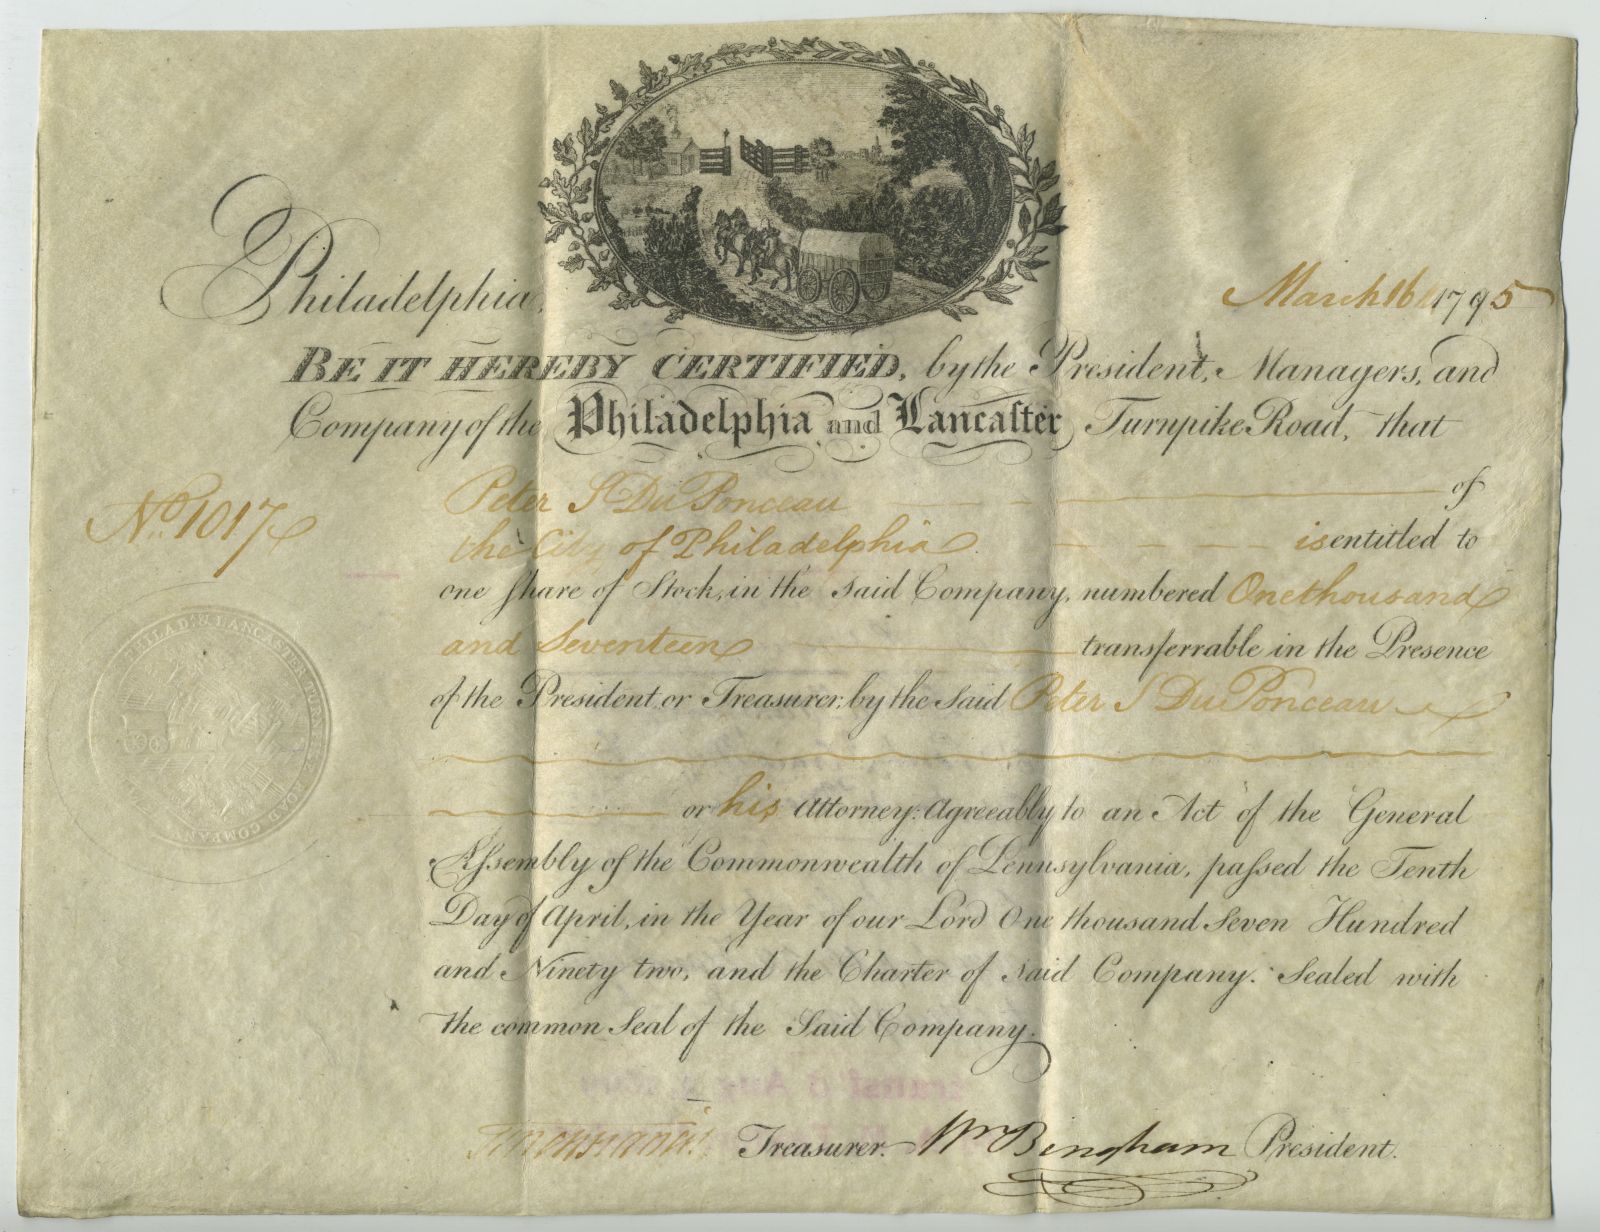
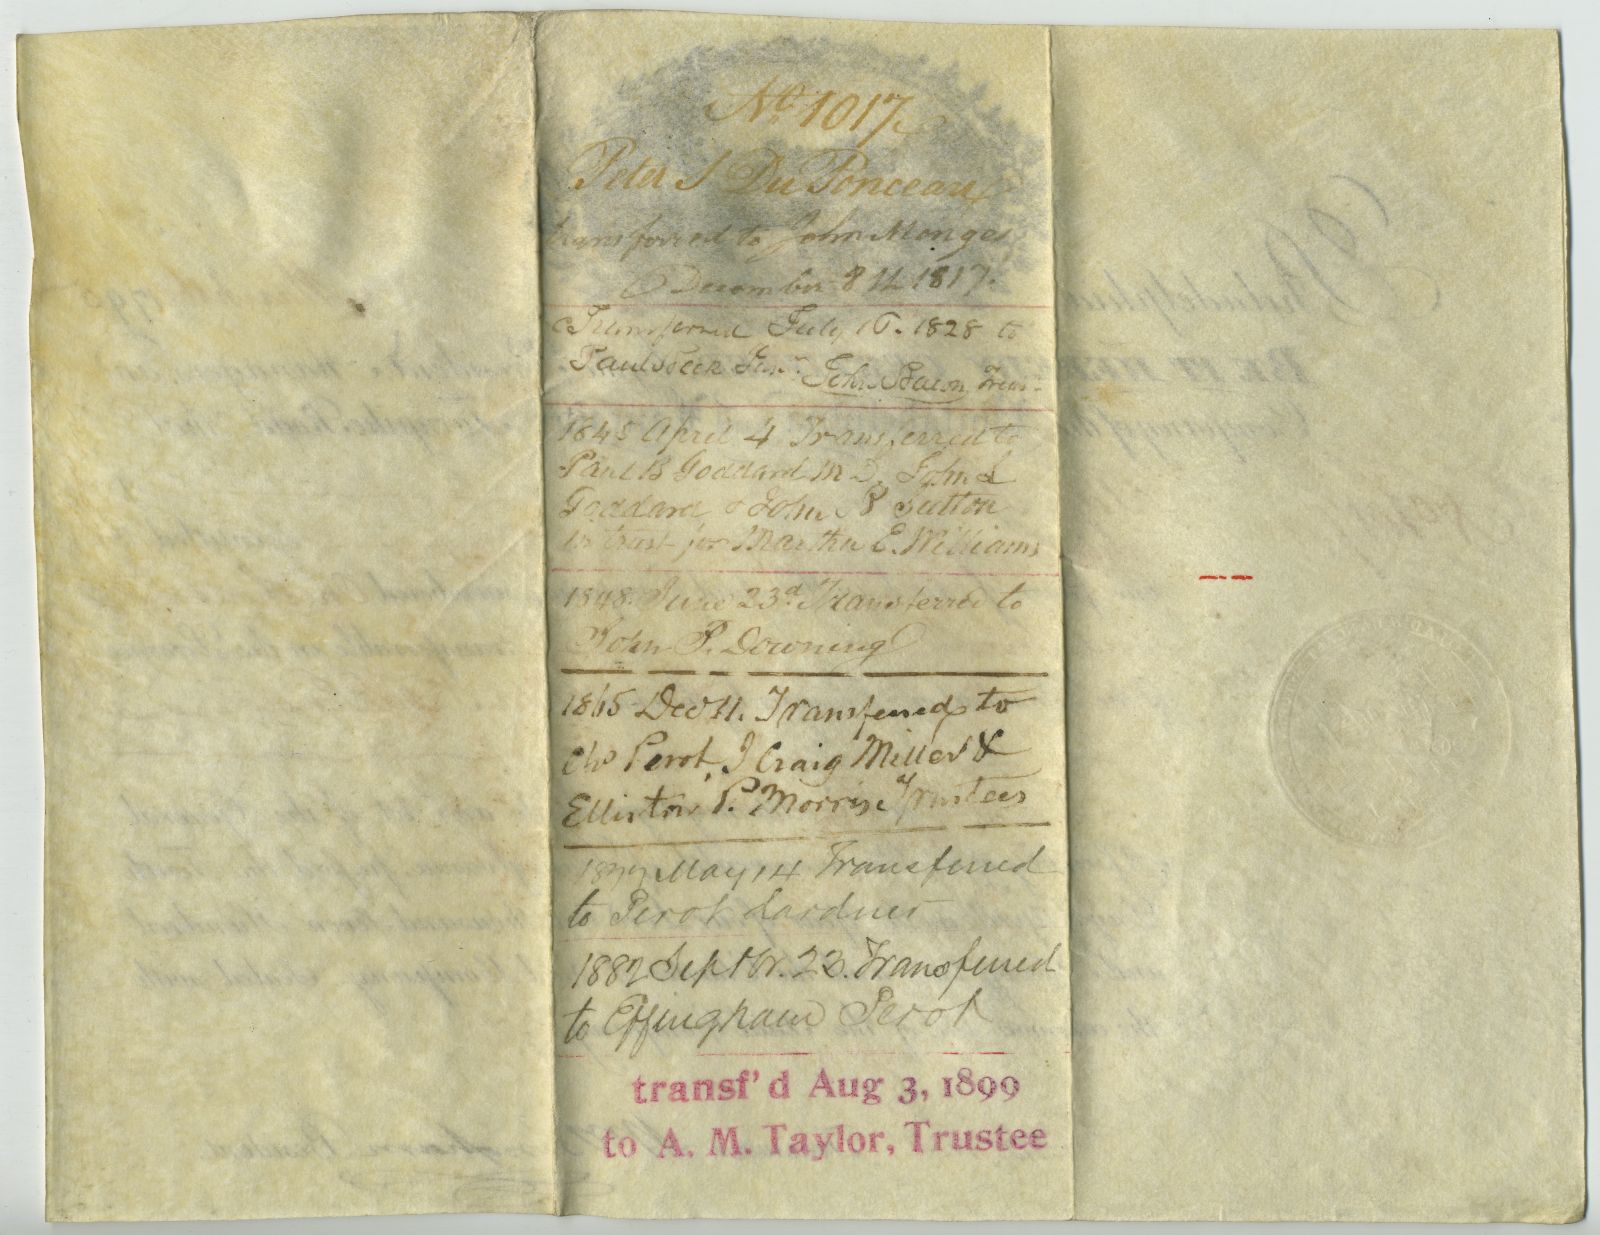
“Stock Certificate for Lancaster Turnpike”
1795,
Printed certificate, 8 x 10 inches. Courtesy of Lawrence
Caldwell.
In 1795, Americans constructed a turnpike between Philadelphia
and Lancaster, Pennsylvania. Instead of the state funding the
road, individuals purchased stock to finance the project. The
turnpike was the nation’s first long-distance road. It had a
stone surface that made travel by wagons and horses easier
during rainy weather. The engraving at the top of this
certificate depicts a Conestoga wagon approaching an opened
gate that signified the beginning of the toll road.
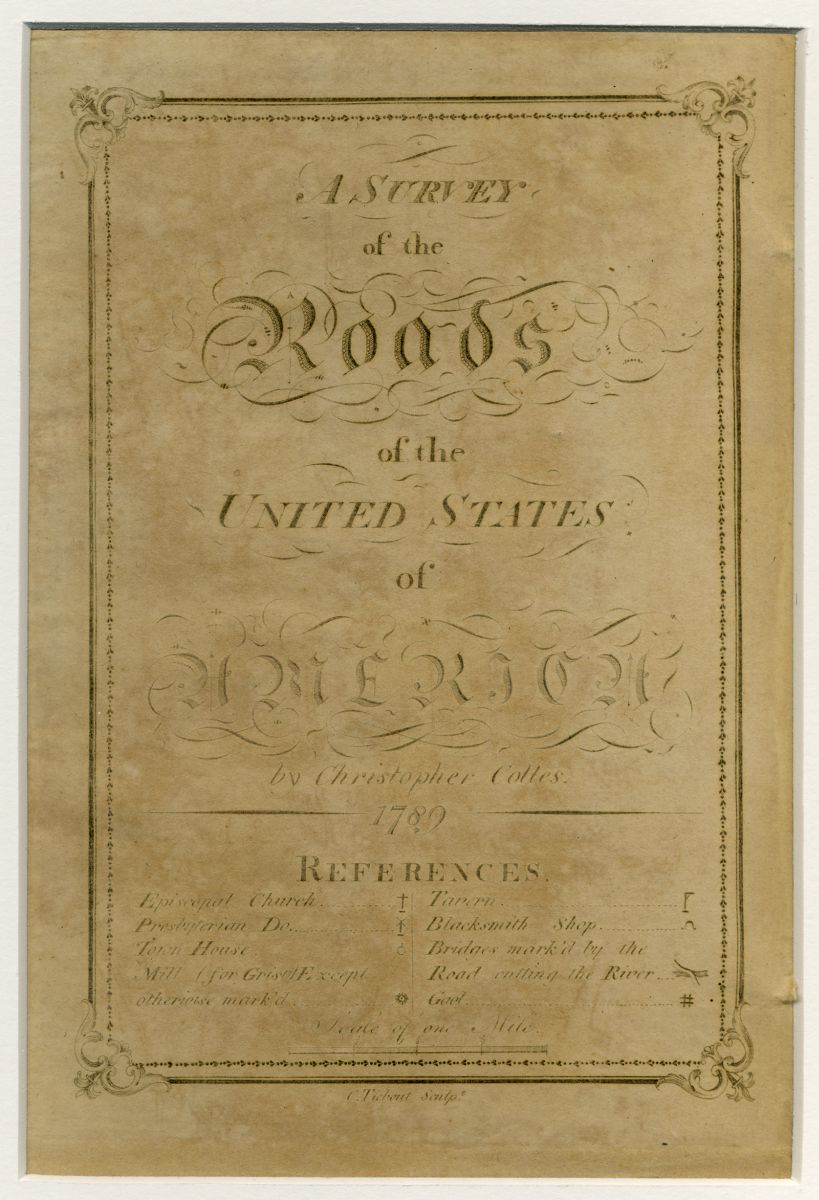
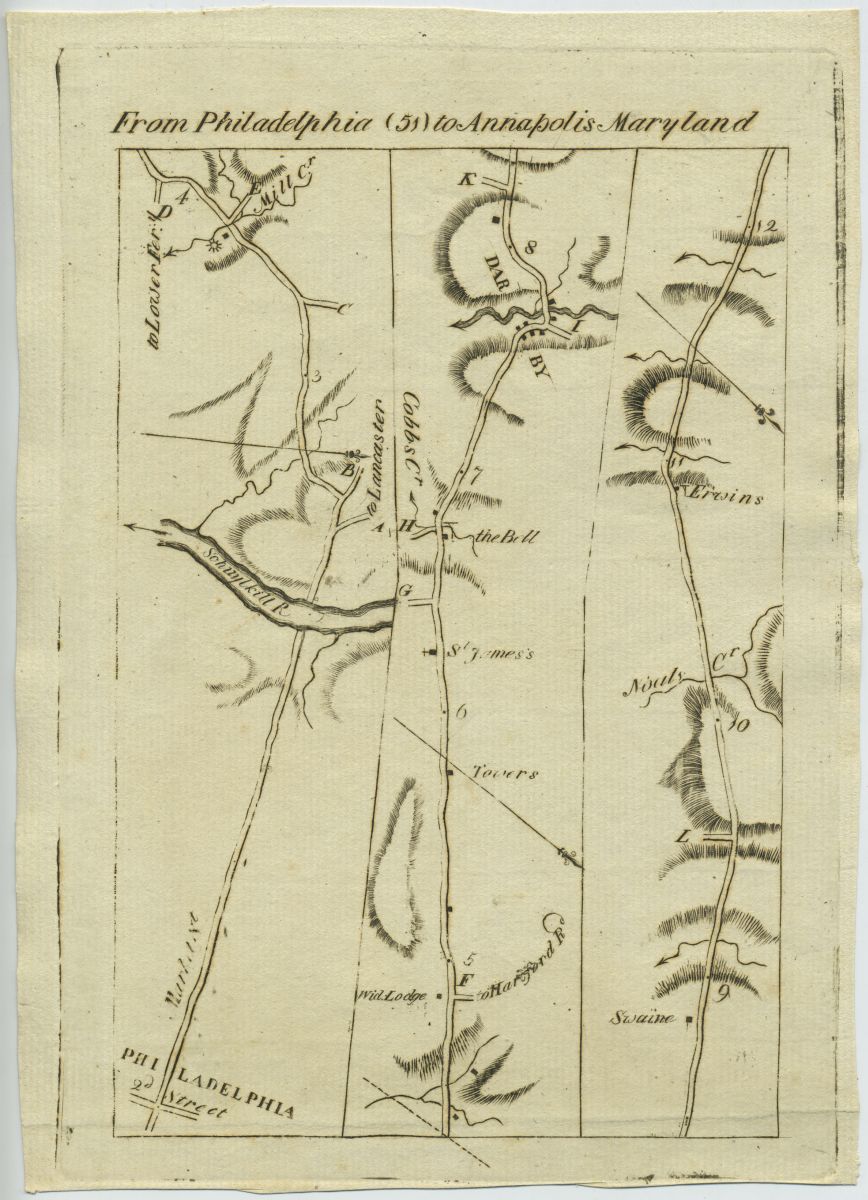
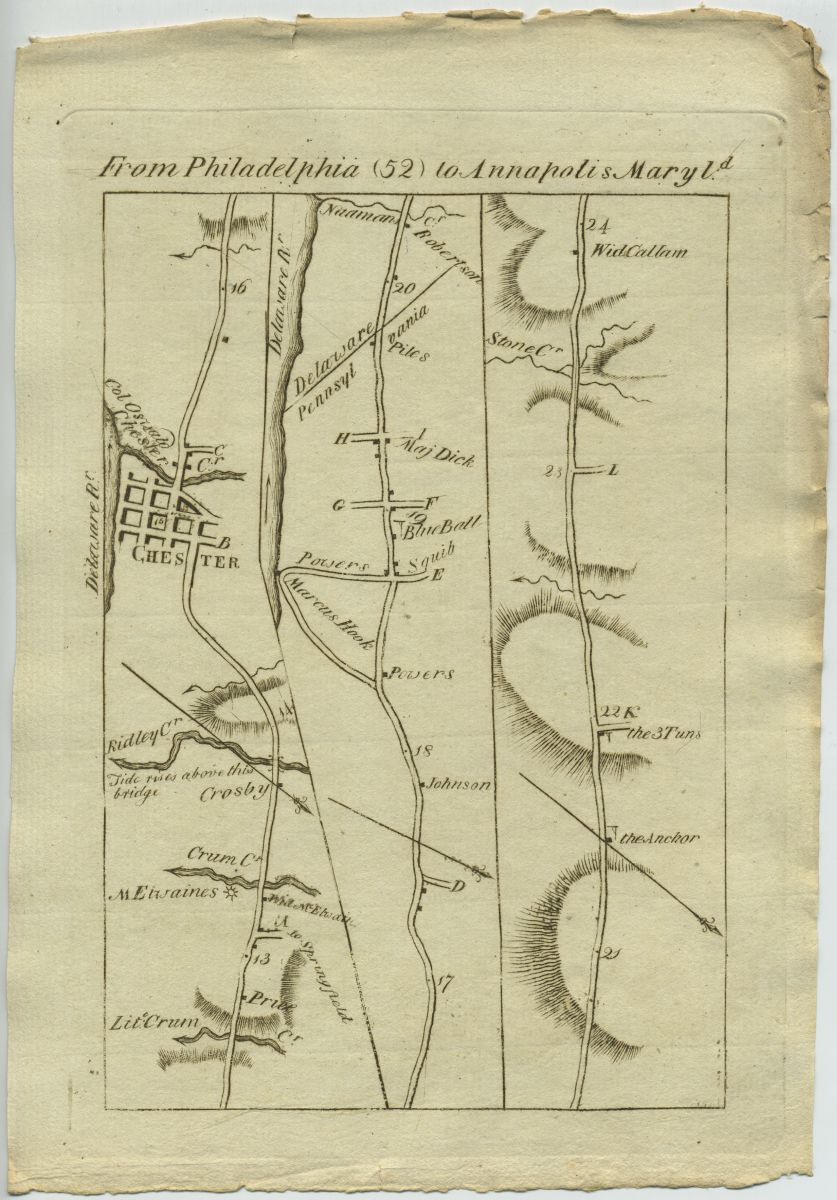
Christopher Colles (1738–1816)
“From Philadelphia … to
Annapolis, Maryland,” from “A Survey of the Roads of the
United States of America”
New York, 1789. Printed map,
8.5 x 5.5 inches. Courtesy of Lawrence Caldwell.
Small, pocket-size guide books provided maps and directions
for late 18th-century travelers attempting to negotiate the
various unmarked routes connecting cities and towns along the
eastern seaboard. This example, published in 1789, was the
first to include maps. It depicted routes from New York City
north to Albany, and south through Philadelphia to
Williamsburg, Virginia. Displayed here are the title page and
two pages showing about 24 miles of the road south of
Philadelphia toward Annapolis, Maryland. These strip maps
identified the primary route and intersections, bridges,
churches, taverns, mills, and blacksmith shops along the
route, much like today's GPS systems.
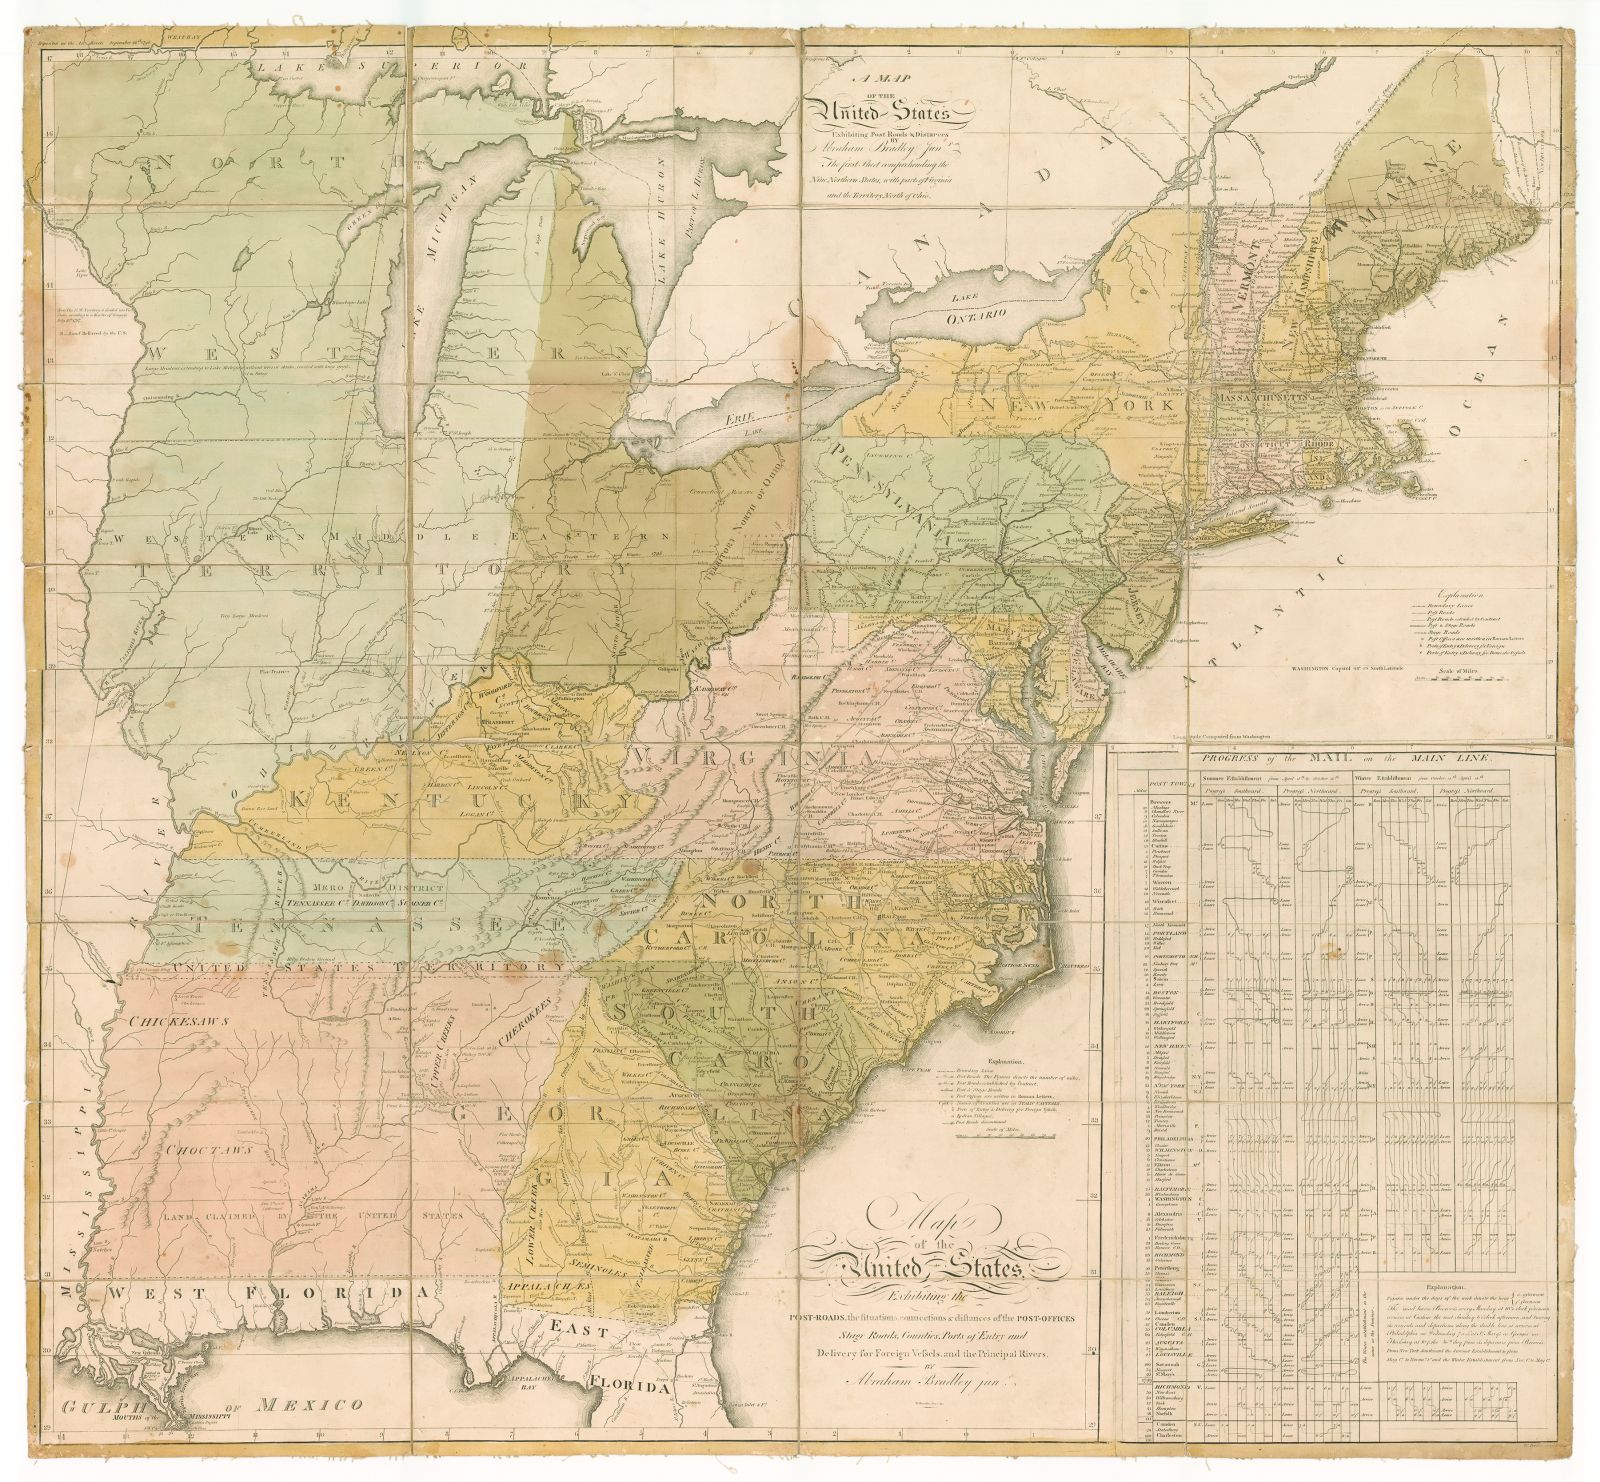
Abraham Bradley (1767–1838)
“Map of the United States
Exhibiting the Post-Roads, the Situations, Connections &
Distances of the Post-Offices . . .”
Philadelphia,
1796. Printed map 35 x 38 inches. Courtesy of
Barry MacLean Collection.
In the 1790s, transportation within the new nation was slow
and cumbersome. This early postal route map depicts navigable
rivers and existing roads. National postal service had existed
since the Revolutionary War, but Congress did not institute a
formal Post Office Department to designate post offices and
postal roads until 1792. Abraham Bradley, an assistant
postmaster general for 30 years, prepared the first post route
map in 1796. He revised it numerous times, though the earliest
versions included an innovative schedule chart that listed the
estimated time for postal delivery from Maine to Georgia. At
that time, it took 46 days to travel the entire route.
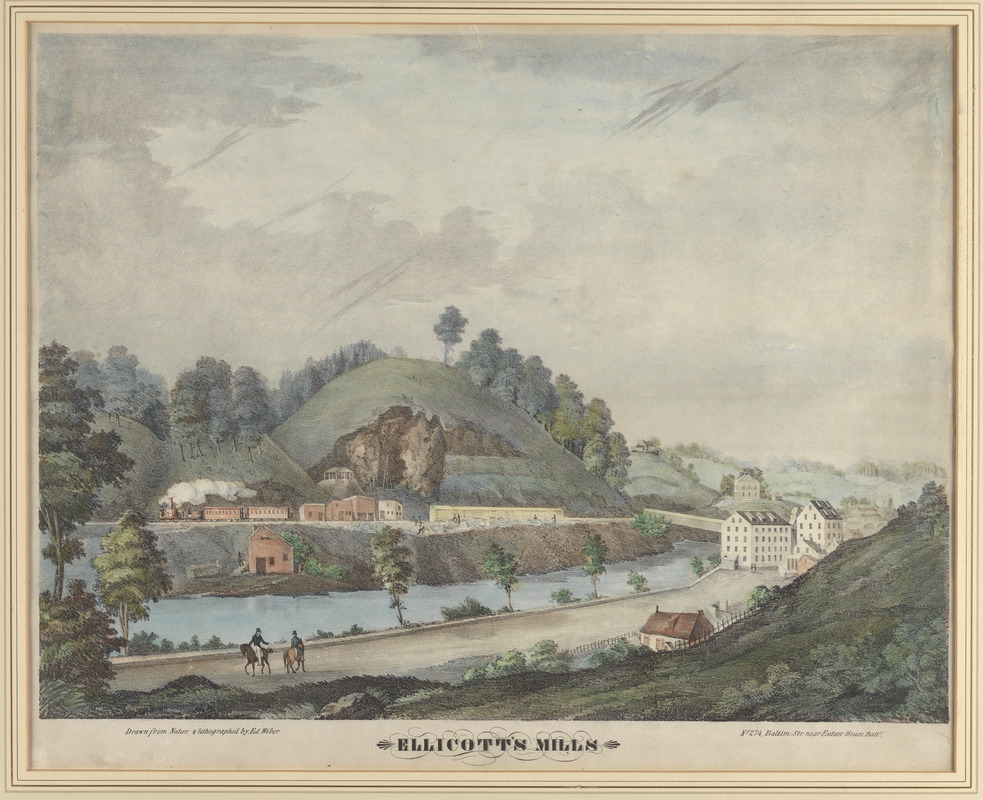
Edward Weber (d. 1848)
“Ellicott’s Mills”
Baltimore,
1836. Print, 26 x 30 inches. Courtesy of Lawrence
Caldwell.
The Baltimore and Ohio Railroad was the nation’s first
steam-operated railway. Baltimore merchants conceived this
project as a means of competing with New York’s successful
Erie Canal. They wanted to profit from the lucrative trade
west of the Appalachians. Construction began in 1828, and the
first section of the railroad opened in 1830. The train ran 13
miles from Baltimore to Ellicott’s Mills (present-day Ellicott
City), Maryland. This print depicts a short train traveling
the tracks on the far side of the river. Steam puffs out of
the engine into the sky, as two travelers on horses watch the
train pass.
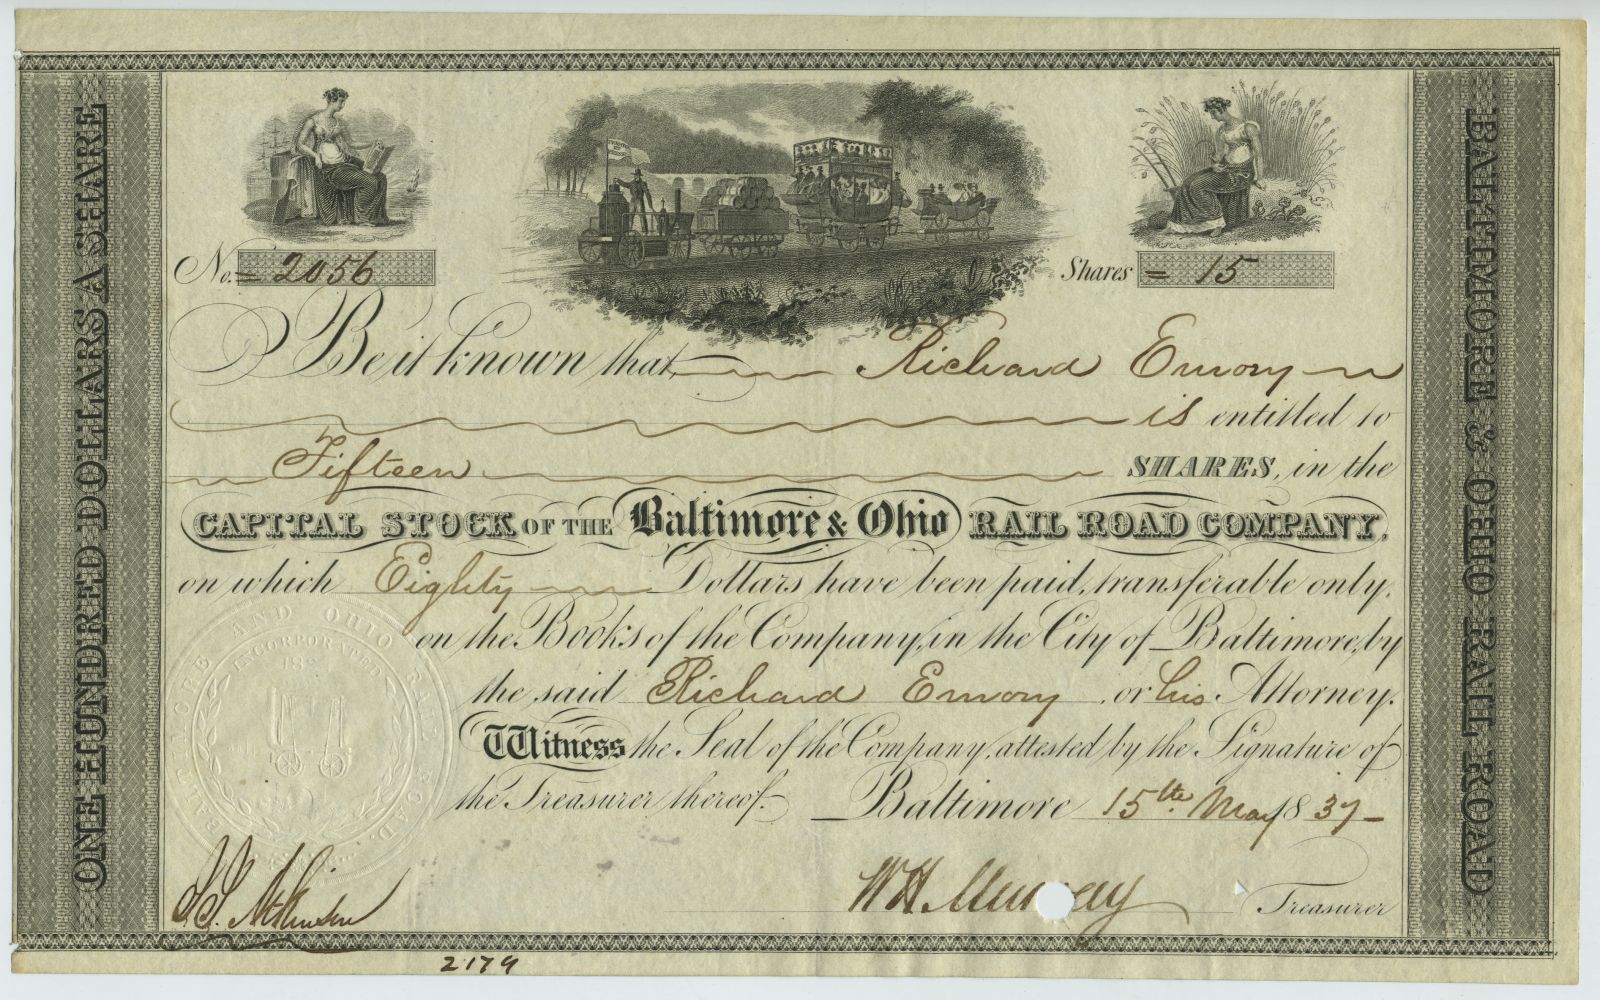
“B & O Stock Certificate”
1836. Printed
certificate, 6 x 10 inches. Courtesy of Lawrence
Caldwell.
Though we know the Baltimore and Ohio Railroad became
successful, Americans at that time did not. Investors who
financially backed the railroad’s construction received stock
certificates like this one purchased by Richard Emory. The
certificate features three illustrations at the top. Two
female allegorical figures flank a central image of the new
track, suggesting its potential for carrying supplies and
people. The success of this endeavor proved that the new mode
of transportation could be constructed elsewhere.
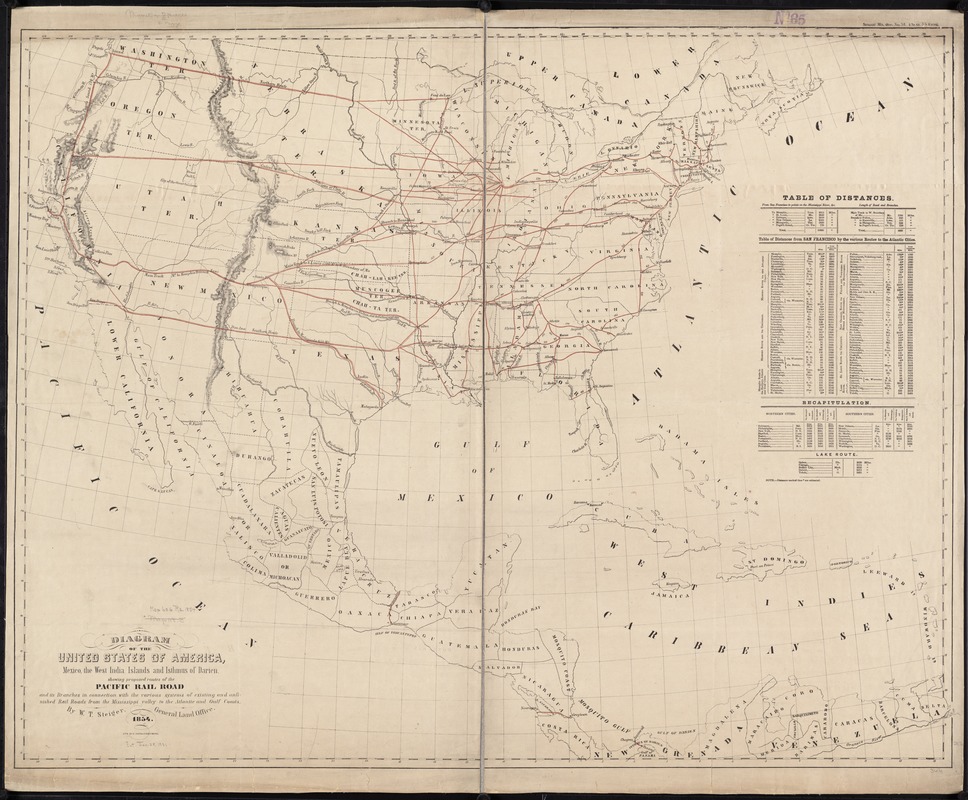
W.T. Steiger (fl. 1854)
“Diagram of the United States
of America … Showing Proposed Routes of the Pacific Rail
Road ...” Washington, DC, 1854. Printed map, 29 x 37 inches.
Leventhal Map and Education Center.
By mid-19th century, with increased oceanic traffic between
the East and West Coasts based on the China trade and
discovery of gold in California, many Americans wanted to
extend the nation’s rail network west of the Mississippi River
by constructing a transcontinental route. In 1853, Congress
authorized the War Department to conduct reconnaissance
surveys in order to determine the best route for a
transcontinental railroad. Because of growing sectional
rivalries between the North and South in extending chattel
slavery into the western territories, there were four
east-west Pacific Railroad Surveys, as indicated on this
schematic map.
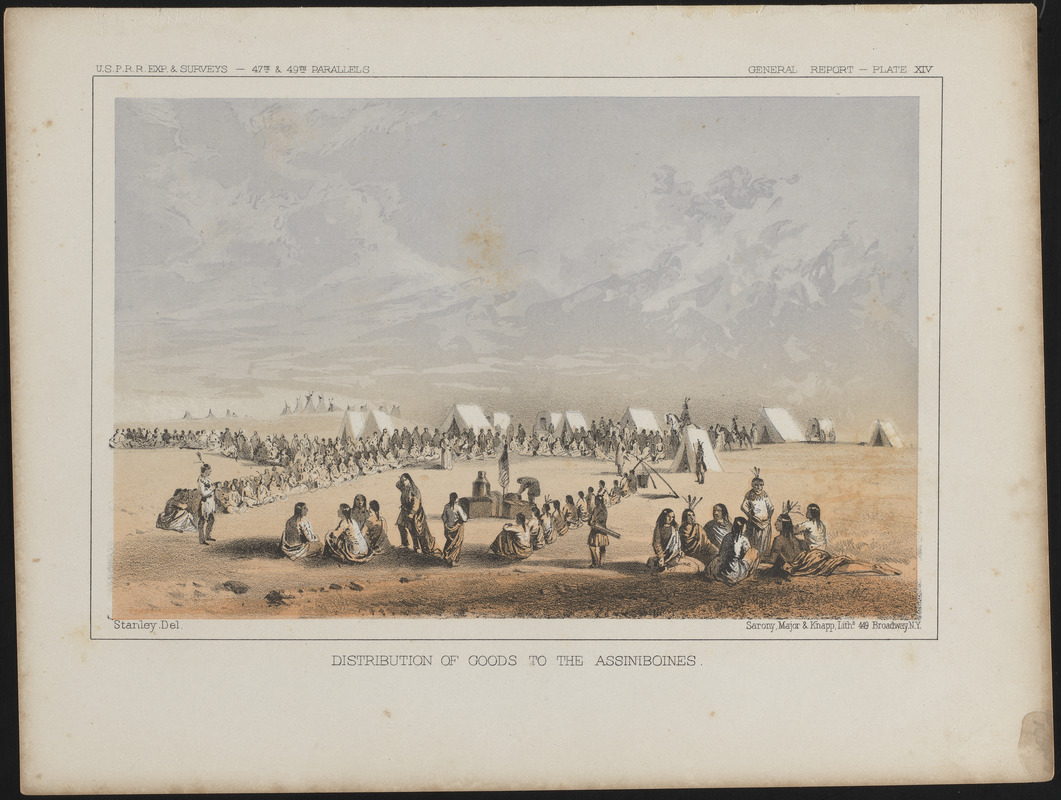
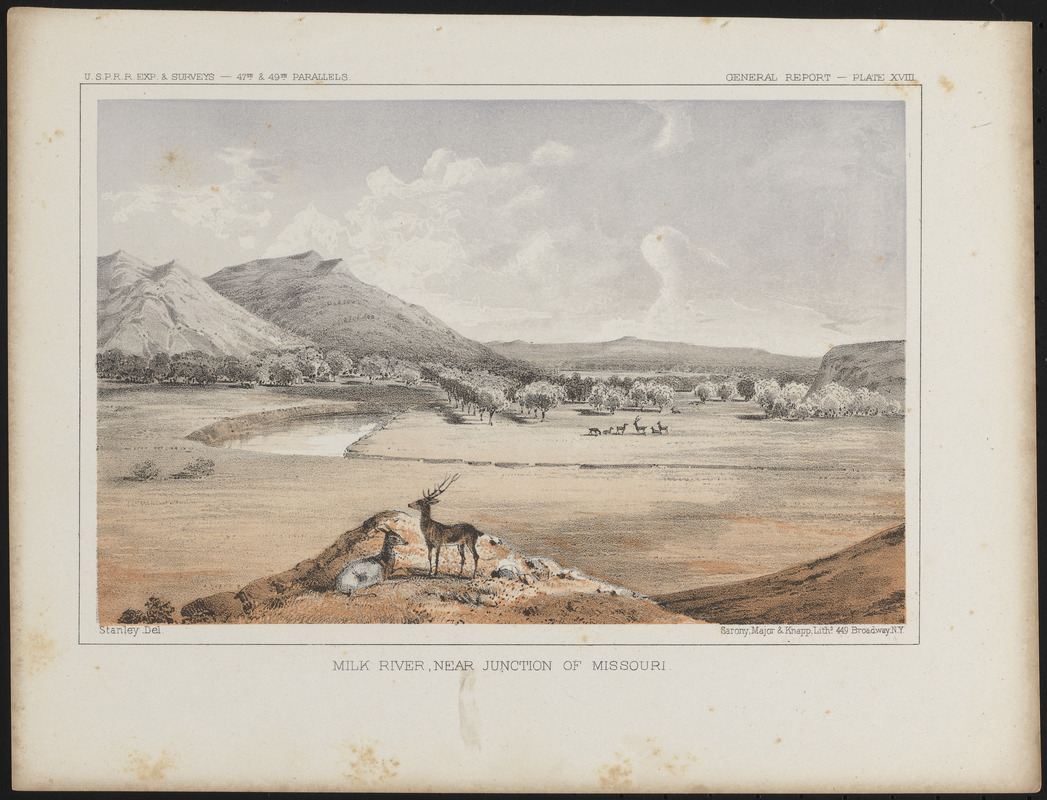
John Mix Stanley (1814–1872)
“Distribution of Goods to
the Assiniboines,” and “Milk River, near Junction of
Missouri,” from “Report of Explorations and Surveys to
Ascertain the Most Practicable and Economical Route for a
Railroad …”
Washington, DC, 1855-1860, vol. 12, part 1.
Lithograph prints, 8.5 x 11.5 inches. Courtesy of Ronald
Grim.
The results of the Pacific Railroad Surveys were documented in
numerous topographic maps and 12 volumes of reports describing
the geography, flora and fauna, and Native peoples. These
volumes included numerous illustrations depicting Native
people and natural landscapes, such as these two views
prepared by John Mix Stanley while serving with the Northern
Pacific Railroad Survey party. One records a meeting on the
northern Great Plains with the Assiniboine, whose chief
expressed grave concerns that the coming railroad would
greatly affect their way of life, and the other depicts
Montana’s Milk River Valley with a pair of antelope in the
foreground.
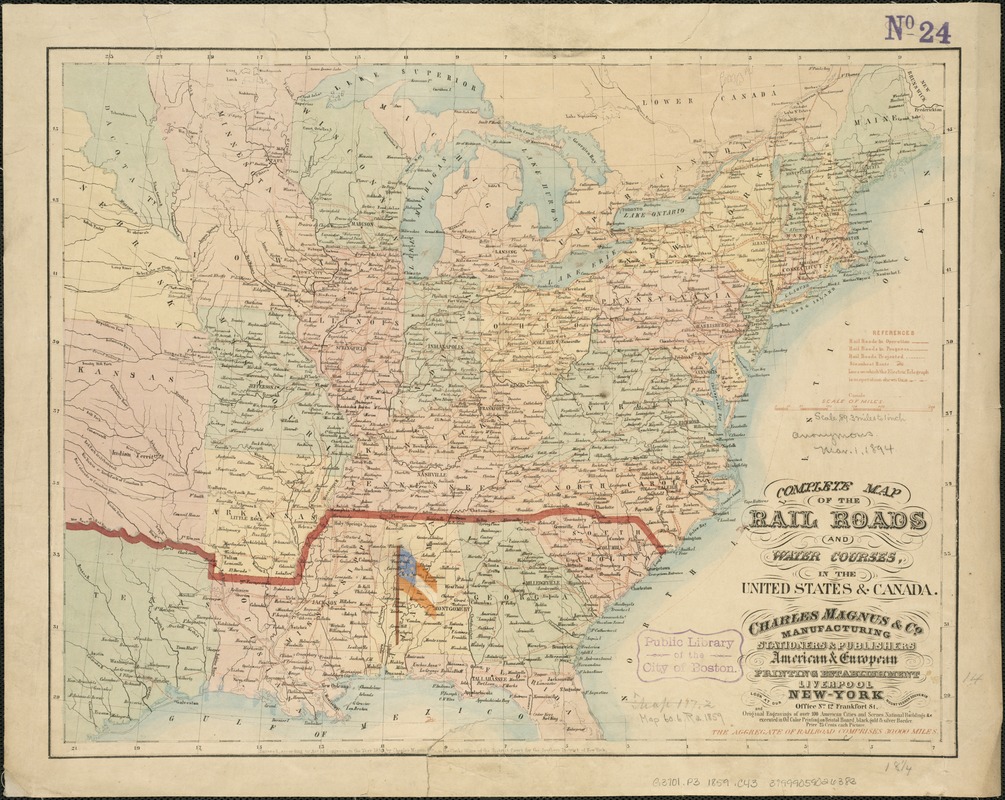
Charles Magnus (1826–1900)
“Complete Map of the Rail
Roads and Water Courses in the United States &
Canada”
New York, [1859]. Printed map, 14.25 x 18.5
inches. Leventhal Map and Education Center. Reproduction,
2019.
This map displays the nation's growing transportation and communication network on the eve of the Civil War. The legend identifies rail lines that were in operation, in progress, and proposed, along with telegraph and coastal steamship lines. Railroads were densest in the North, extending from New England through the Mid-Atlantic and Midwestern states. In the South, the network was less dense, with shorter lines running from interior locations to coastal ports. This map was overprinted around 1861 to show the first southern states to secede from the Union with an early version of the Confederate flag flying over Montgomery, Alabama, the first capital of the Confederacy.
3b. TRANSPORTATION 1862-1900: Making Connections by Road, Water, and Rail
At the beginning of the 19th century, the West was not an impenetrable, uncharted wilderness. Tribal nations had developed extensive trading networks via a web of navigable streams, rivers, lakes and overland trails. Many of the routes followed by early explorers and fur traders, such as the Santa Fe and Oregon Trails, followed well-established trails forged by Native people.
Because of poor road conditions, traveling by water was initially the most efficient option. Travel became faster and less costly over the course of the century. Landmarks in transportation technology started with the introduction of the steamboat, which made travel up the Mississippi and other rivers possible. The completion of the Erie Canal in 1825 connected the Atlantic Ocean to the Great Lakes, and the first railroad made its inaugural trip in 1830.
Congress later made large land grants to help finance the construction of transcontinental railroads. By the end of the century, a complex network of railroads crisscrossed the nation and made speedy and inexpensive land travel possible for moving people and manufactured goods.
For Kids
The United States planned the locations
for new canals, roads and railroads based on the potential to
make money for the government, the transportation companies
and for towns along the routes. The decision about where to
put a railroad stop could mean the death of a town and the
birth of another. Settlers moved more easily from the east to
the west buying inexpensive land, at times expecting the
United States military to eliminate Native people in order to
free up more space.
- What stories do you hear in these maps and other objects?
- Why would someone celebrate the sound of a train crossing the prairies? Why would someone else be angry or concerned?
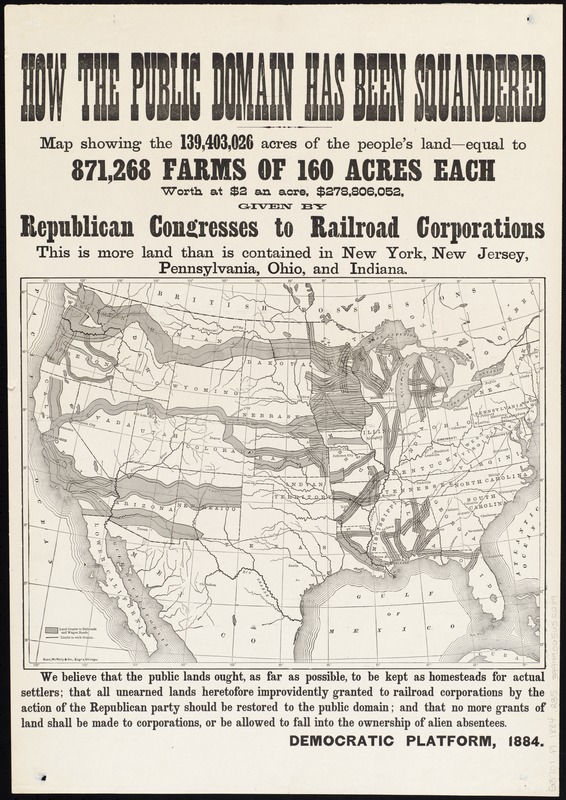
Rand McNally & Co.
How the Public Domain Has Been Squandered ...
Chicago, 1884. Printed map, 11.5 x 15.5 inches.
Leventhal Map and Education Center.
Railroad infrastructure expanded from 31,000 miles in 1860 to
130,000 miles by the 1890s. To subsidize construction, the
U.S. government gave over 140 million acres of public land to
railroad companies, oftentimes dispossessing Native nations in
the process. This land was used to locate tracks or sold to
raise capital for the railroad company. Companies argued that
they deserved government support because they were creating a
public good. Opponents, like those who printed this poster,
argued that railroads should return this land to the
government rather than profit from its sale. This 1884 poster
declares that these railroad land grants would create 871,268
farms with a generous 160 acres each.
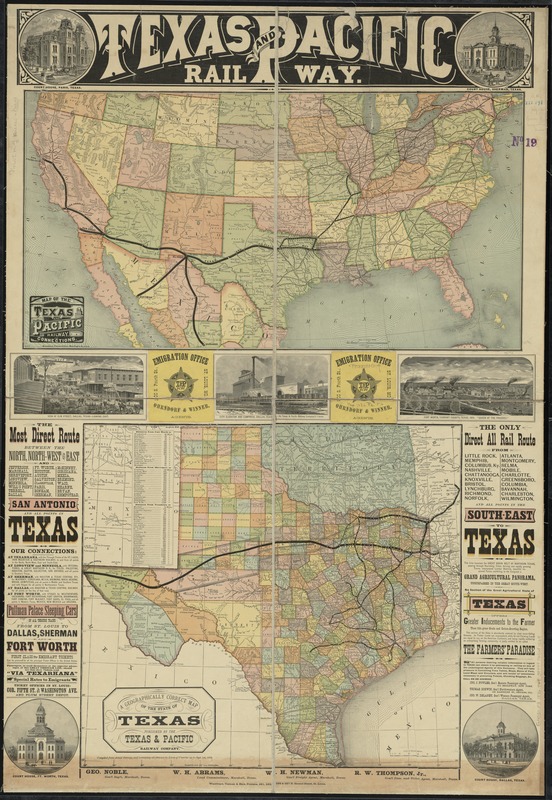
Woodward, Tiernan, and Hale
Map of the Texas and Pacific Railway and Connections
St. Louis, 1876. Printed map, 41.5 x 28.5 inches.
Leventhal Map and Education Center.
After the Civil War, there was strong interest in constructing
a new transcontinental route across the southwestern United
States. In 1871, Congress chartered the Texas and Pacific
Railway to build a railroad from eastern Texas to San Diego.
This map highlights the proposed route to promote land sales
and encourage emigration to Texas’ rich agricultural lands.
When this map was published, the rail line had been completed
to Dallas and Fort Worth. Three central illustrations depict
the growth of this area. The railroad as proposed never
reached San Diego but eventually connected with the Southern
Pacific Railroad just east of El Paso.
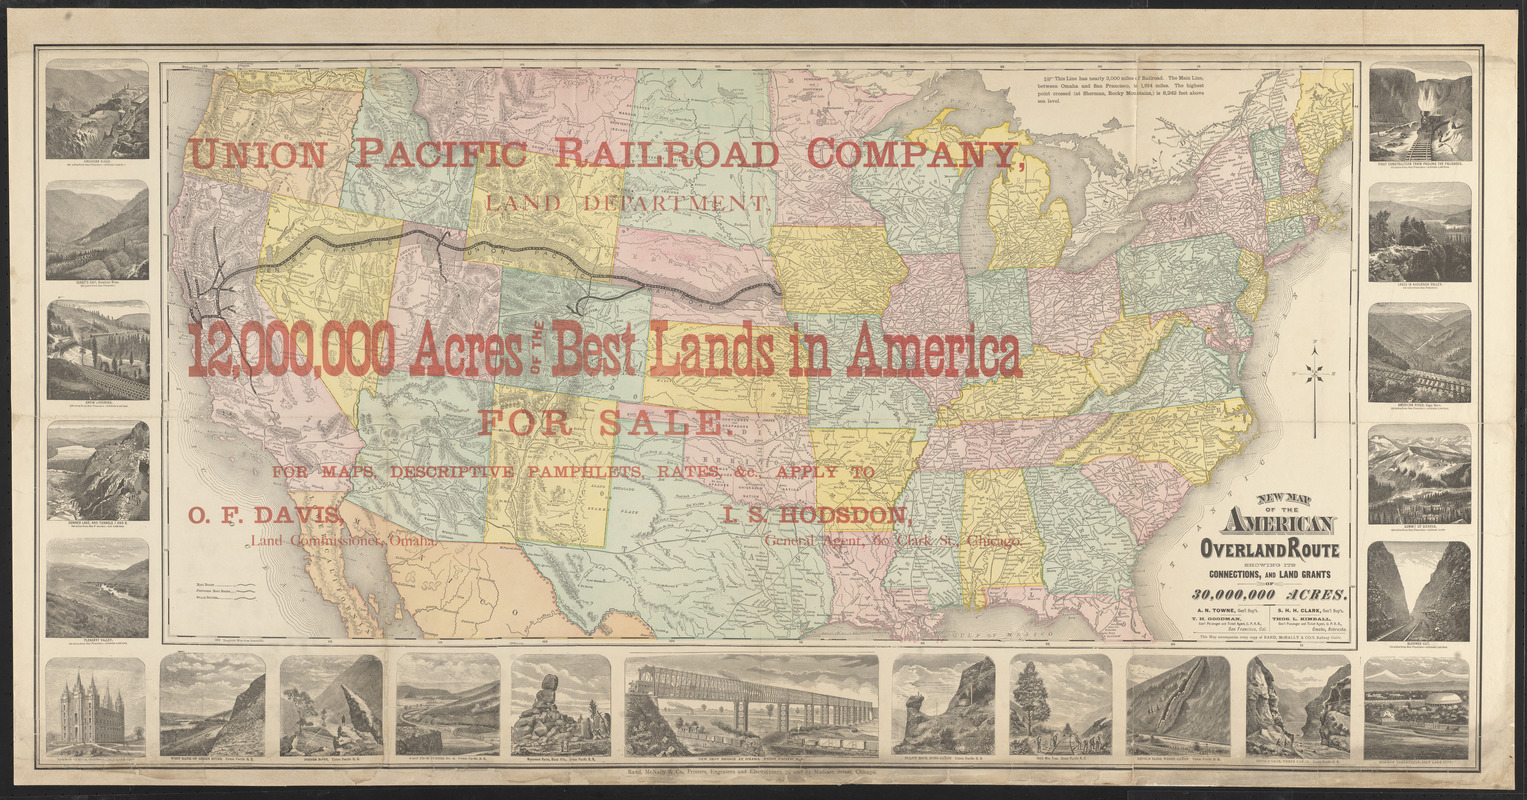
Union Pacific Railroad Company. Land Department
New Map of the American Overland Route Showing … Land
Grants of 30,000,000 Acres
Chicago, 1870-1879. Printed map, 17 x 36 inches.
Leventhal Map and Education Center.
This map marks the route of the first transcontinental
railroad, constructed between 1863 and 1869. Two railroad
companies constructed the route. The Central Pacific worked
eastward from Sacramento, and the Union Pacific worked
westward from Omaha. Congress approved land grants and 30-year
bonds to finance construction. These companies employed
thousands of immigrant laborers, including Irish, German, and
Chinese immigrants to lay the tracks. While the map blatantly
promotes land sales, border illustrations highlight important
landmarks along the route, including the Mormon temple and
tabernacle in Salt Lake City.
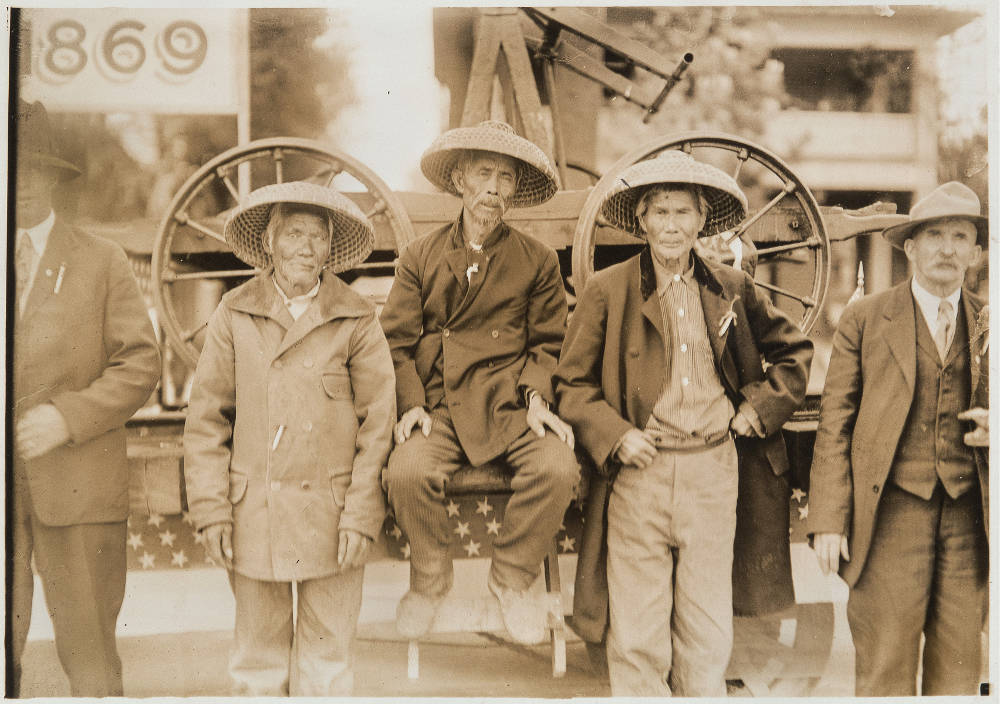
Surviving Central Pacific Chinamen, Wong Fook, Lee Chao, Ging Cui.
1919, gelatin silver print. Courtesy of Amon Carter Museum of American Art, Fort Worth, Texas. Reproduction 2019.
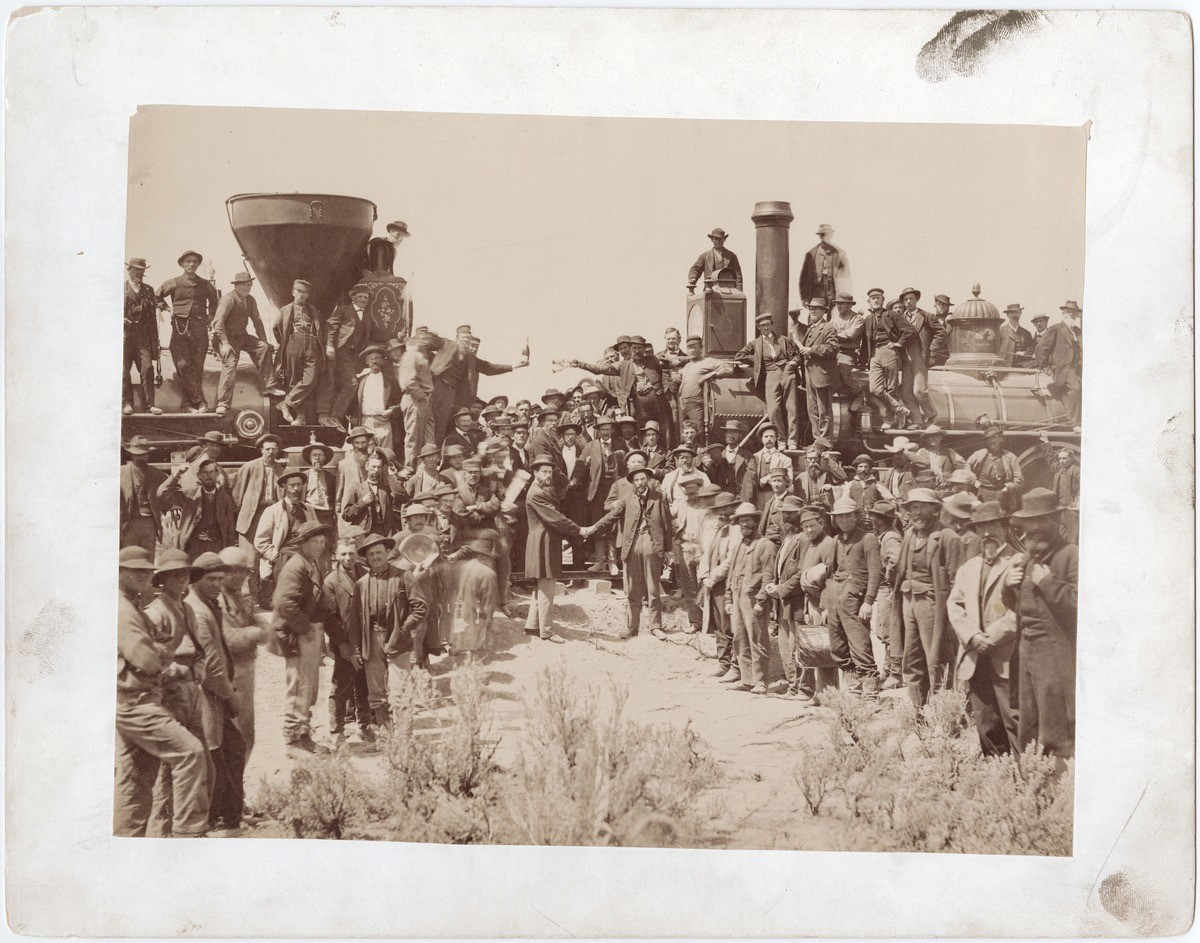
Andrew J. Russell (1829-1902)
Ceremony for the Driving of the Golden Spike at Promontory Summit, Utah on May 10, 1869.
Photographic print, 11 x 14 inches. Courtesy of Yale University, Beinecke Rare Book and Manuscript Library. Reproduction 2019.
On May 10, 1869, representatives of the Union Pacific and Central Pacific Railroad Companies gathered to celebrate the completion of the first transcontinental railroad. Andrew J. Russell, who photographed the railroad’s construction, captured the ceremony to drive the final golden spike, but it portrays only white men, belying the fact that thousands of immigrant workers made this moment possible.
By 1867, roughly 90 percent of the Central Pacific’s workers
were Chinese immigrants. Despite doing the most dangerous work
such as blasting, Chinese workers received less pay than white
counterparts and their contributions were often
underappreciated. In the second photograph, three of the eight
Chinese workers who laid the final railroad tie sit on a
parade float during the 1919 50th anniversary celebration in
Ogden, Utah.
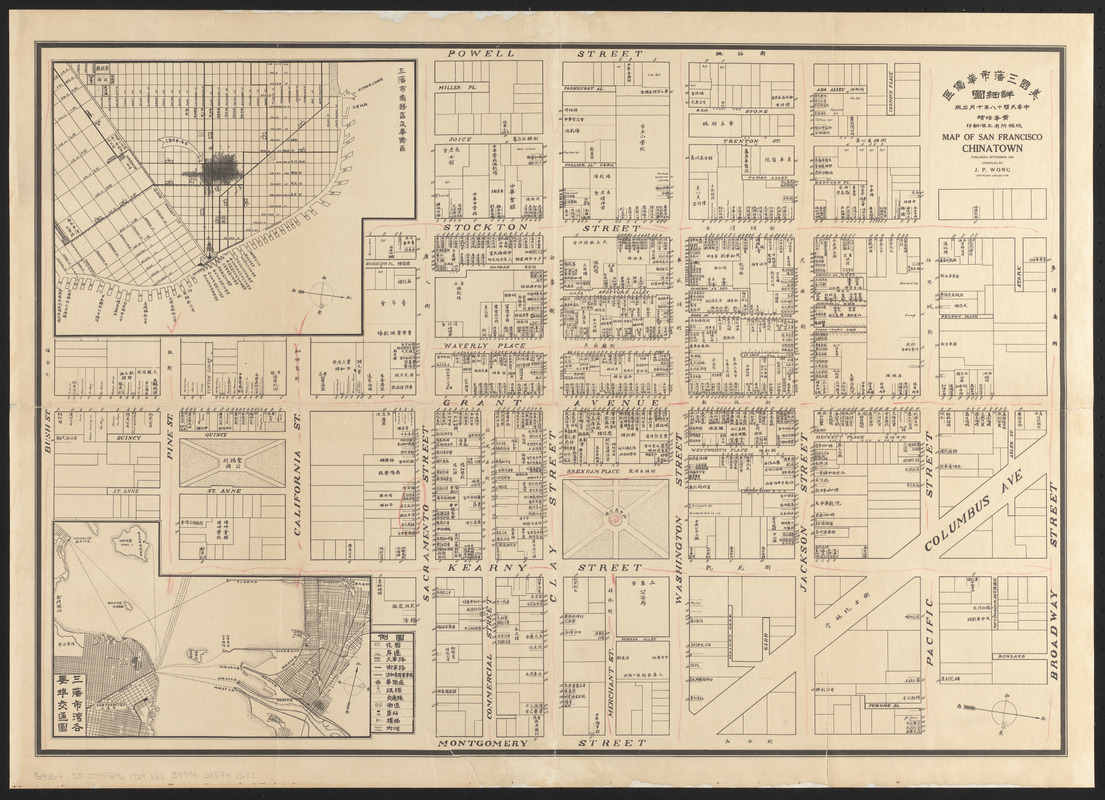
J.P. Wong
Mei guo san fan shi hua qiao qu: xiang xi tu=Map of San
Francisco Chinatown
San Francisco, 1929. Printed map, 18.5 x 26.5 inches.
Leventhal Map and Education Center. Donated by the family of
Mr. H. Wong, Boston Chinatown.
Many people from China and other Asian nations came to Hawaii and the West during the last half of the 19th century. Large numbers immigrated during the 1849 California Gold Rush, reaching 25,000 by 1852. During subsequent decades, they played an important role, though often exploited, as laborers for the transcontinental railroads. Prompted by racial discrimination and fears that Chinese laborers threatened American society, the 1882 Chinese Exclusion Act halted immigration from China. Many remaining immigrants created their own culturally distinct enclaves known as “Chinatowns.” Displayed here is a map of San Francisco’s Chinatown, the oldest and one of the largest Chinatowns in North America.
Viewpoint: San Francisco’s Chinatown is one of the oldest continuously inhabited ethnic communities in America, but this 1929 map gives no indication of that longevity nor of its central importance to American imperial history. As much as Sinophobes repeatedly tried for decades, they could not remove Chinese from the site. It was a location in continual flux; it was a permanent residence for some, but for many it was temporary, a way station between disembarkation and destinations elsewhere. So it was for thousands of railroad workers who came to help complete the first transcontinental route in the 1860s. Even building designations were incomplete and misleading: stores could house gambling dens in the back room; laundries could be living quarters; brothels could be homes for families and children. “Chinatown” is a simple name but an extraordinarily rich and complex site of human experiences.
–
Gordon H. Chang, Professor of History, Olive H. Palmer
Professor in Humanities, and Senior Associate Vice Provost
for Undergraduate Education, Stanford University
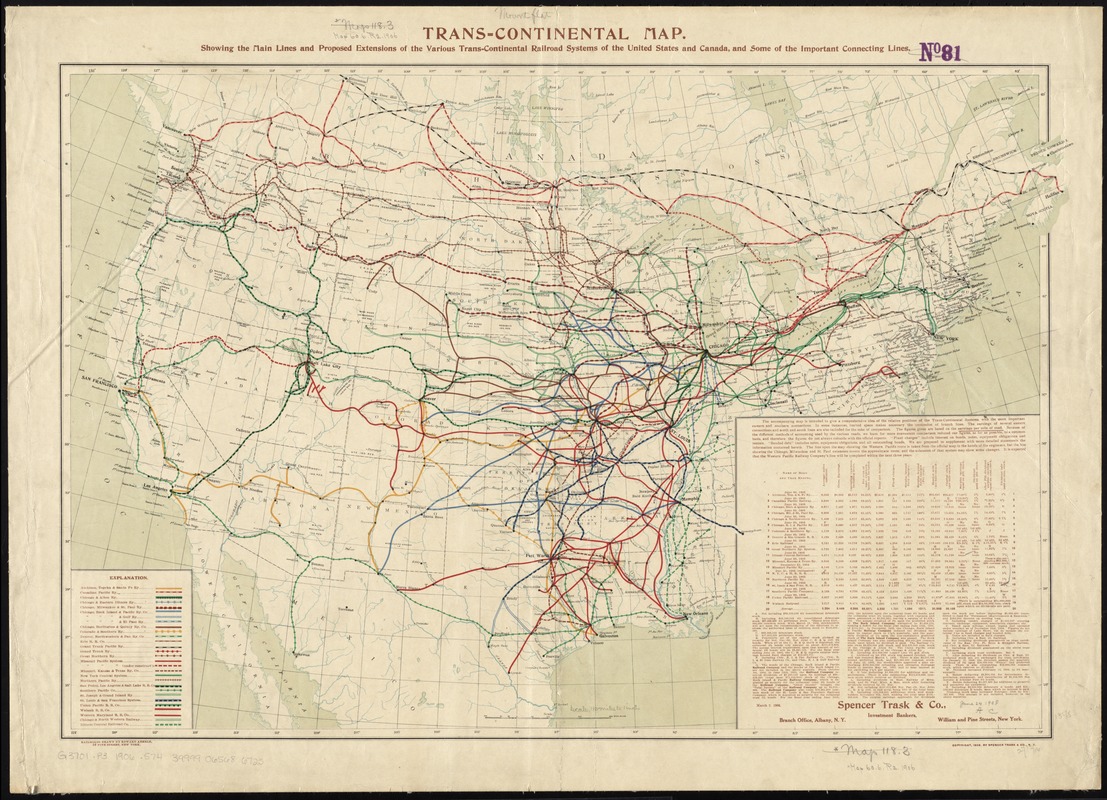
Spencer Trask & Co.
Trans-continental Map: Showing the Main Lines and
Proposed Extensions …
New York, 1906. Printed map, 19 x 29 inches.
Leventhal Map and Education Center.
At the end of the century, the nation’s railroad network grew
rapidly, resulting in a complex web that linked the eastern
and western parts of the country. This map, prepared by a New
York investment banker, represents the locations of the
transcontinental systems and their connections to eastern and
southern railroads. The legend identifies routes for 29
companies. The map highlights the impressive complexity of the
rail lines in the central United States. The major cities in
this region were centers of railroad traffic. Chicago had the
largest number of connections with at least 10 lines
converging on the city.
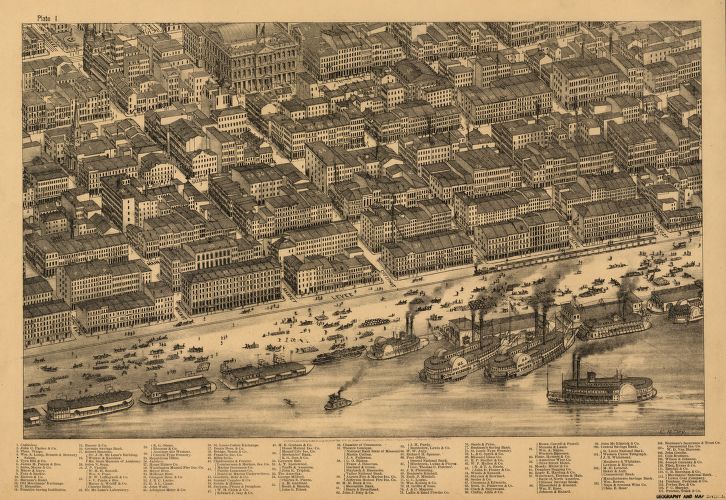
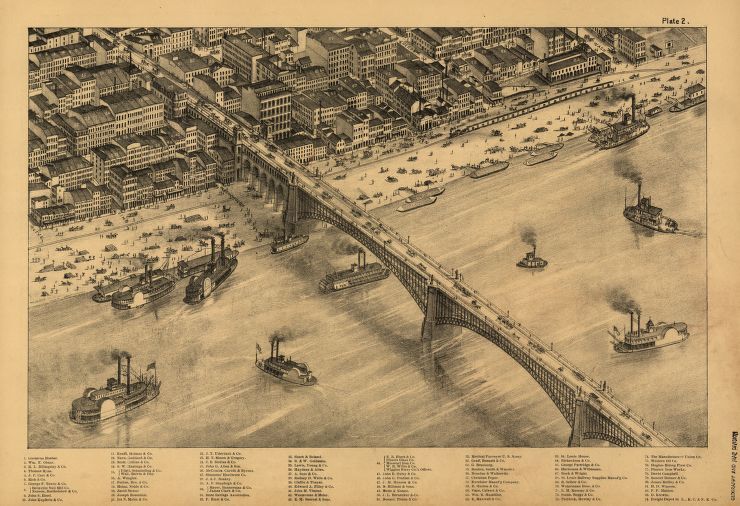
Richard J. Compton and Camille N. Dry (1842-ca. 1914)
Pictorial St. Louis, the Great Metropolis of the
Mississippi Valley …
St. Louis, 1876. Printed views, 15 x 41 inches.
Courtesy of Library of Congress Geography and Map Division. Reproduction 2019.
St. Louis’s riverfront, lined with more than a dozen
steamships, is featured on the opening two-page spread of this
atlas. Composed of 50 plates, the atlas provides an amazingly
detailed bird’s-eye perspective of every street and structure
in the city. The rise of steamboats, especially on the
Mississippi River, fueled the growth of cities like St. Louis
as hubs for trade and transportation. The legend at the bottom
of the plates lists many local businesses and manufacturers
that relied on the river and these boats.
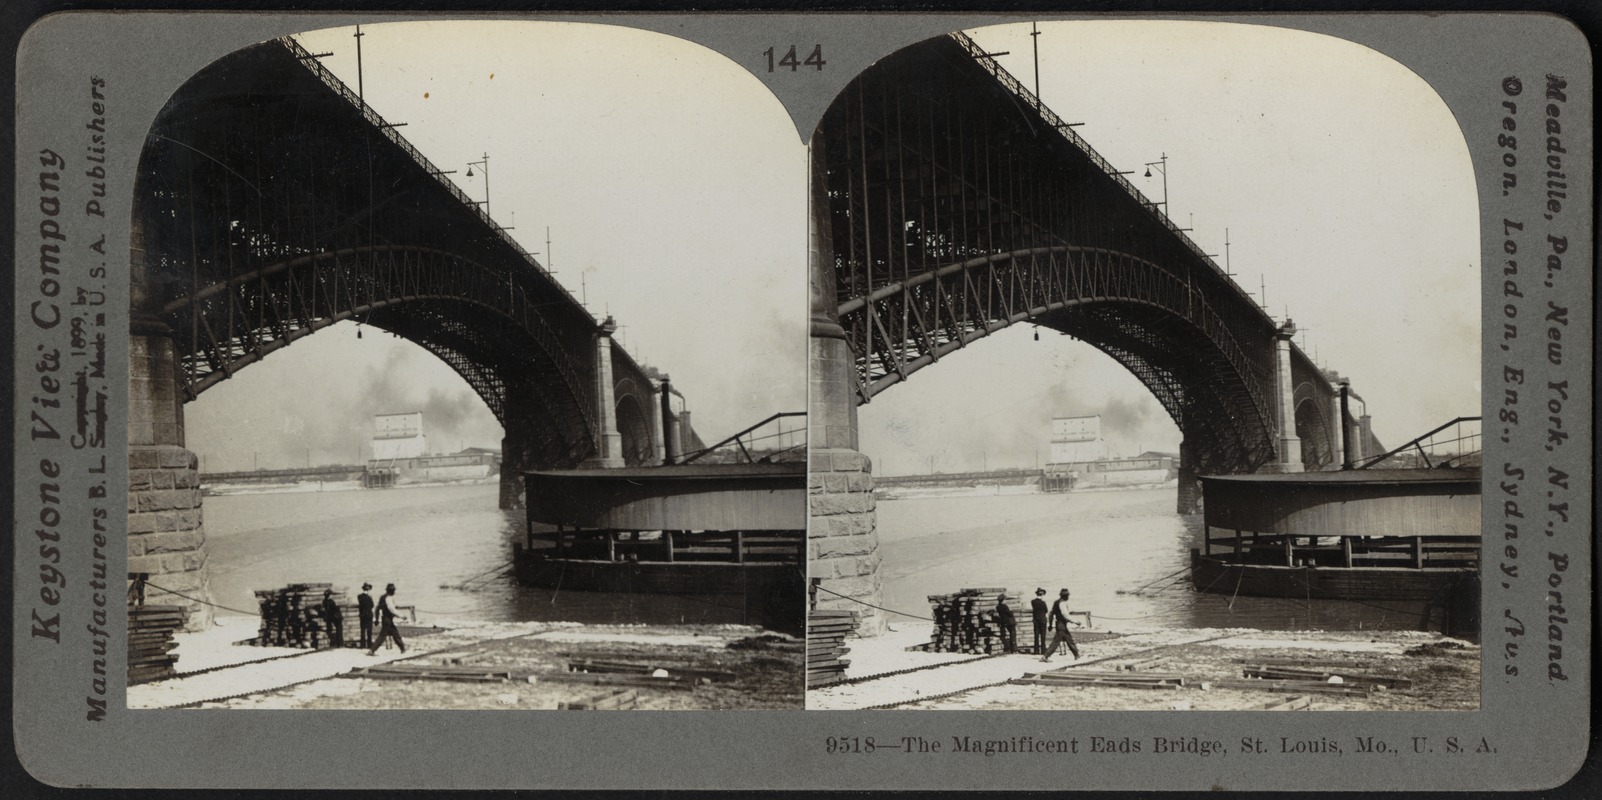
Keystone View Co.
The Magnificent Eads Bridge, St. Louis, Mo.
Meadville, PA, 1899. Stereograph, 3.5 x 7 inches.
Courtesy Boston Public Library, Print Department. Reproduction 2019.
Cutting diagonally across Plate 2 is the Eads Bridge, the
first railroad bridge to cross the Mississippi River. This
stereograph provides another perspective of the bridge. A
group of men stand near the base of one of the arches,
providing a sense of scale. The bridge was constructed with
steel from Andrew Carnegie’s factories. It opened in 1874 and
offered a new way for people and trains to cross the expansive
body of water. As the first bridge to be made of steel, it was
a breakthrough application for steel, leading to the building
of other large structures, including skyscrapers.
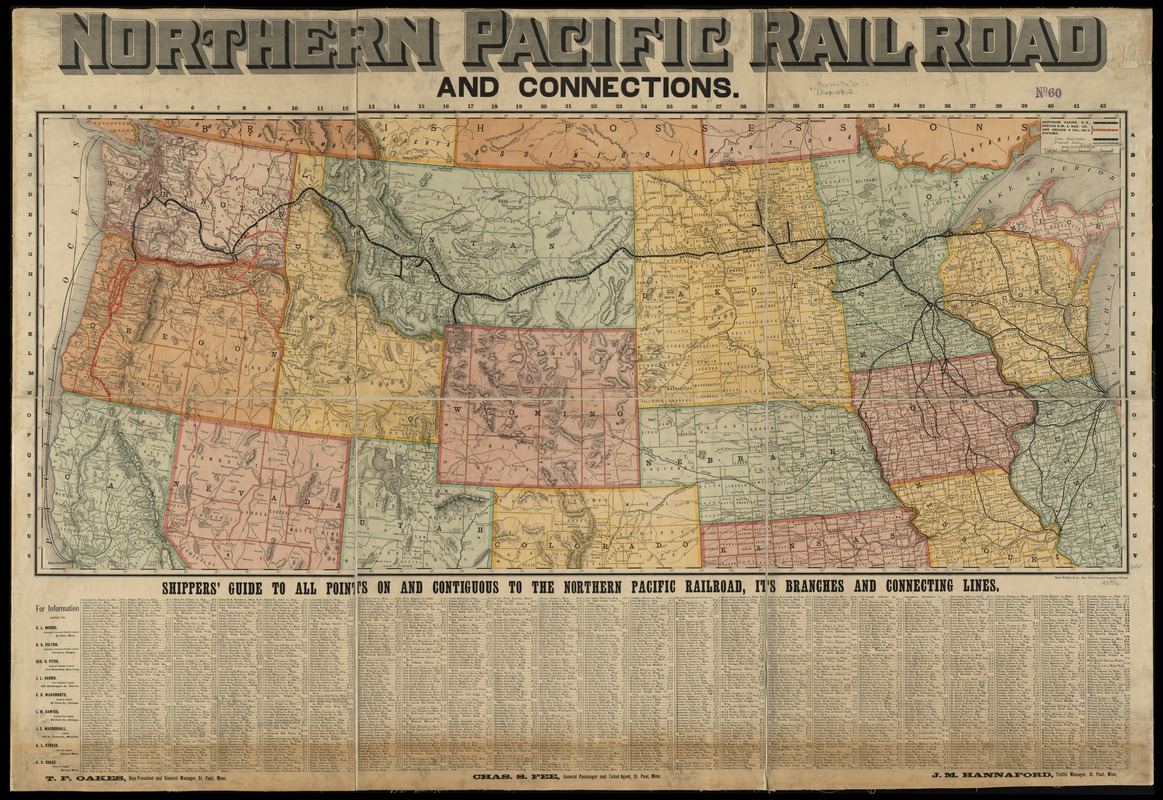
Rand McNally & Co.
Northern Pacific Rail Road and Connections
Chicago, 1885. Printed map, 23 x 54 inches. Leventhal
Map and Education Center.
In 1864, Congress authorized the Northern Pacific Railway
Company to construct a northern transcontinental route
extending from Minnesota to Washington state. Construction
began in 1870, but financial problems hindered progress.
Additionally, Native people were aware of the correlation
between constructing railroads and the influx of settlers into
their homelands and resisted the continued encroachment onto
their land. The route was completed in 1883. Rand McNally, a
major publisher of railroad maps, printed this map of the main
route and tributary routes in the mid-1880s. An alphabetical
index identifies the numerous towns and stations serviced by
the Northern Pacific and its associated network.
4a. POPULATION 1800-1862: Growth, Urbanization, and Diversity
As the United States transformed, so did its citizenry. Maps and data document the rapid growth of cities, the forced removals of Native people from their land, and the locations and number of enslaved people in the United States. Population grew from 4 million in 1790 to 30 million on the eve of the Civil War. Non-Native population densities increased, exhibiting a range of settlement concentrations from family farms and villages to cities, such as Chicago.
The nation’s ethnic and cultural composition changed
radically. As U.S. population and power spread across the
continent, indigenous peoples suffered genocide, while the
remaining tribal nations were forced to move from their
homelands onto much smaller reservations. African-Americans
had been brought to North America since the beginning of the
17th century, but most remained enslaved until the Civil War.
Adding to the nation’s cultural diversity, Western European
immigrants, largely from Germany and Ireland, came during the
first half of the century. By the end of the century,
immigrants came from a greater variety of places, including
China and southern and eastern Europe.
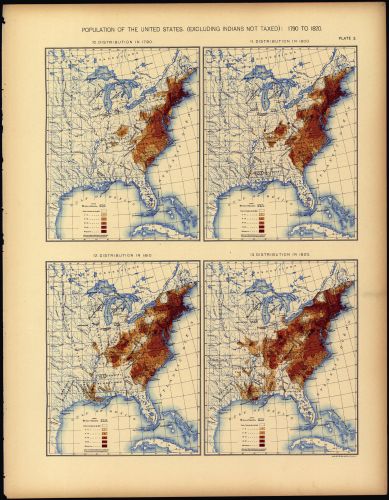
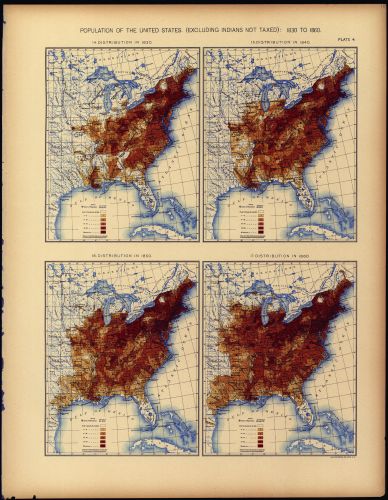
Henry Gannett (1846–1914)
“Population of the United
States (Excluding Indians Not Taxed): 1790-1820,” and “…
1830-1860,” from “Statistical Atlas of the United States
…”
Washington, DC, 1898. Printed maps, 21 x 16 inches. Courtesy of the
Library of Congress Geography and Map Division. Reproduction, 2019.
Using data from the 1890
census, the Census Office prepared a landmark atlas featuring
an array of thematic maps and statistical graphics. Besides
mapping the 1890 distribution of population across the
continent, it also included a series of maps that plotted
population distribution and density for each decennial census.
For example, the 1790 map shows the densest population
extending along the Atlantic coast from southern Maine to
northeastern Georgia, with scattered clusters extending beyond
the Appalachian Mountains. By 1860, the densest populations
extended across the eastern half of the country to the Great
Plains.
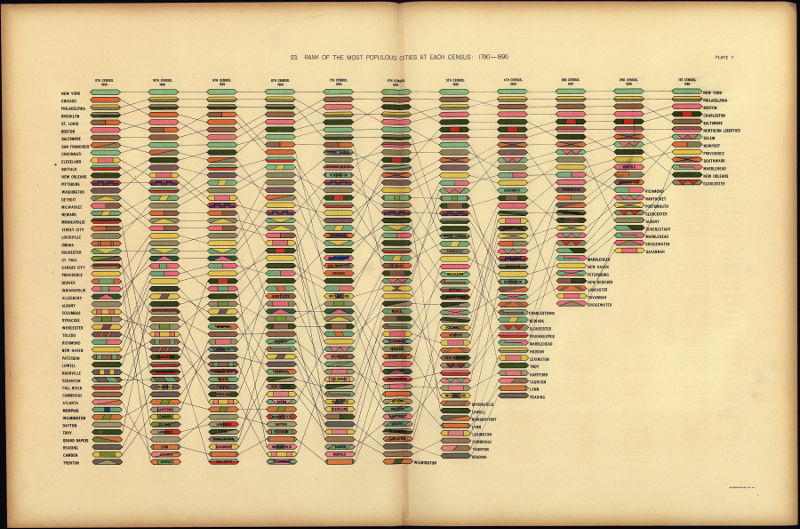
Henry Gannett (1846–1914)
“Rank of the Most Populous
Cities at Each Census: 1790-1890,” from “Statistical Atlas
of the United States …”
Washington, DC, 1898. Printed
map, 21 x 32 inches. Courtesy of the
Library of Congress Geography and Map Division. Reproduction, 2019.
In addition to maps, the 1890 “Statistical Atlas” included a
variety of innovative graphics. This chart lists major cities
from the highest to lowest populations, from New York City to
Trenton, New Jersey. Each column to the right features data
from an earlier census. A line traces the rise and fall of the
city’s population over time. For example, note that New York
City has had the highest population since the nation’s first
census in 1790. Chicago, in contrast, was not even considered
a major city until 1850. The Midwestern hub grew rapidly to
become the second largest city by 1890.
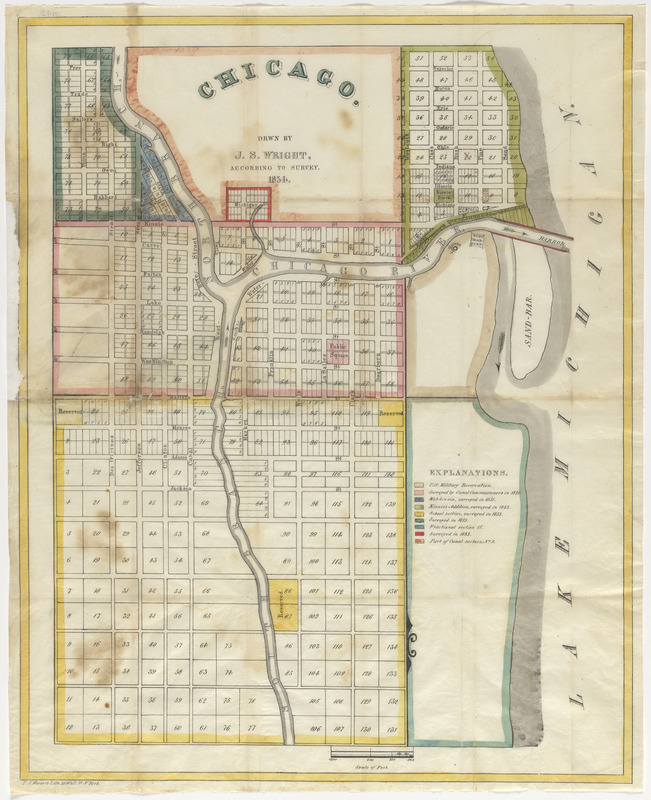
J.S. Wright (fl. 1834)
“Chicago”
New York, 1834.
Printed map, 26 x 21 inches. Courtesy of Lawrence
Caldwell.
The founding of Chicago as a transportation, commercial, and
industrial hub started in the 1830s, although the area was
home to earlier Native, French and U.S. Army activities. The
town was surveyed in 1830 and incorporated in 1833, with a
population of 350. This 1834 map depicts the original
configuration of the streets and blocks, which covered
approximately 2.5 square miles. The site consisted of two
entire sections and two partial sections in Township 39 North,
Range 14 East, of the Third Principal Meridian. The map is
color-coded to indicate the dates that various portions of the
town were surveyed.
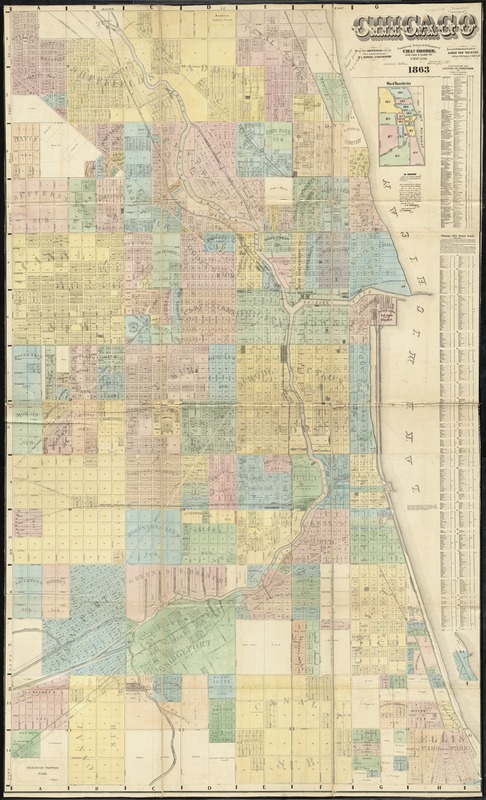
W.L. Flower and James Van Vechten (fl. 1860–1882)
“Chicago:
Drawn from Davie's Atlas with the Latest Recorded
Subdivisions”
Chicago, 1863. Printed map, 75 x 44.5
inches. Leventhal Map and Education Center.
Situated on the southwestern shore of Lake Michigan, Chicago
commanded a short land portage between the Great Lakes and
Illinois River, giving it access to the Mississippi River
Valley. By 1860, Chicago’s population grew to 110,000, making
it the nation’s ninth largest city. This rapid growth is
demonstrated with an 1863 map highlighting the real estate
subdivisions added to the city. Its geographical footprint had
expanded dramatically from the original town plat of 2.5
square miles, extending 4-6 miles to the north, south, and
west. Throughout this expansion, the street pattern continued
to follow the grid pattern guided by General Land Office’s
township surveys.
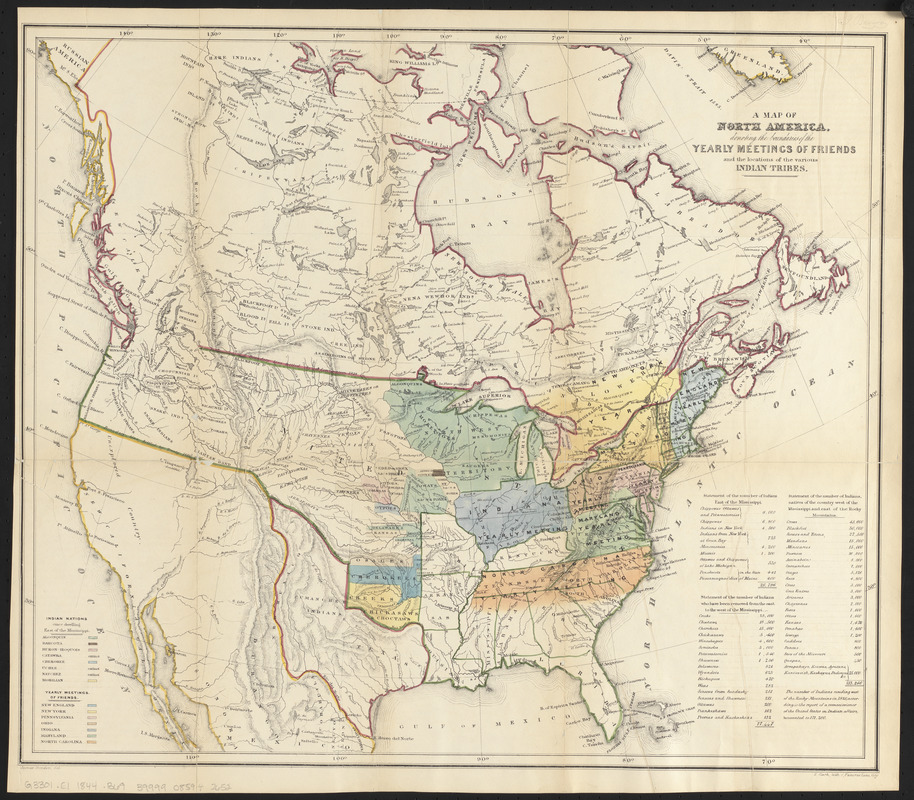
James Bowden (b. 1811)
“A Map of North America
Denoting … the Locations of the Various Indian Tribes,” from
“Some Account of the Conduct … towards the Indian Tribes . .
.”
London, 1844. Printed map, 18 x 21 inches. Leventhal
Map and Education Center.
From the earliest European settlements in North America
through the 19th century, Catholic and Protestant missionaries
took part in evangelizing missionary expeditions to Native
communities. One particularly active religious group was the
Society of Friends, or Quakers. Besides detailing the
missionary activities of the various regional Yearly Meetings,
their 1844 annual report included this map which shows the
extent of each Yearly Meeting as well as the lands in the
Great Plains allotted to eastern tribes. It also depicts the
distribution of Indigenous communities in the western half of
the country.
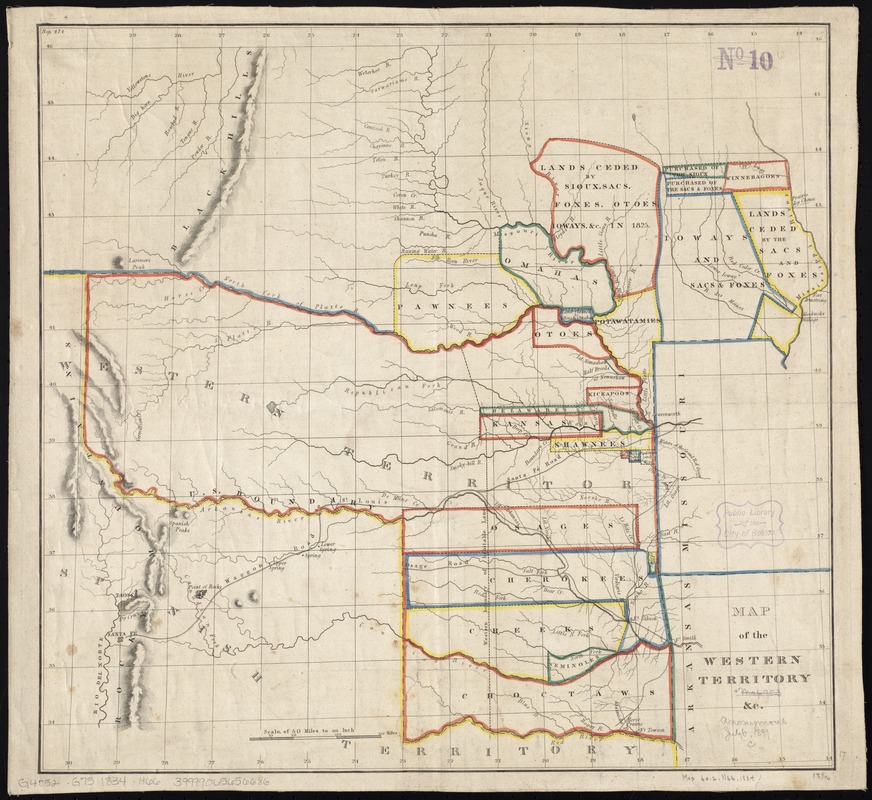
Washington Hood (1808–1840)
“Map of the Western
Territory &c.” from U.S. Committee on Indian Affairs,
“Regulating the Indian Department”
Washington, DC,
[1834]. Printed map, 17 x 18 inches. Leventhal Map and
Education Center.
The geography of tribal nations living east of the Mississippi
River changed drastically by the 1830s, as depicted on this
map accompanying a report concerning the establishment of a
new Western Territory reserved for Native people. As American
settlers moved into the Ohio River Valley, numerous tribes
were forced to cede their lands and relocate west of the
Mississippi River. In addition, the 1830 Indian Removal Act
mandated the mass removal of the Tsalagi (Cherokee), Mvskoke
(Creek), Chahta (Choctaw), Chickasha (Chickasaw), and Semvnole
(Seminole) living in southeastern United States. Although this
new territory was promised as theirs in perpetuity, it was
eventually opened for settlement and statehood for Oklahoma.
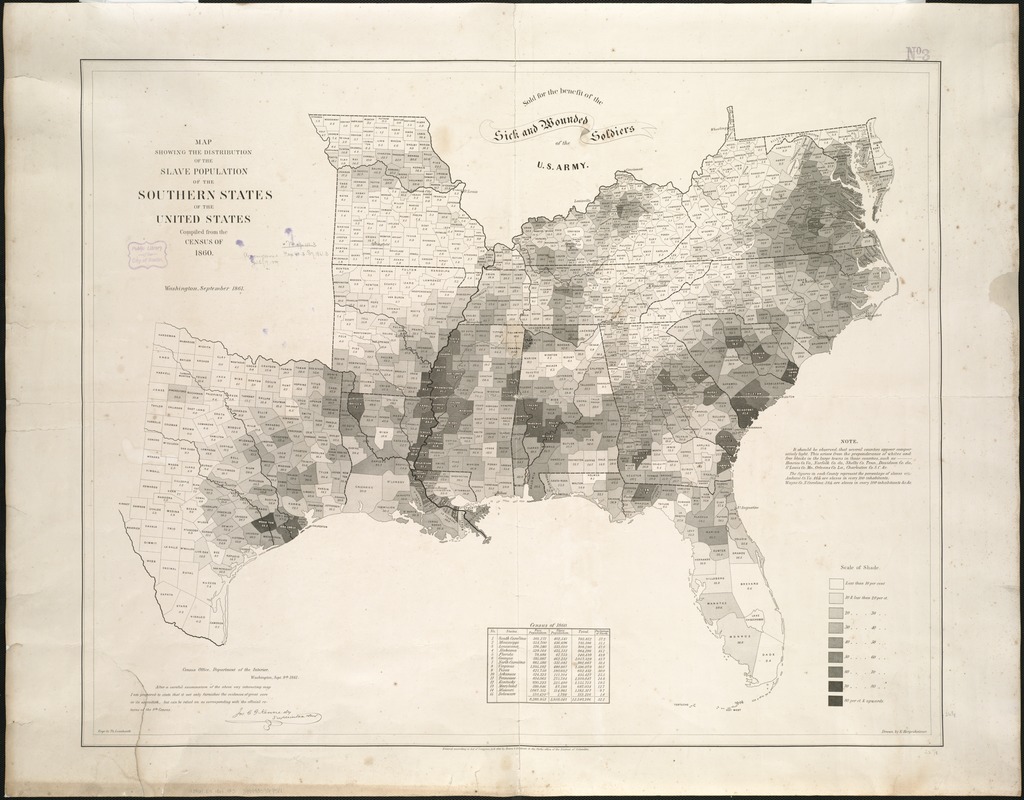
Edwin Hergesheimer (fl. 1853–1885)
“Map Showing the
Distribution of the Slave Population of the Southern States
of the United States … “
Washington, DC, 1861. Printed
map, 31 x 40 inches. Leventhal Map and Education Center.
Enslaved people were introduced into the economy of the 13 British North American colonies in the 17th century. By 1860, when this map was published, the enslaved population, primarily of African descent, numbered almost four million people, comprising about 12 percent of the nation's population. This early thematic map uses shades of gray and black to plot the percentage of enslaved people by county for the southern states at the beginning of the American Civil War. In many places enslaved African people greatly outnumbered Whites. Such places often used a variety of laws and practices intended to limit communication, enact terror, and discourage revolts. Rather than a uniform distribution throughout the entire region, chattel slavery was concentrated in several regions where commercial plantation agriculture was most profitable.
4b. POPULATION 1862-1900: Growth, Urbanization, and Diversity
As the United States transformed, so did its citizenry. Maps and census data document the rapid growth of cities, the forced removals of Native people from their land, and the locations and number of enslaved people in the United States. From 1790 to 1900, the population increased almost twentyfold, growing from 4 million to 76 million. Population densities increased, exhibiting a range of settlement concentrations from family farms and villages to massive cities such as Chicago. The nation’s ethnic and cultural composition changed radically and the relationship between government policy and the people living during this period created dilemmas of inequality and prejudice that we are still dealing with today.
As U.S. population and power spread across the continent, indigenous peoples suffered genocide, while the surviving tribal nations were forced to move from their homelands onto much smaller reservations. African Americans, who had been brought to North America since the beginning of the 17th century, mostly remained enslaved until the Civil War. Adding to the nation’s cultural diversity, Western European immigrants, largely from Germany and Ireland, came during the first half of the century. By the end of the century, immigrants were coming from a greater variety of places, including China and southern and eastern Europe.
For Kids
With the Civil War over and American
industry on the rise, the population of the United States
exploded. Immigrants from Europe and Asia came hoping to get
good jobs in factories or to claim land of their own in the
west. Black Americans were also increasing in numbers as they
rebuilt their families after enslavement, some leaving the
south for northern cities and western land opportunities. But
growth had a serious price. The government took even more of
the small amount of remaining land promised to Native nations,
transferring it to settlers and mining and railroad companies.
- Look at the maps in this section and look for evidence of change. What do you notice about where people are living?
-
How do you think life was different in cities than in less
populated areas?
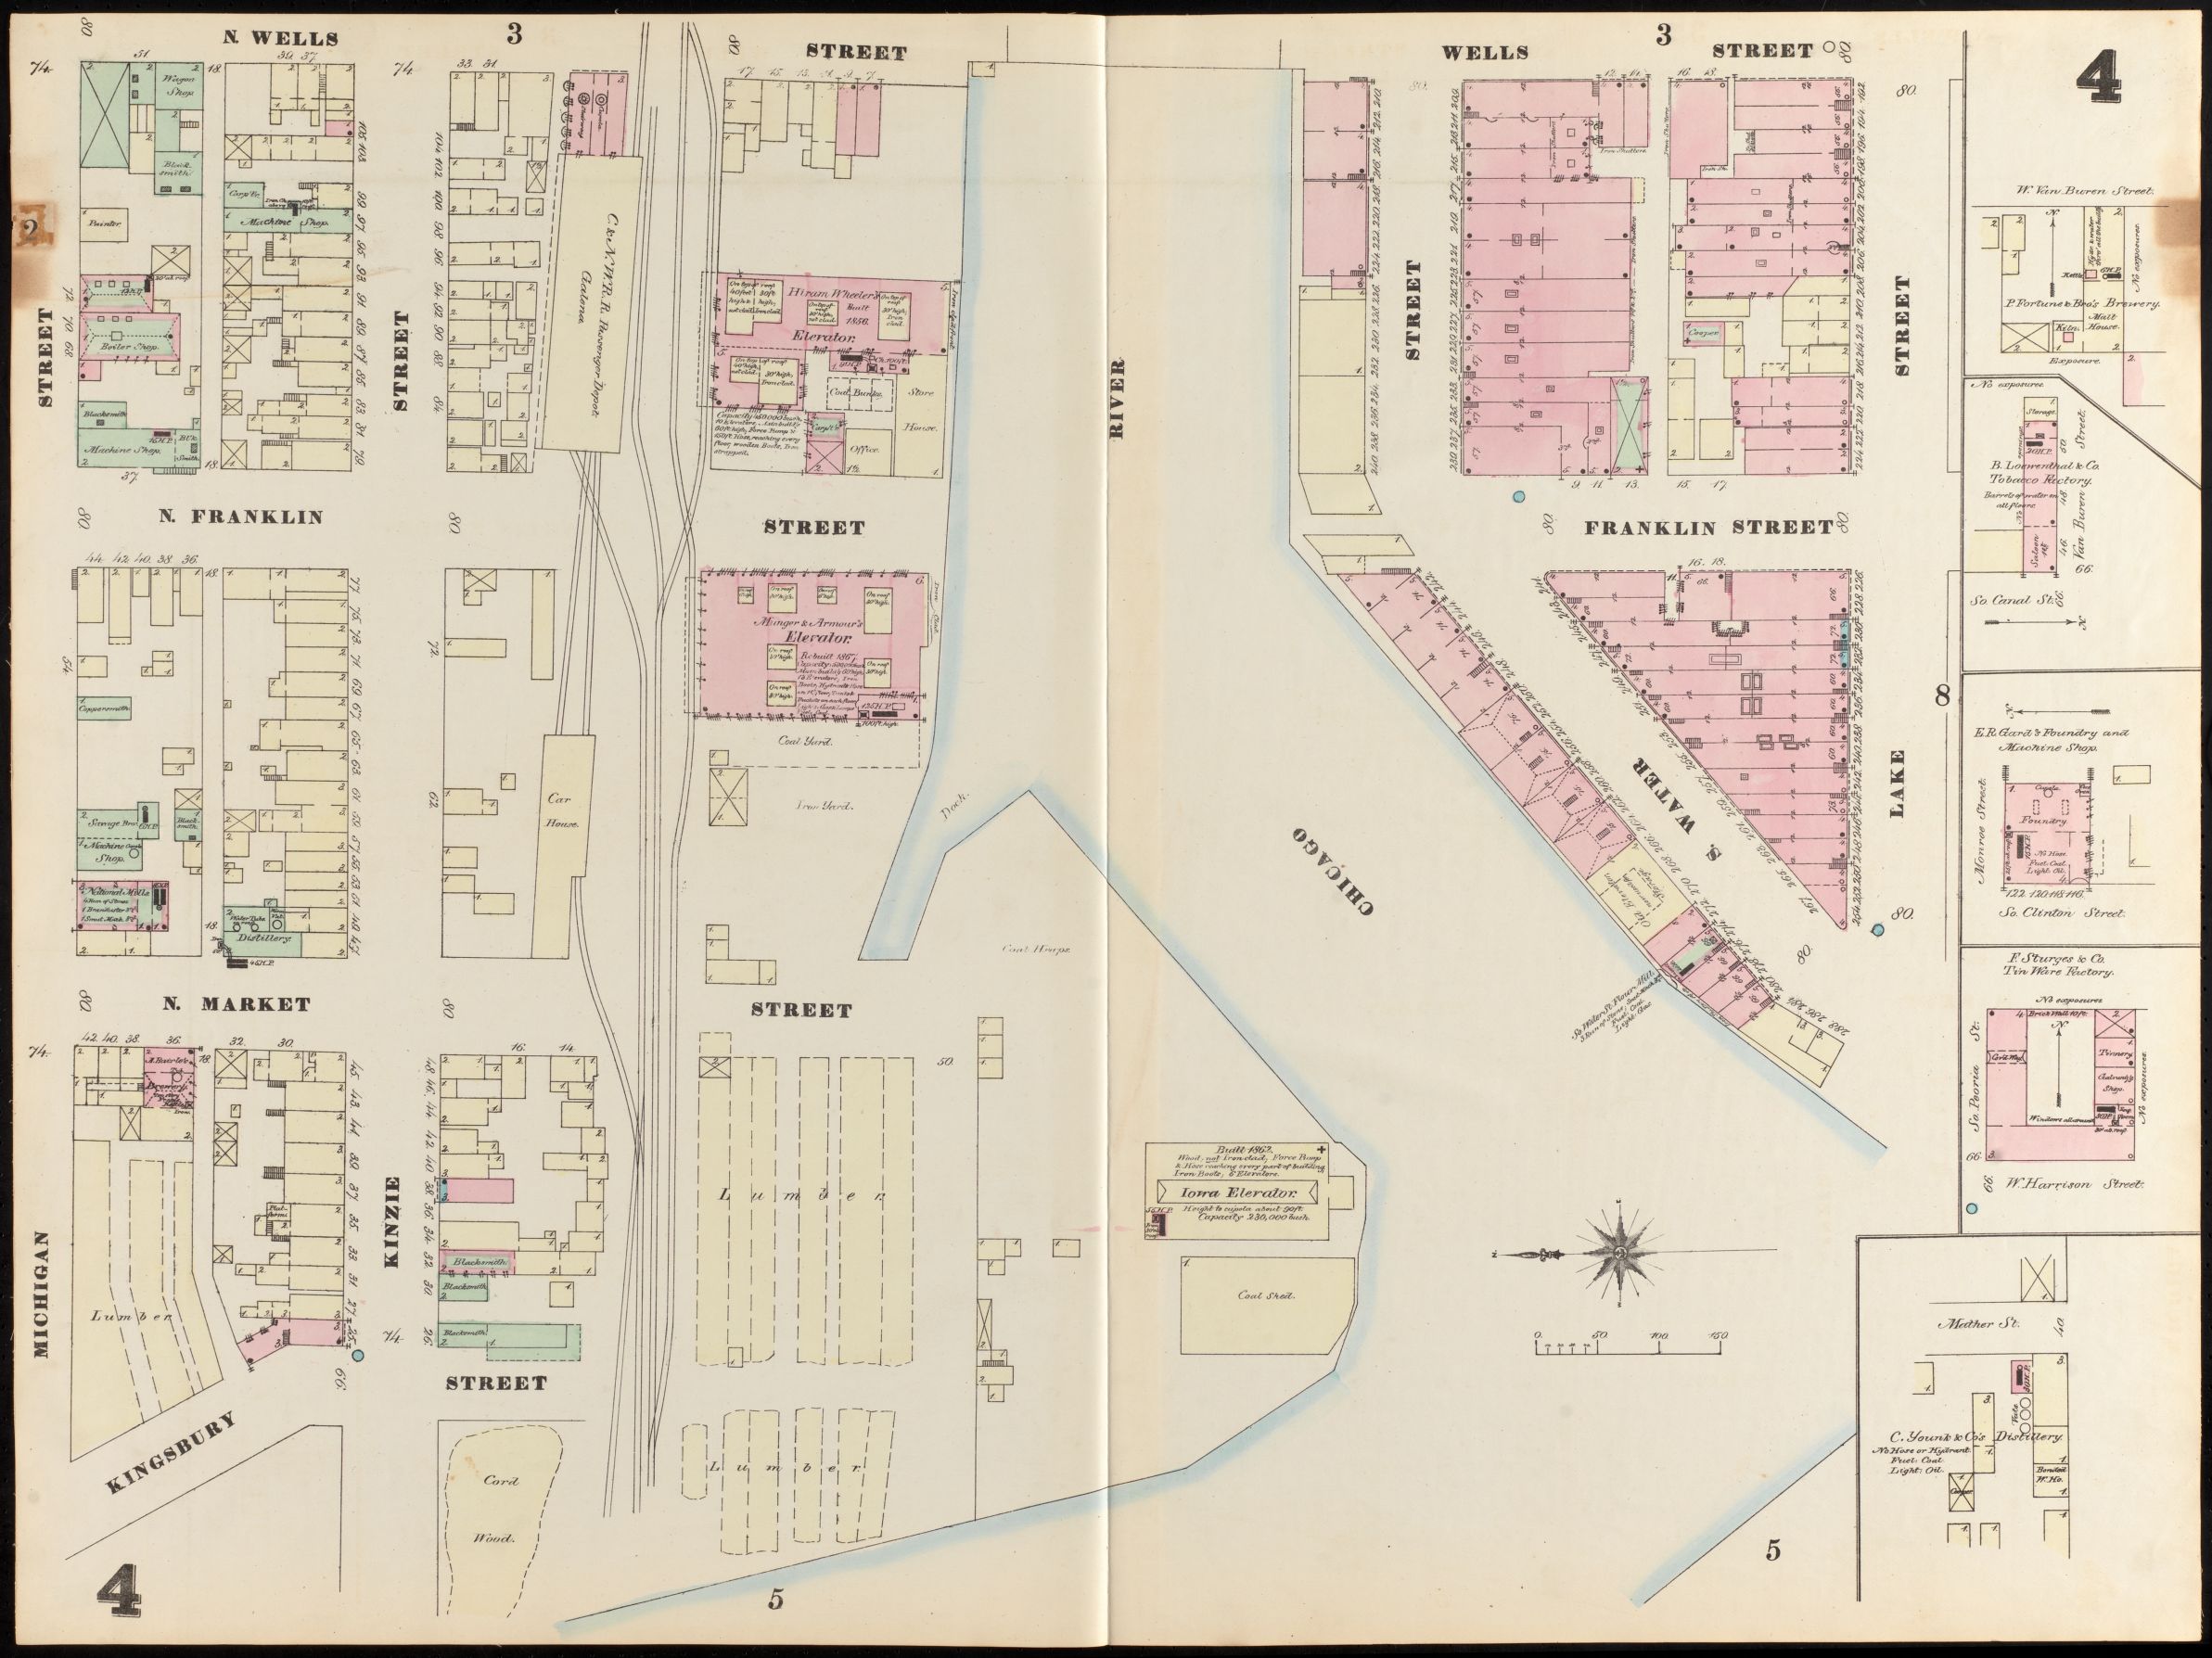
Daniel A. Sanborn (1827-1883)
“Sheet 4” from
Insurance Map of Chicago …
New York, 1868-1869.
Printed map, 27 x 36 inches. Leventhal Map and Education
Center. Reproduction 2019.
With the construction of a canal and numerous railroads by the
1860s, Chicago became a transportation hub linking the East
and West. The city emerged as a processing center for natural
resources and agricultural commodities produced in the
surrounding region. Early fire insurance atlases provide
evidence of these economic activities. This sheet, depicting
an area along the Chicago River, locates a rail yard with
terminal rail lines, coal yards, lumber yards, four grain
elevators, four breweries or distilleries, and assorted other
factories. Solid lines denote a building’s footprint, while
colors represent the construction material based on its
likeliness to burn: yellow for wood, pink for brick.
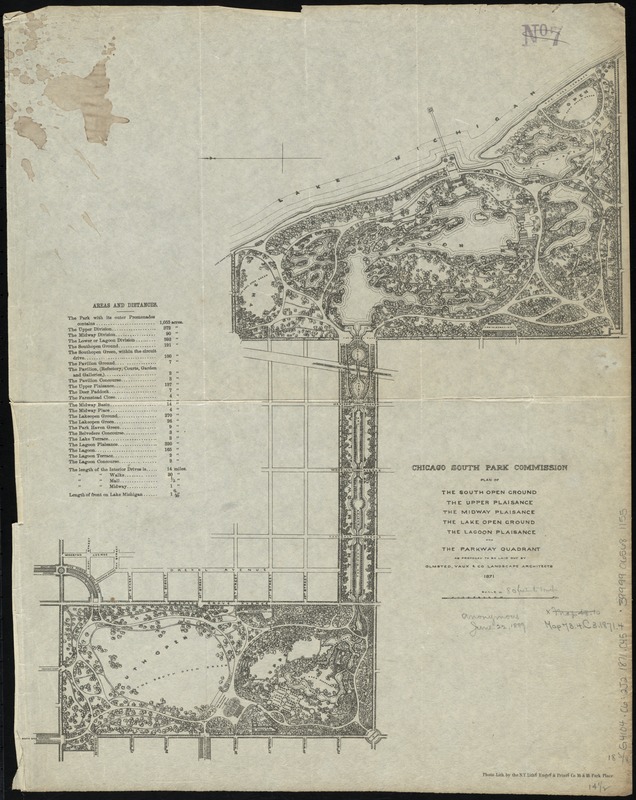
South Park Commission (Chicago, Ill.)
Plan of the South Open Ground … as Proposed to Be Laid
Out by Olmsted, Vaux & Co.
Chicago, 1871. Printed map, 18.5 x 14.5 inches.
Leventhal Map and Education Center.
As people flocked to cities in the late 19th century,
Americans recognized that cities lacked space where locals
could enjoy nature and its health benefits. In 1869, Chicago
decided that it needed a system of parks and green boulevards.
City officials hired Frederick Law Olmsted, who had designed
New York City’s Central Park and Boston’s Emerald Necklace.
This plan, published in 1871, offers a vision of Chicago with
open lawns, trees, and a lagoon along Lake Michigan. This site
was chosen for the location of the 1893 Chicago World’s Fair,
and today this chain of green spaces is Washington Park, the
Midway Plaisance, and Jackson Park.
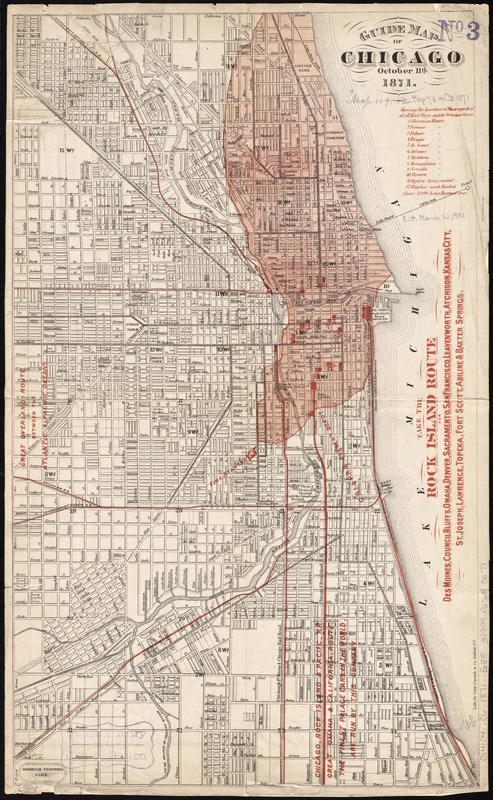
Clay, Cosack & Co.
Guide Map of Chicago, October 11th, 1871
Buffalo, 1871. Printed map, 18.5 x 11 inches.
Leventhal Map and Education Center.
By 1870, Chicago’s population approached 300,000, making it
the nation’s fifth largest city. This guide map, published
just after the Great Chicago Fire, superimposes the burned
area over the gridded street pattern. The fire started
southwest of the city center and burned over 2,000 acres,
noted by the shaded red area. A strong southwest wind, wooden
structures, and summer drought fueled the flames that left
approximately 100,000 people homeless. Though legend suggests
that a cow caused the flames by knocking over a lantern, the
real cause is unknown. In reaction to the mass destruction,
city officials and urban planners lobbied for stricter
building codes and better fire-fighting services."
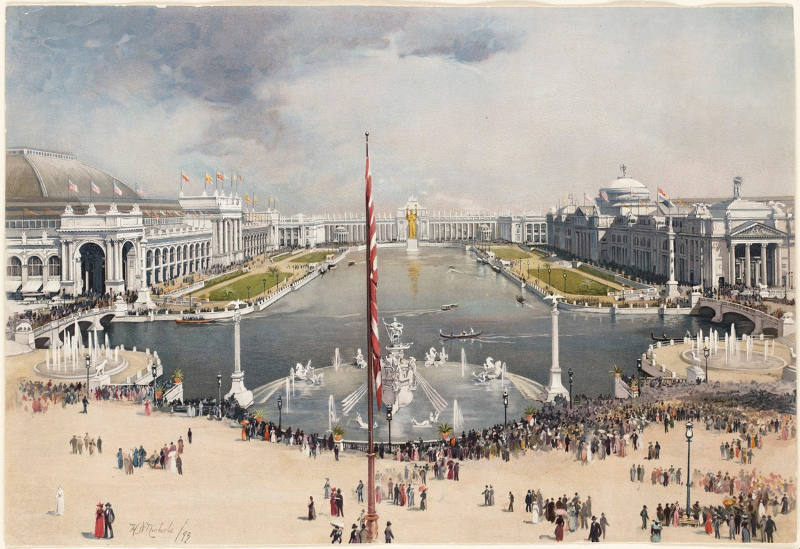
Harley Dewitt Nichols (1859-1939)
Chicago World’s Fair
Boston, 1893. Chromolithograph, 6 x 9 inches.
Courtesy of Boston Public Library, Print Department. Reproduction 2019.
Two decades later, the Chicago World’s Fair, held in 1893, affirmed that clean, organized cities with public green spaces were the future. This view of Chicago’s 1893 World’s Fair, published by Louis Prang, details the splendor of the remarkable grounds. Daniel Burnham and John Root envisioned the white buildings with neoclassical features while Frederick Law Olmsted designed the landscape. The fair spurred the City Beautiful movement across the country and prompted Chicago to reevaluate its own plans for growth.
VIEWPOINT: The World’s Fair was meant to celebrate the achievements of the nations of the world, but the United States told its own story through a deliberate omission of nonwhite stories. Many African Americans “saw no reason for rejoicing when they knew that America could find no representative place for a colored man, in all its work,” as F. L. Barnett wrote in an 1893 pamphlet criticizing the fair. In fact, Haiti made the American abolitionist Frederick Douglass one of their own commissioners to the fair, “through which courtesy the Colored American received from a foreign power the place denied to him at home.”
– Ida B. Wells, ed., with contributions from Frederick
Douglass, I. Garland Penn, and F. L. Barnett,
The Reason Why The Colored American is not in the World's
Columbian Exposition: The Afro-American's Contribution to
Columbian Literature
(1893)
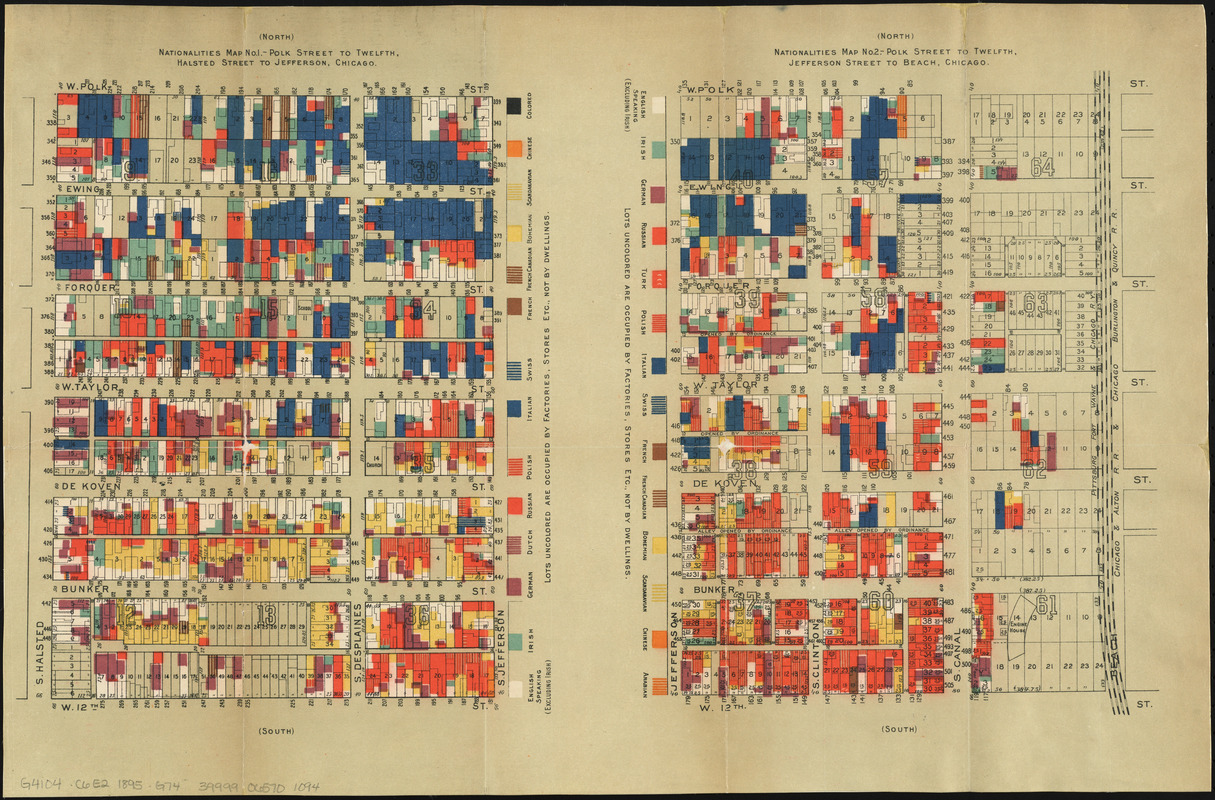
Samuel Sewell Greeley (1824-1916) and Agnes Sinclair
Holbrook (1867-1896)
“Nationalities Map No. 1 … ” from
Hull House Maps and Papers
New York, 1895.
Printed map, 14.5 x 21.5 inches. Leventhal Map and Education
Center.
Immigrants often settled in cities like Chicago, where they
could find jobs and communities of people from their native
countries. In 1889, Jane Addams founded a settlement house in
Chicago, called Hull House, offering newcomers childcare as
well as classes in English and civics. In this thematic map,
based on a survey of the Hull House neighborhood, each color
represents a different nation of origin. Italians (dark blue)
gathered on some blocks, while others hosted Russian and
Polish families (orange). These maps were among the first to
illustrate social data as location based.
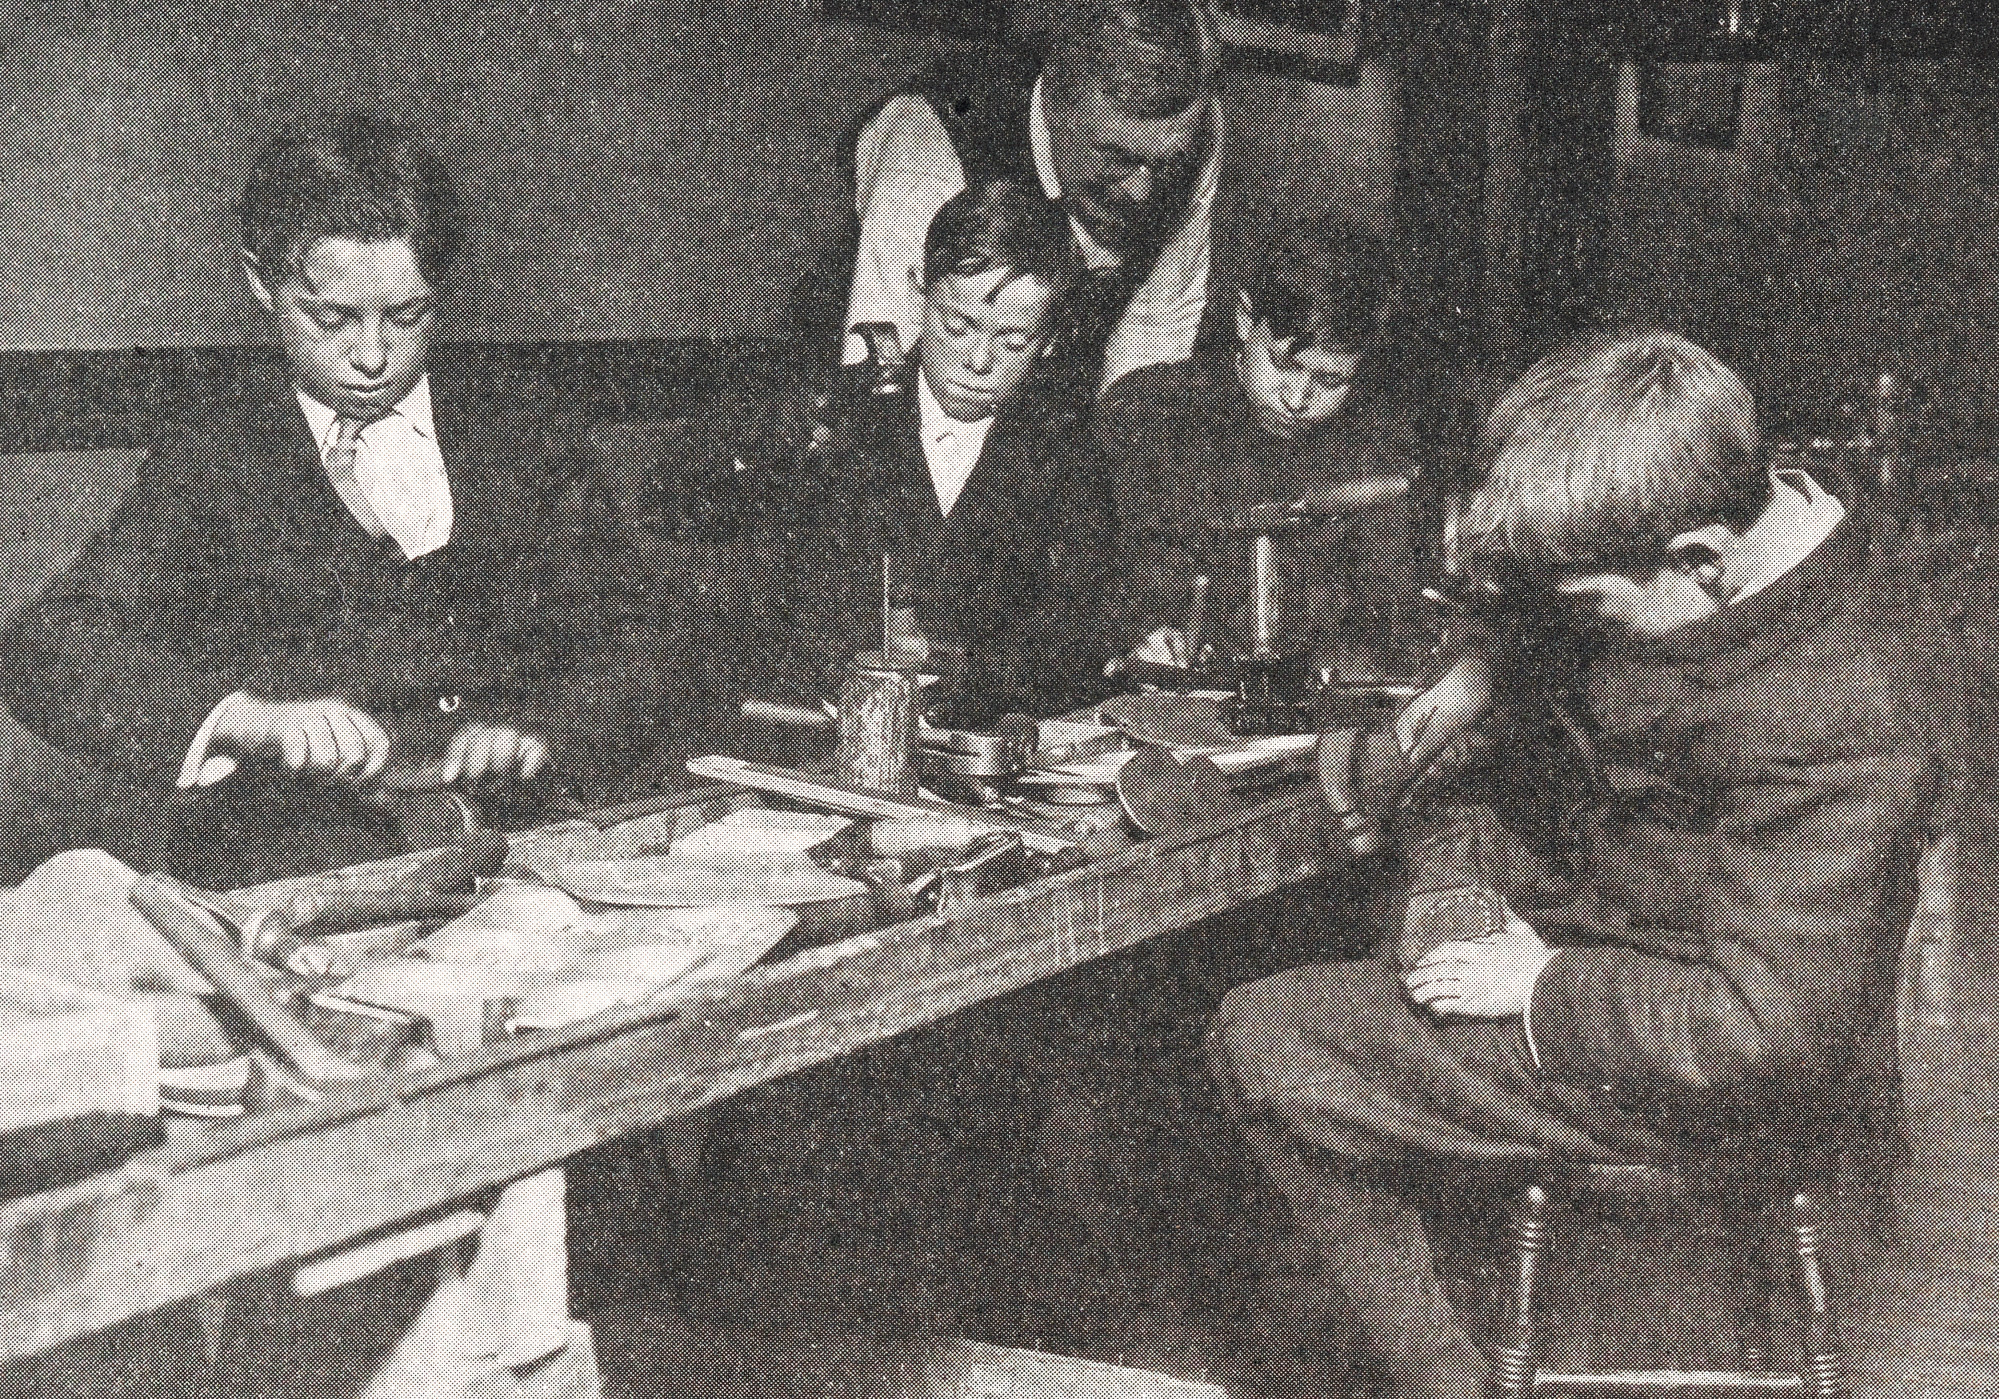
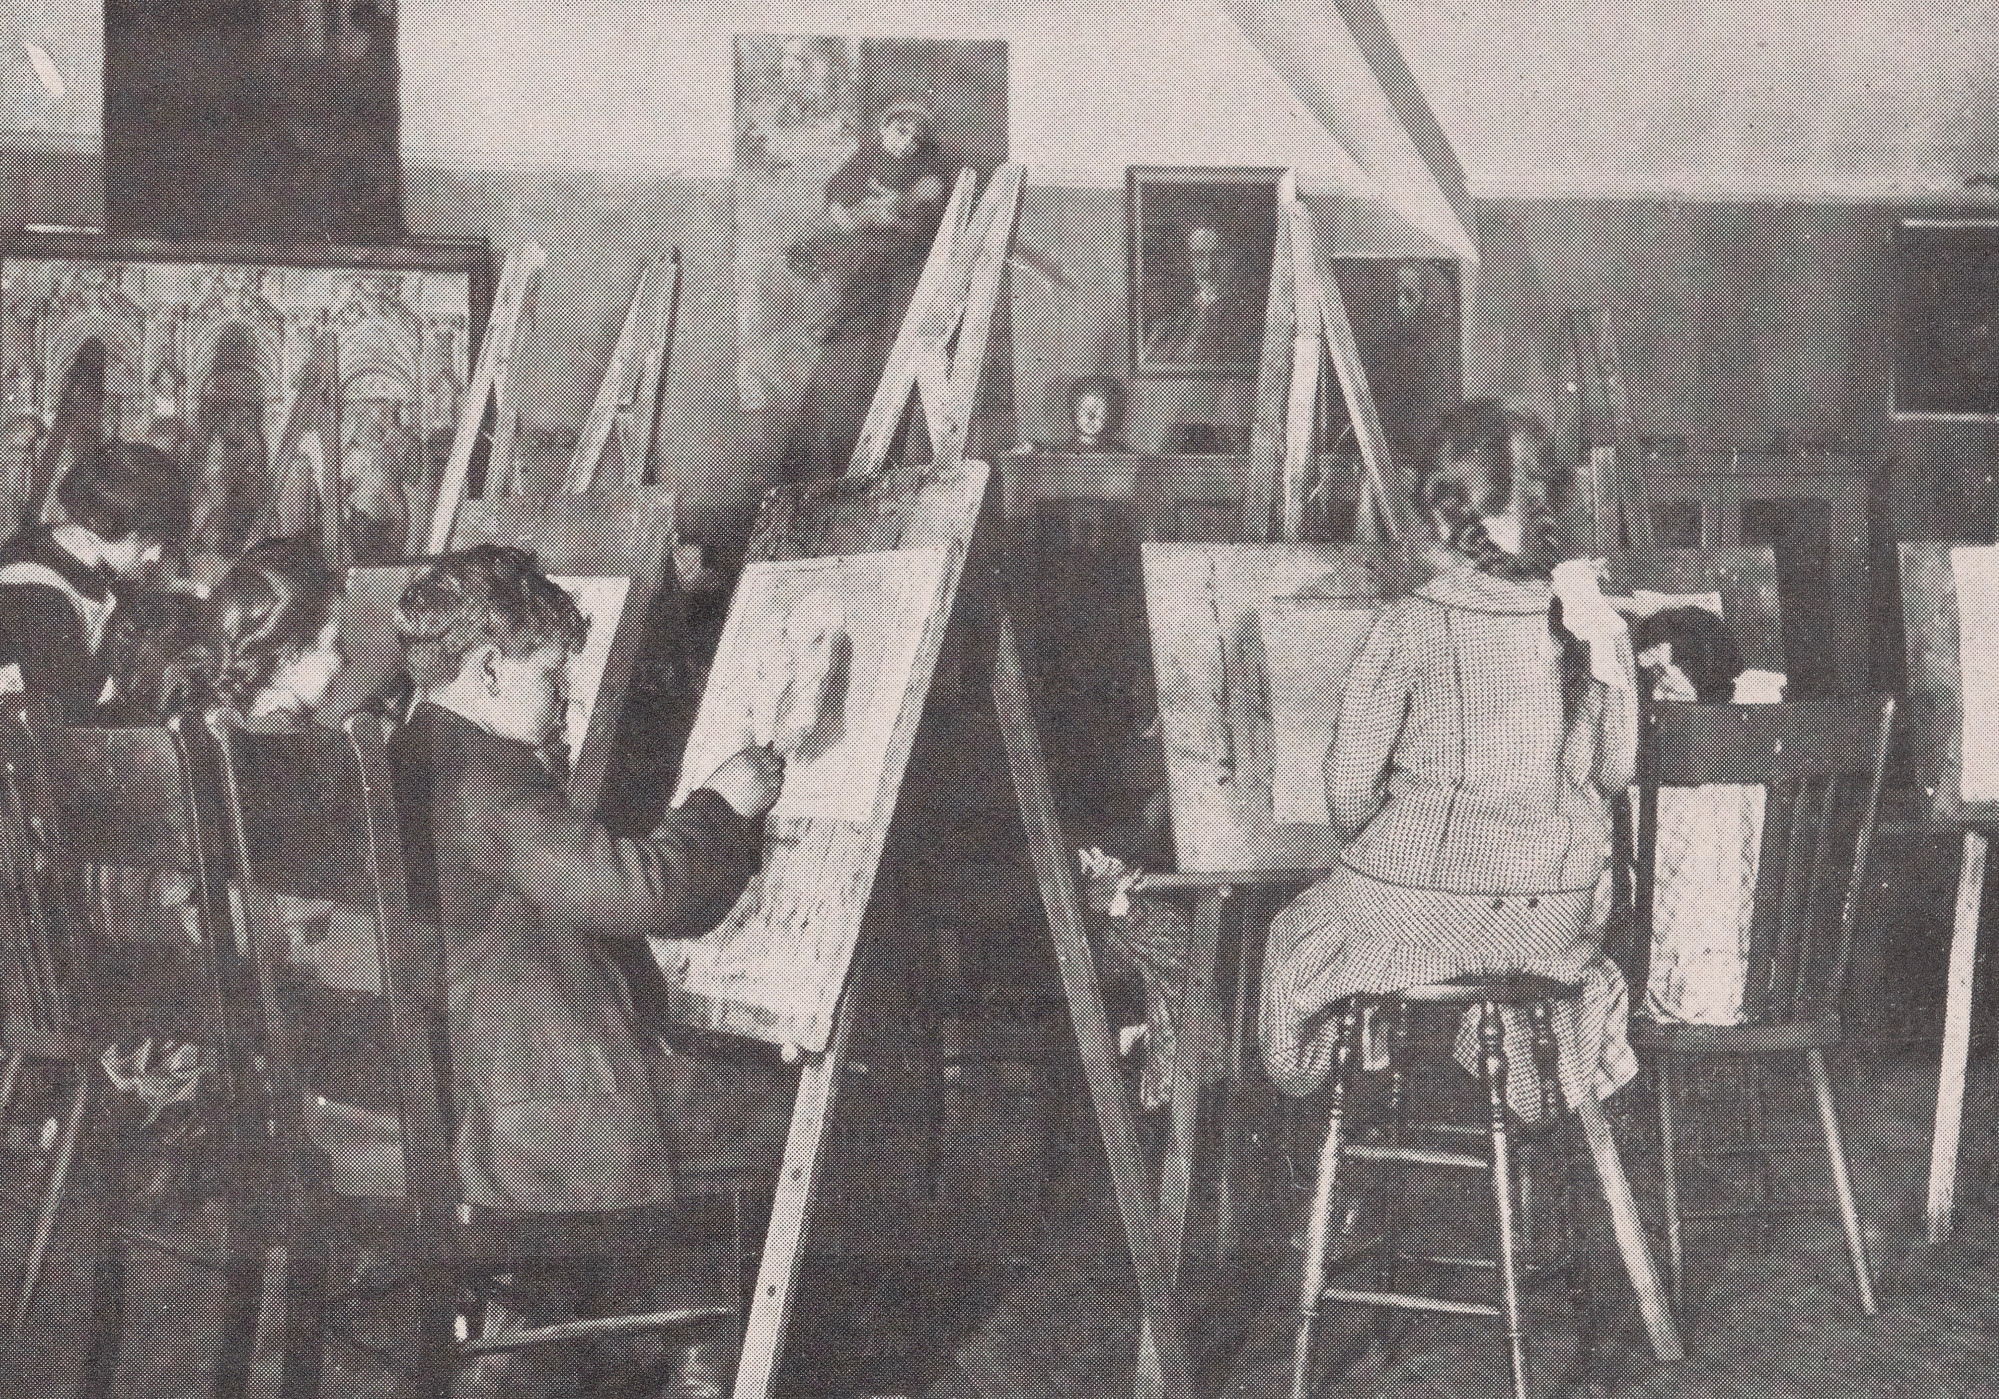
“In the Boys' Club Cobbling Class,” image 435-5546 and “In the Studio,” image 435-5560. Yearbook, 1910. Hull House Year Book Photos, Special Collections and University Archives, University of Illinois at Chicago. Reproduction 2019.
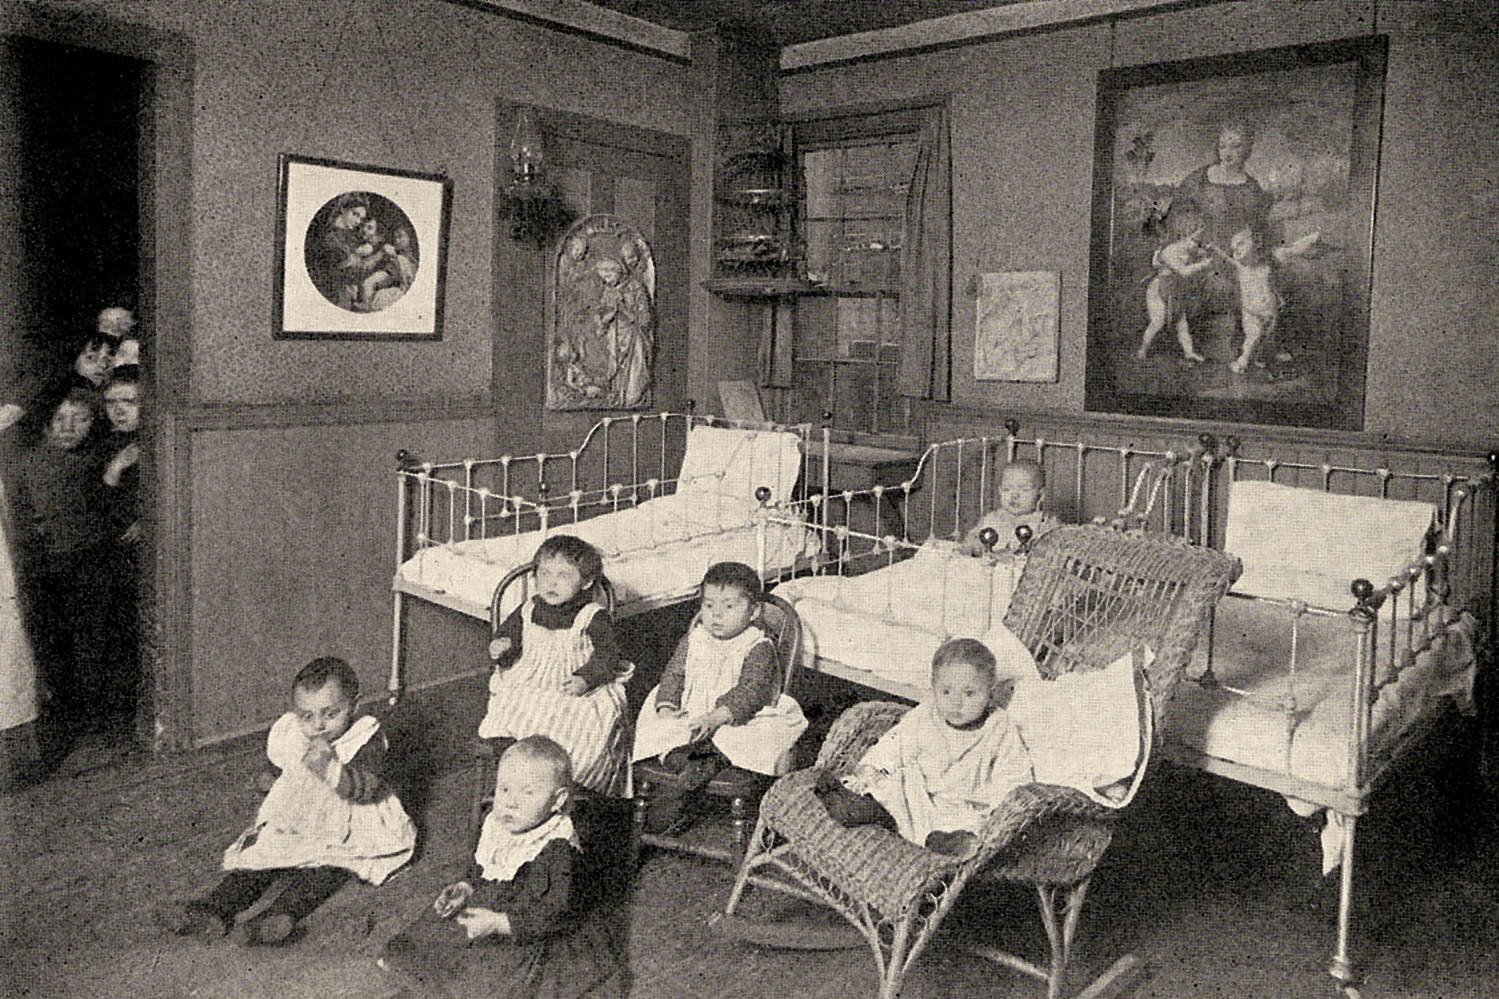
“Hull-House Nursery.” Photograph, 5.25 x 3.75 inches. Swarthmore College Peace Collection. Reproduction 2019.
By providing immigrants with programs, classes, events and
childcare, the Hull House helped to improve social conditions
for underserved people and communities. The Hull House also
established the city's first public playground, bathhouse, and
public gymnasium. Nurseries, such as the one pictured here,
gave mothers the ability to go to work or to attend classes.
Children’s programs, such as cobbling and art (among many
other offerings), provided learning opportunities for recent
immigrants. Yet even while providing services, some urban
reformers held to the belief that immigrants were inherently
childish, dirty, and in need of moral uplift.
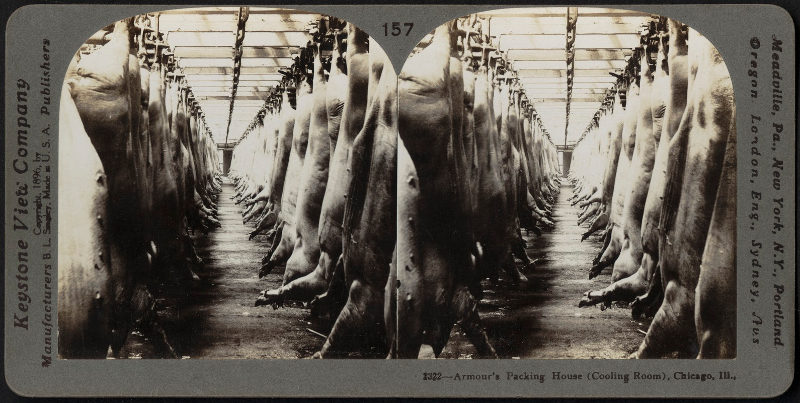
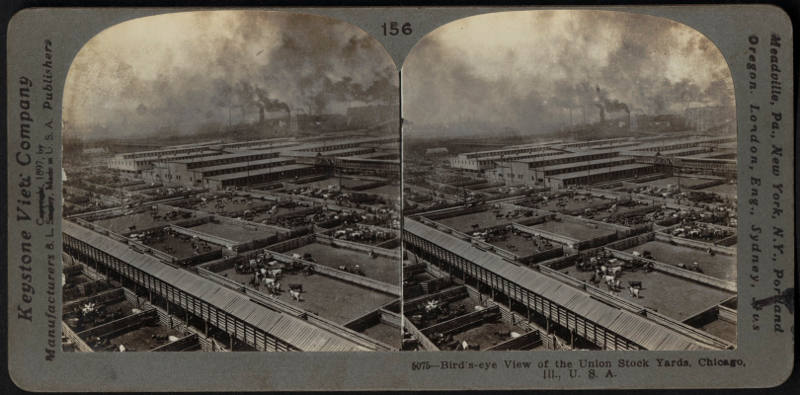
Keystone View Co.
Armour’s Packing House (Cooling Room), Chicago, Ill.
and
Bird’s-Eye View of the Union Stock Yards,
Chicago, Ill., U.S.A.
Meadville, PA, 1896 and 1913. Stereographs, 3.5 x 7
inches. Courtesy of Boston Public Library, Print Department. Reproduction 2019.
At the turn of the century, Chicago became a center of the
meatpacking industry as illustrated by these two stereographs.
One depicts the Union Stock Yards, a large complex of pens and
buildings where cattle were slaughtered and processed. In the
background of the image, smoke rises from Chicago’s numerous
factories. The other provides a glimpse inside Armour’s
Packing House. Rows of hanging pigs represent part of the
meatpacking process, in which workers butchered the meat and
made sausage. Such jobs attracted numerous Americans and new
immigrants to Chicago.
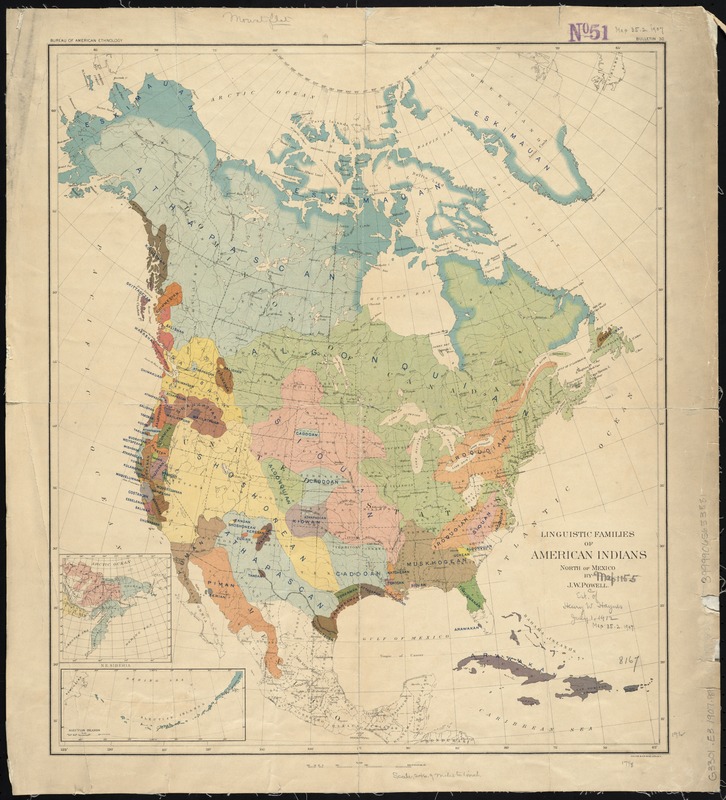
John Wesley Powell (1834-1902)
“Linguistic Families of
American Indians North of Mexico,” from
Handbook of American Indians…
Washington, D.C.,
1907. Printed map, 20 x 17 inches. Leventhal Map and
Education Center.
Originally displayed at Chicago’s 1893 World Fair, this reconstructed map shows the distribution of major Indigenous language families at the time of European contact. Most maps published in the 1890s only depicted Indian reservations, but this map recognized that Native people originally controlled and inhabited all of North America. The map was compiled by John Wesley Powell, who studied the Colorado River, Grand Canyon, and local Native tribes during the 1870s while leading the Interior Department’s Geographical and Geological Survey of the Rocky Mountain Region. Later, Powell became the first director of the Smithsonian Institution’s Bureau of Ethnology, which archived government records relating to Native people and promoted anthropological research.
Viewpoint: The Native American Graves Protection and Repatriation Act legislates the return of Native Ancestors’ remains and cultural items. However, anthropological maps such as this one can create ongoing obstacles. Scholars contend the Tongva (grouped into the outdated Shoshonean language family) moved to Southern California around 4,000 years ago. Some academic and cultural institutions will not return Ancestors to the Tongva that are older than this, stating they belong to tribes that predated the Tongva. Yet our oral traditions say we have always been here. Those are our Ancestors. We want them back.
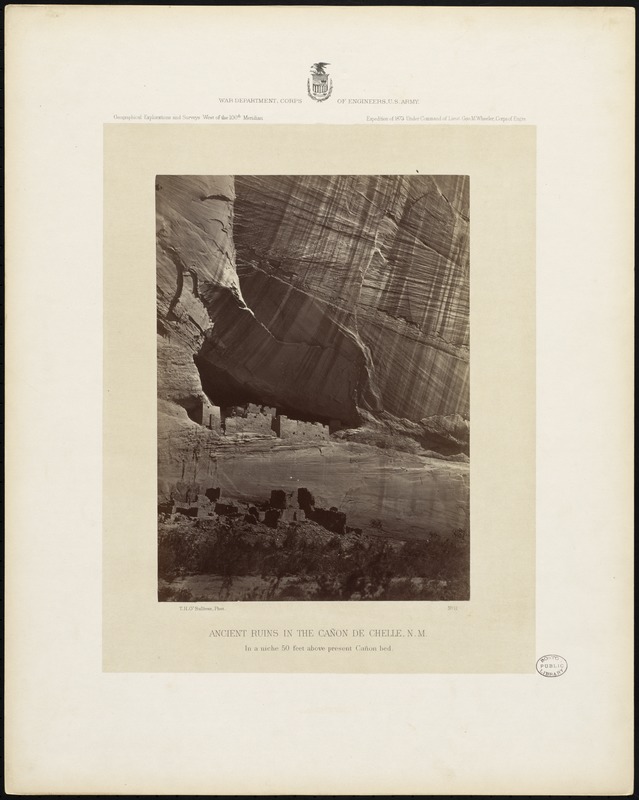
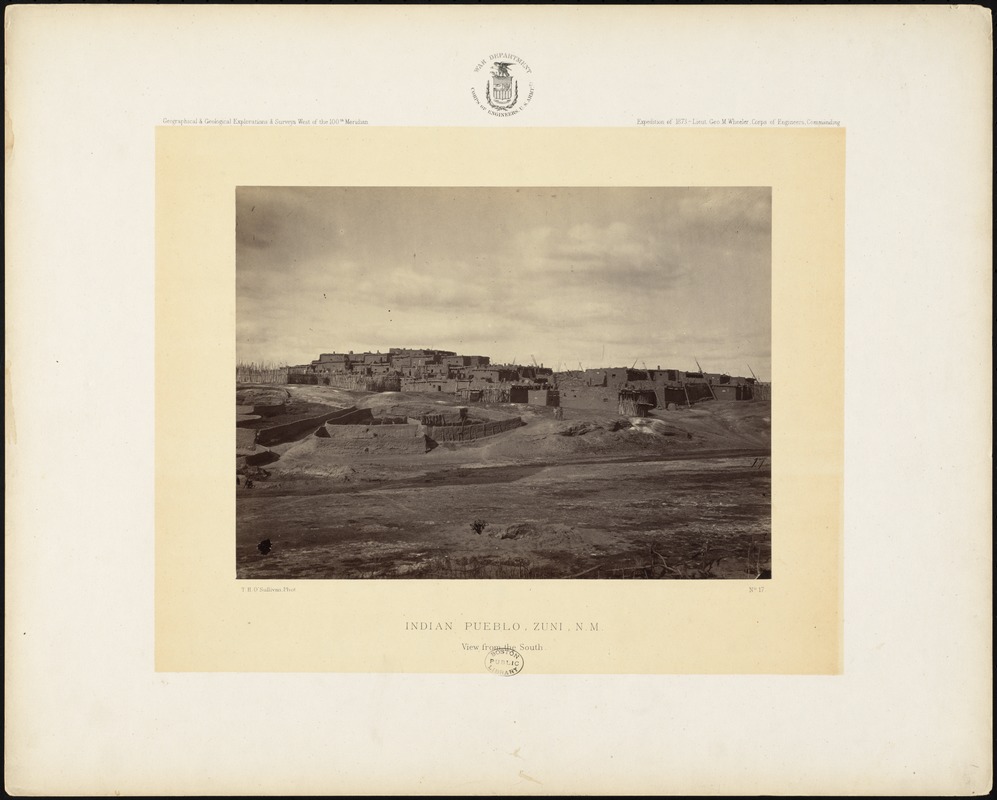
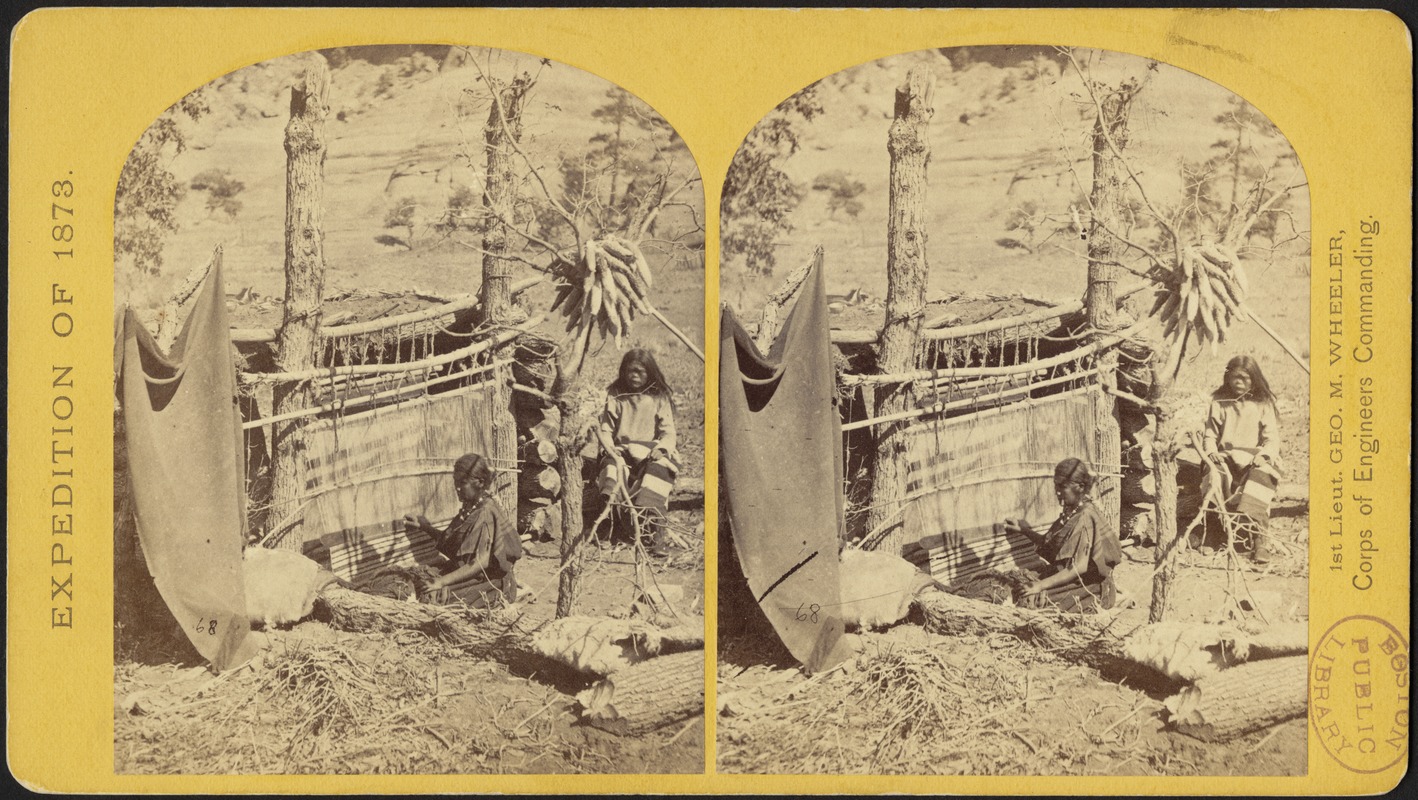
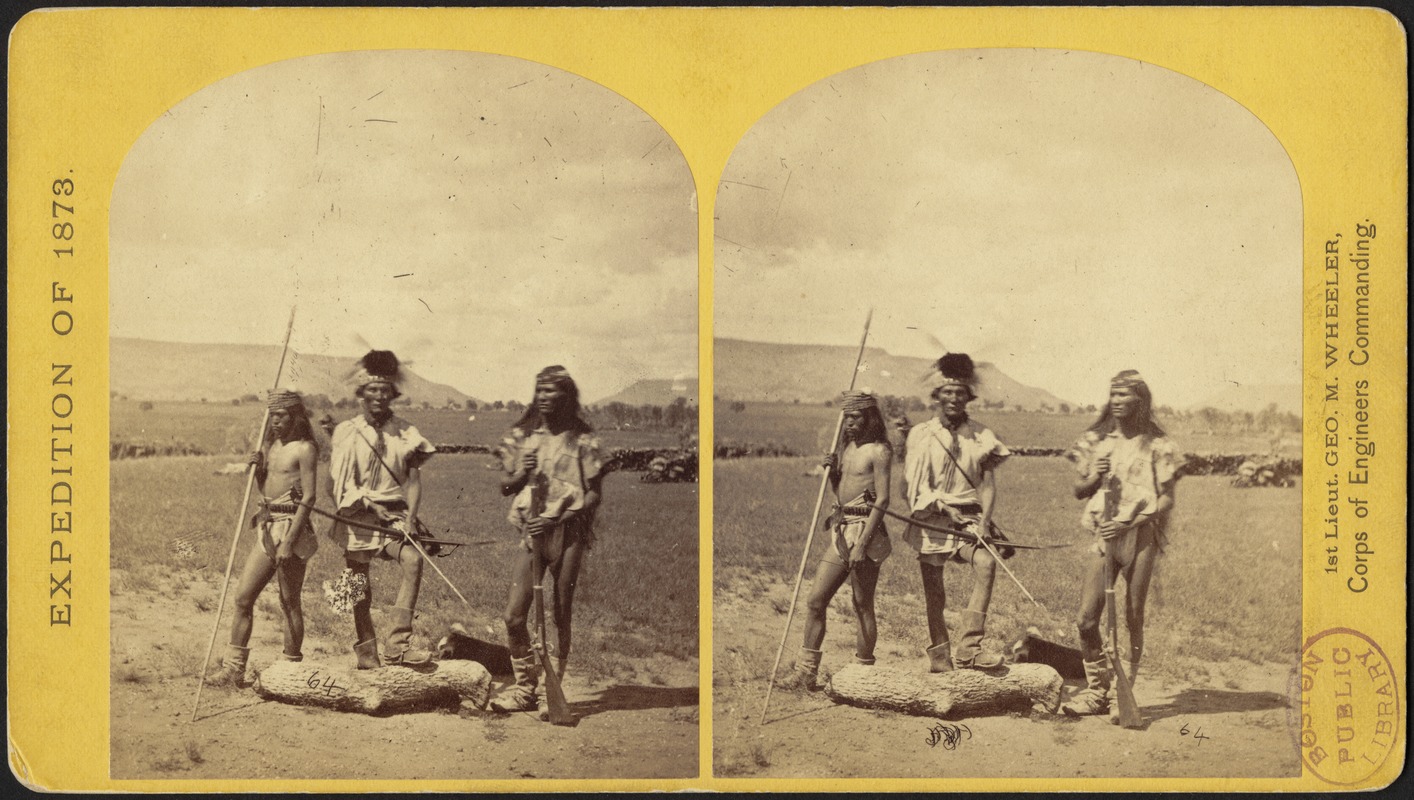
Timothy O’Sullivan (1840-1882)
Ancient Ruins in the Cañon de Chelle, N.M.
Indian
Pueblo, Zuni, N.M., View from the South Side
Aboriginal
Life among Navajo Indians, near Old Fort Defiance, N.M.
Apache
Indians, as They Appear Ready for the War-Path
1871-1876. Photographic prints, 16 x 20 inches, and
stereographs, 3.5 x 7 inches. Courtesy of Boston Public Library, Print Department. Reproductions 2019.
Four western surveys were conducted by the federal government
during the 1870s. These survey parties prepared detailed
topographic maps, inventoried agricultural and mineral
resources, and recorded “vanishing” Indigenous cultures.
Photography, still a relatively new technology, was part of
this documentation. Timothy O’Sullivan, whose work is
displayed here, participated in the War Department’s
Geographical Explorations and Surveys West of the 100th
Meridian, led by Lt. George M. Wheeler. His photographs were
sold commercially as mounted prints and stereographs. Images
of Native people were often posed, and label terminology, such
as “aboriginal life” and “ready for the war path,” catered to
American public stereotypes.
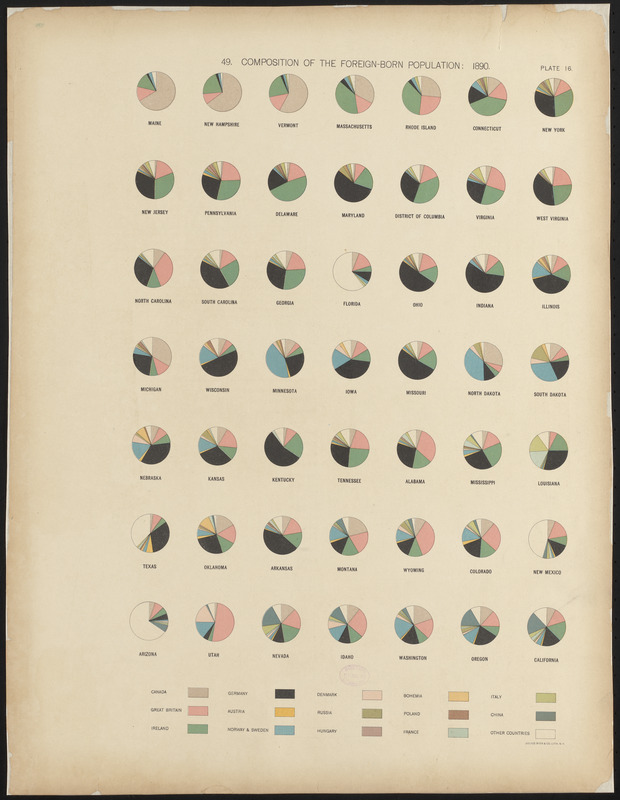
Henry Gannett (1846-1914)
“Composition of the
Foreign-Born Population: 1890,” from
Statistical Atlas of the United States …
Washington, D.C., 1898. Printed map, 21 x 32 inches.
Leventhal Map and Education Center.
According to the 1890 census, almost 15 percent of the
country’s total population consisted of foreign-born
immigrants, and an additional 33 percent were children of
immigrants. These numbers reflect the significance of
immigration to the country’s population growth, especially
during the late 19th century. This colorful graphic,
innovative for its time, consists of pie diagrams for each
state showing the percentage of foreign-born people from
Canada, China, and twelve European countries. Massachusetts’
pie diagram indicates that the largest group came from
Ireland, while Canada held second position. In Illinois,
Germans formed the largest group, while Irish and
Scandinavians composed the second and third largest groups.
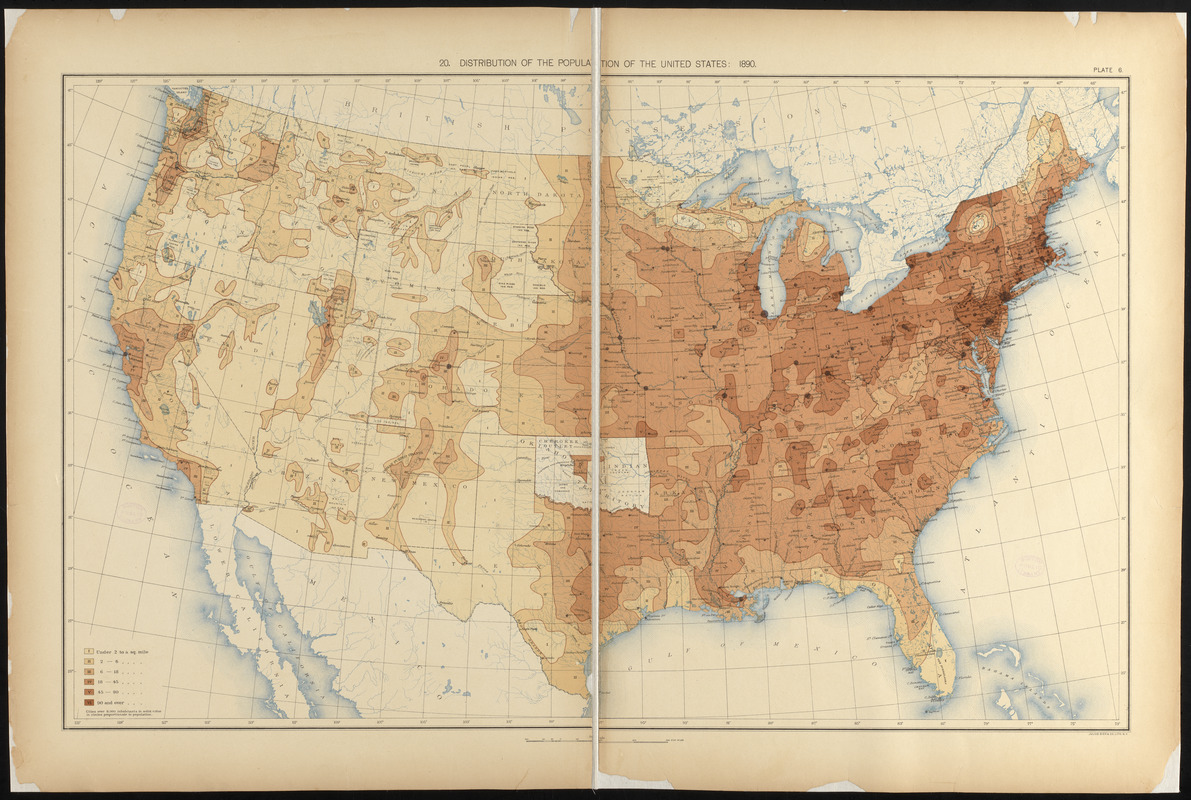
Henry Gannett (1846-1914)
“Distribution of the
Population of the United States: 1890,” from
Statistical Atlas of the United States …
Washington, D.C., 1898. Printed map, 21 x 32 inches.
Leventhal Map and Education Center.
Prepared by the Census Office using 1890 data, this map illustrates the distribution of population across the country. Darker colors represent denser populations. Based on maps like this, historian Frederick Jackson Turner declared that America no longer had a frontier, which he defined as "the meeting point between savagery and civilization.” He believed that the violent conquest of the West shaped “American character,” marked by rugged individualism, inventiveness, and intuitive mastery over the physical landscape. Many agreed with his “frontier thesis” and feared for rising generations who would no longer have the challenge of fighting native people and dominating a wild landscape.
Viewpoint: On the other hand, Native people saw the frontier thesis as a genocidal tactic of forcibly transferring a culture from one state of being to another. Native peoples viewed the frontier as a coming of great change and impending doom. Rather than expansion, the frontier closed in on and choked out Native territories. Cultures that for thousands of years managed and sustained themselves in this “wild landscape” were now forced into American “civilization” and “improvement” as the new American population spread.
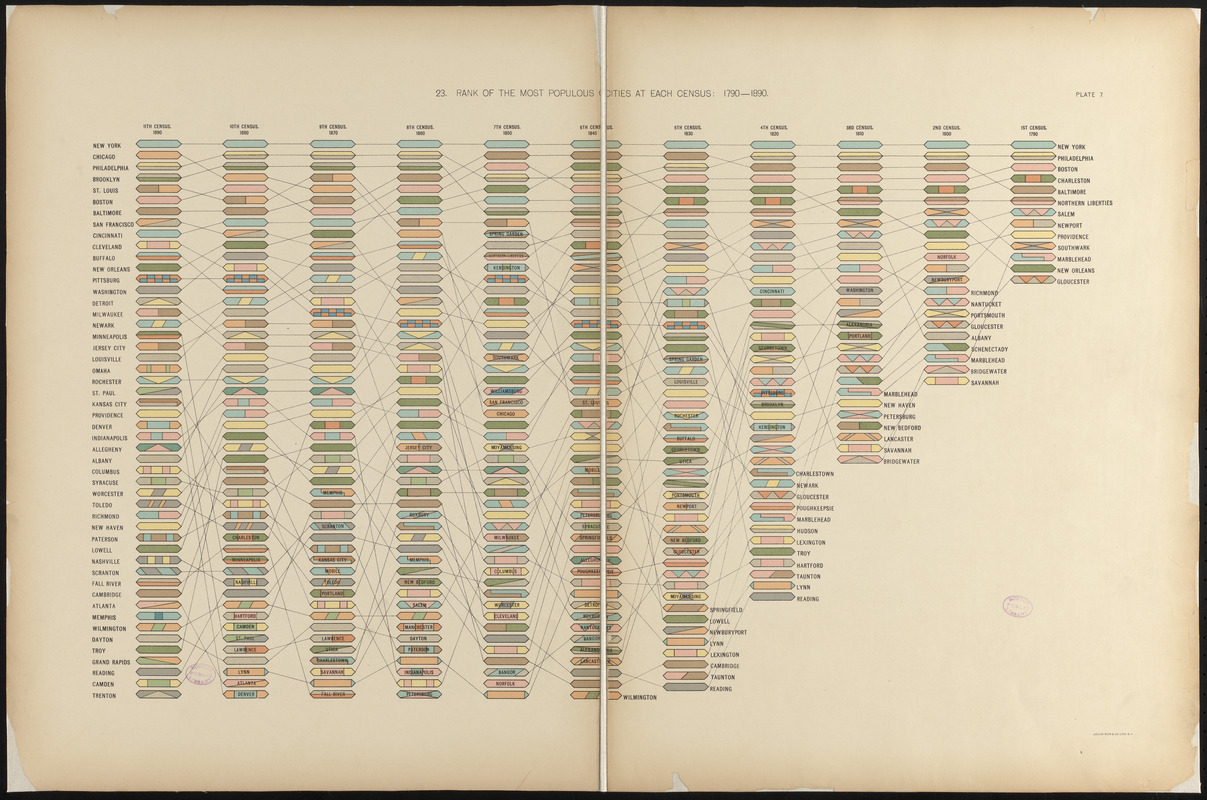
Henry Gannett (1846-1914)
“Rank of the Most Populous
Cities at Each Census: 1790-1890,” from
Statistical Atlas of the United States …
Washington, D.C., 1898. Printed map, 21 x 32 inches.
Leventhal Map and Education Center.
In addition to thematic maps, the statistical atlas included
other graphics illustrating 1890 census data. This chart lists
major cities from the highest to lowest populations, from New
York City to Trenton, New Jersey. Each column to the right
features data from an earlier census. A line traces the rise
and fall of each city’s population over time. For example, New
York City had the highest population since the nation’s first
census in 1790. Chicago, in contrast, was not even considered
a major city until 1850. The midwestern hub grew rapidly to
become the second largest city by 1890.
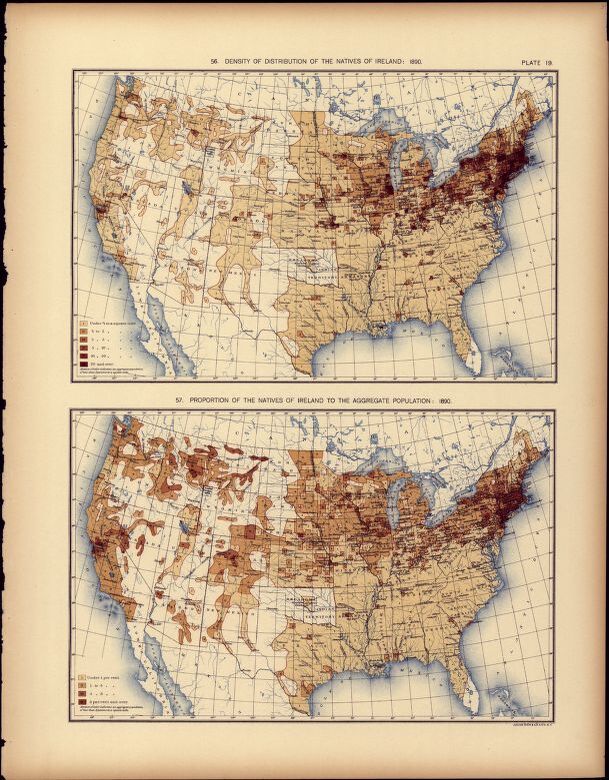
Henry Gannett (1846-1914)
“Density of Distribution of
the Natives of Ireland: 1890; Proportion of the Natives of
Ireland to the Aggregate Population: 1890” from
Statistical Atlas of the United States …
Washington, D.C., 1898. Printed map, 21 x 16 inches.
Courtesy of
Library of Congress Geography and Map Division. Reproduction 2019.
The 1890 statistical atlas also included maps showing the
density of geographic distribution throughout the country for
major immigrant groups. This example shows Irish-born
immigrants, represented in various shades of brown, lived
primarily in New England, the Mid-Atlantic, and the Midwest.
Attracted by jobs constructing canals and railroads and in the
growing industrial sector, many Irish immigrants settled in
urban areas throughout the northeastern portion of the
country. Fears about ethnic purity drove many Anglo Americans
at this time to adopt racist ideas about their own threatened
supremacy.
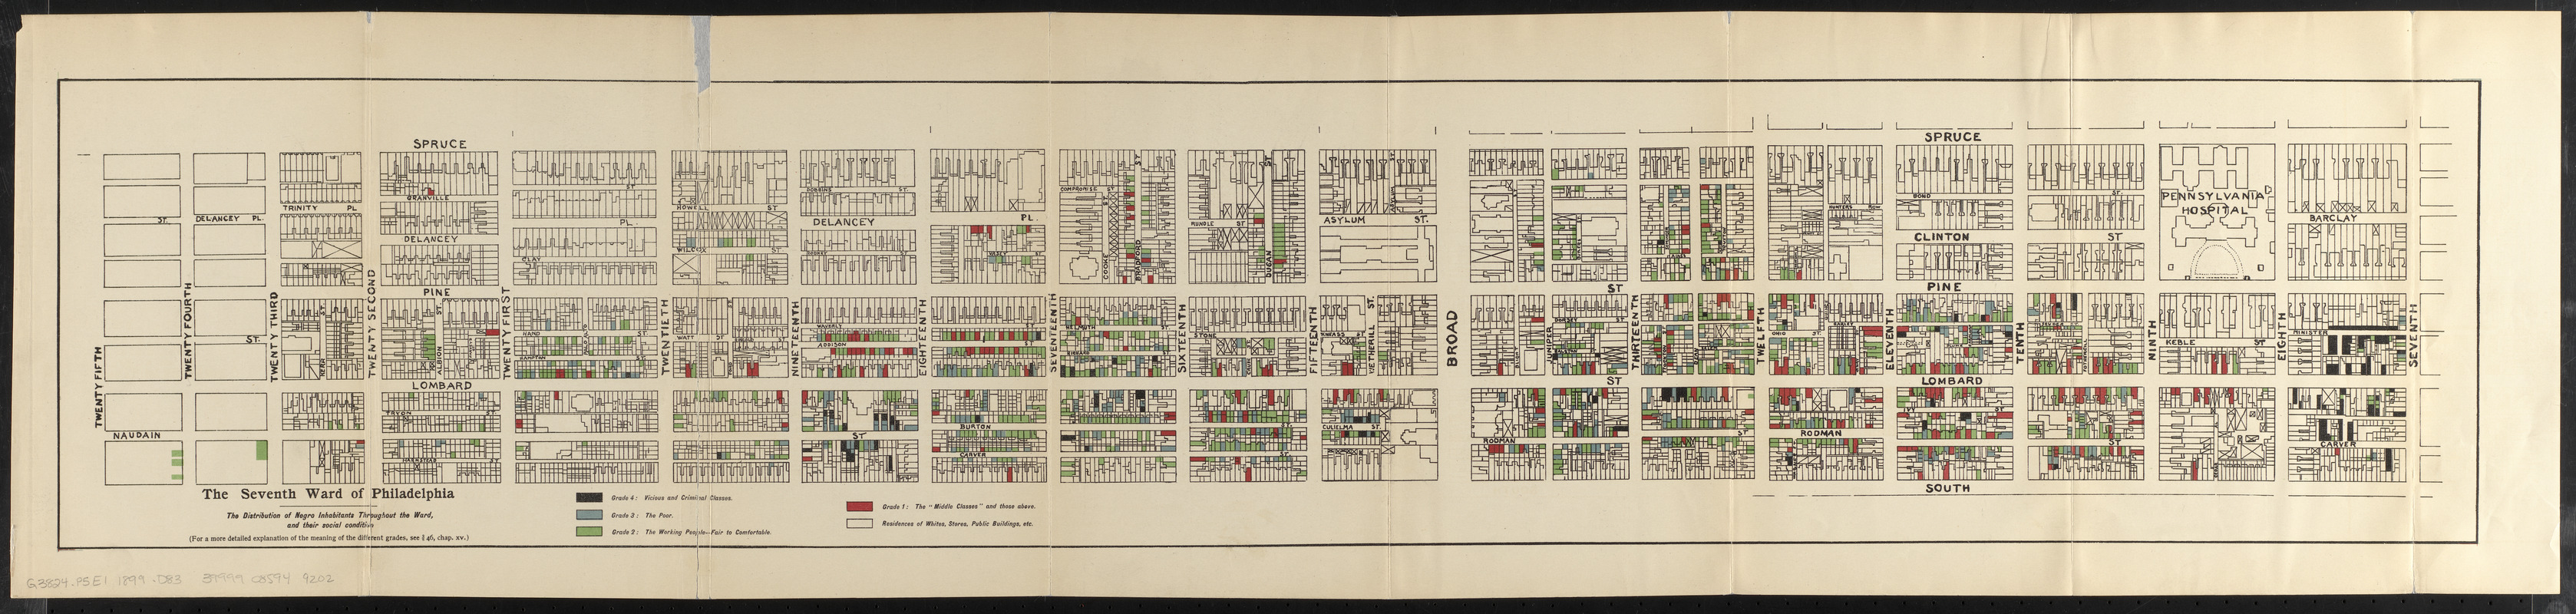
W. E. B. Du Bois (1868-1963)
“The Seventh Ward of
Philadelphia: The Distribution of Negro Inhabitants …” from
The Philadelphia Negro
Philadelphia, 1899.
Printed map, 10 x 42.5 inches. Leventhal Map and Education
Center.
By the end of the century, Philadelphia was home to 40,000 African Americans, comprising the largest population of any northern city. Drawing from the sociological studies by residents of Chicago’s Hull House, African American sociologist W. E. B. Du Bois undertook a similar study in Philadelphia, focusing on Ward 7, the location of the city’s oldest Black neighborhood. In this community with roughly 9,700 residents, Du Bois and his associates conducted approximately 5,000 interviews. Their findings were published as The Philadelphia Negro (1899), which included this fold-out map with the location of every residence, church, and business owned by Black people.
Viewpoint: The disappearance of historic Black neighborhoods continues. At the end of the 19th century, Philadelphia’s Seventh Ward was the heart of Black Philadelphia. Today, it is a trendy middle-class and white neighborhood. For those that walk these streets, several historic markers and a mural remind us of the Black life once etched into this landscape. Du Bois’ maps disrupt the notion of Blacks as a monolithic group by visualizing a far more compelling story of class diversity. This was the place physician Dr. Nathan Mossell, business owner Robert Mara Adger, educators Octavius Catto and Fanny Jackson Coppin, activist Frances Allen Watkins, faith leader Rev. Henry Phillips, junk dealer Arthur McKenzie, waiter Oscar Stewart, dress-maker Bessie Corney, and about 40,000 other Blacks lived and/or worked alongside immigrants and whites. Mother Bethel African Methodist Episcopal Church still stands on the edge of this neighborhood. It remains the longest held Black property in the United States while also preserving Black religion, culture, and history.
–
Dr. Stephanie Clintonia Boddie, Baylor University, Diana R.
Garland School of Social Work, George W. Truett Theological
Seminary and School of Education.
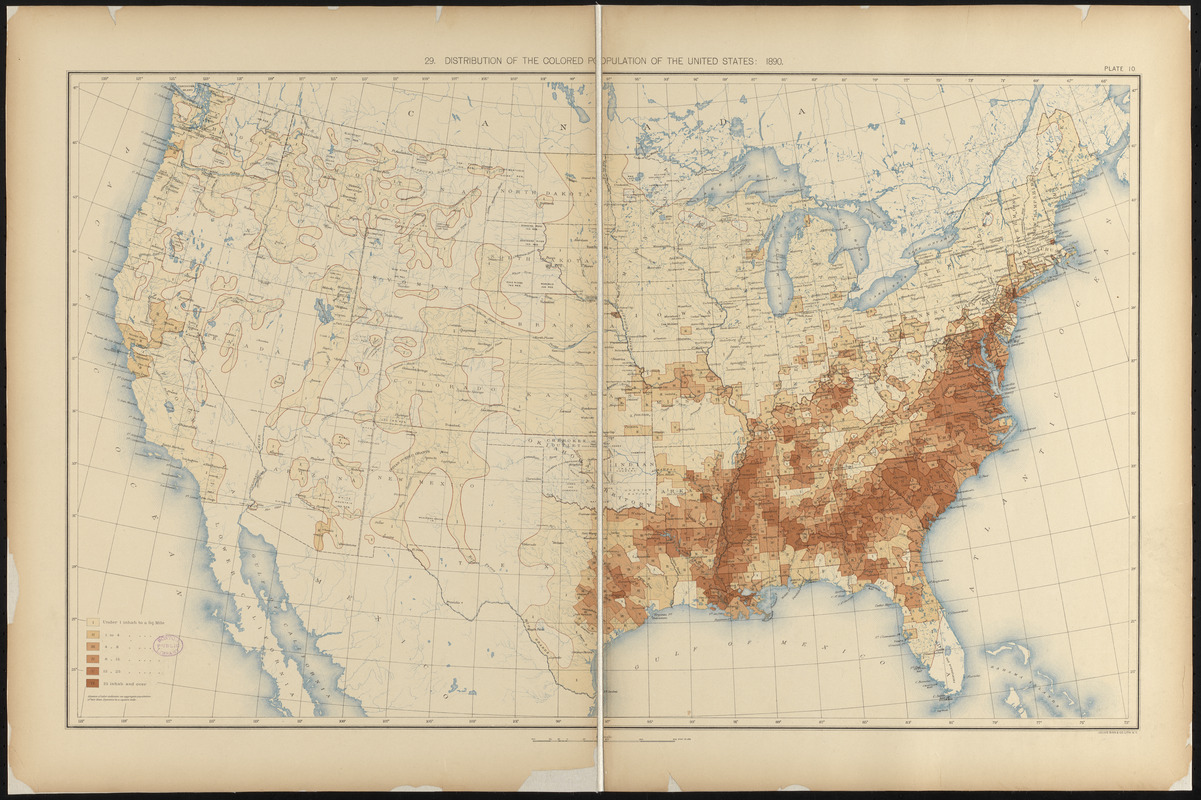
Henry Gannett (1846-1914)
“Distribution of the
Colored Population of the United States: 1890,” from
Statistical Atlas of the United States …
Washington, D.C., 1898. Printed map, 21 x 32 inches.
Leventhal Map and Education Center.
The African American population grew from 4.4 million at the
beginning of the Civil War to 7.5 million in 1890,
representing 12 percent of the country’s total population.
This map from the statistical atlas using 1890 census data
employs six shades of brown to indicate population
distribution and density. Most African Americans remained in
the Southeast, but many moved to Midwestern and Northeastern
states. They established communities in urban areas like St.
Louis, Indianapolis, Cincinnati, Philadelphia, New York and
Boston.
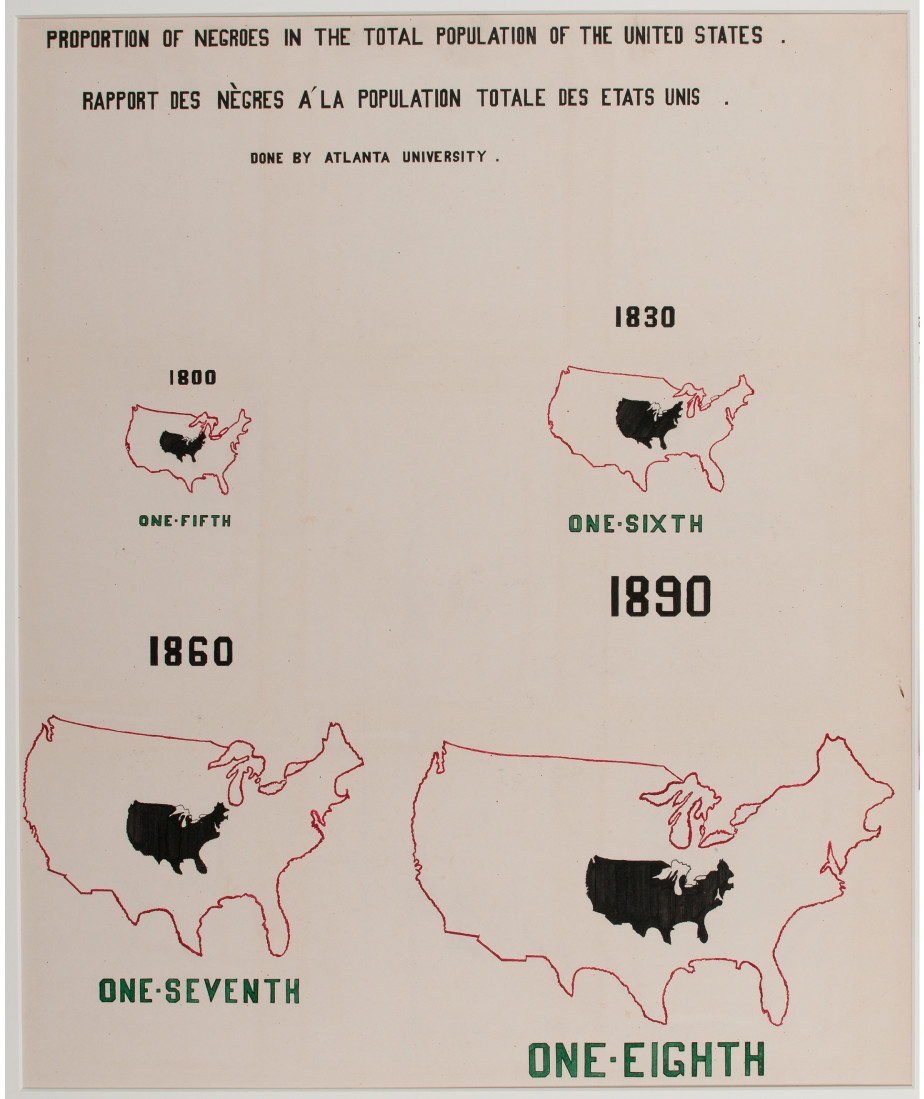
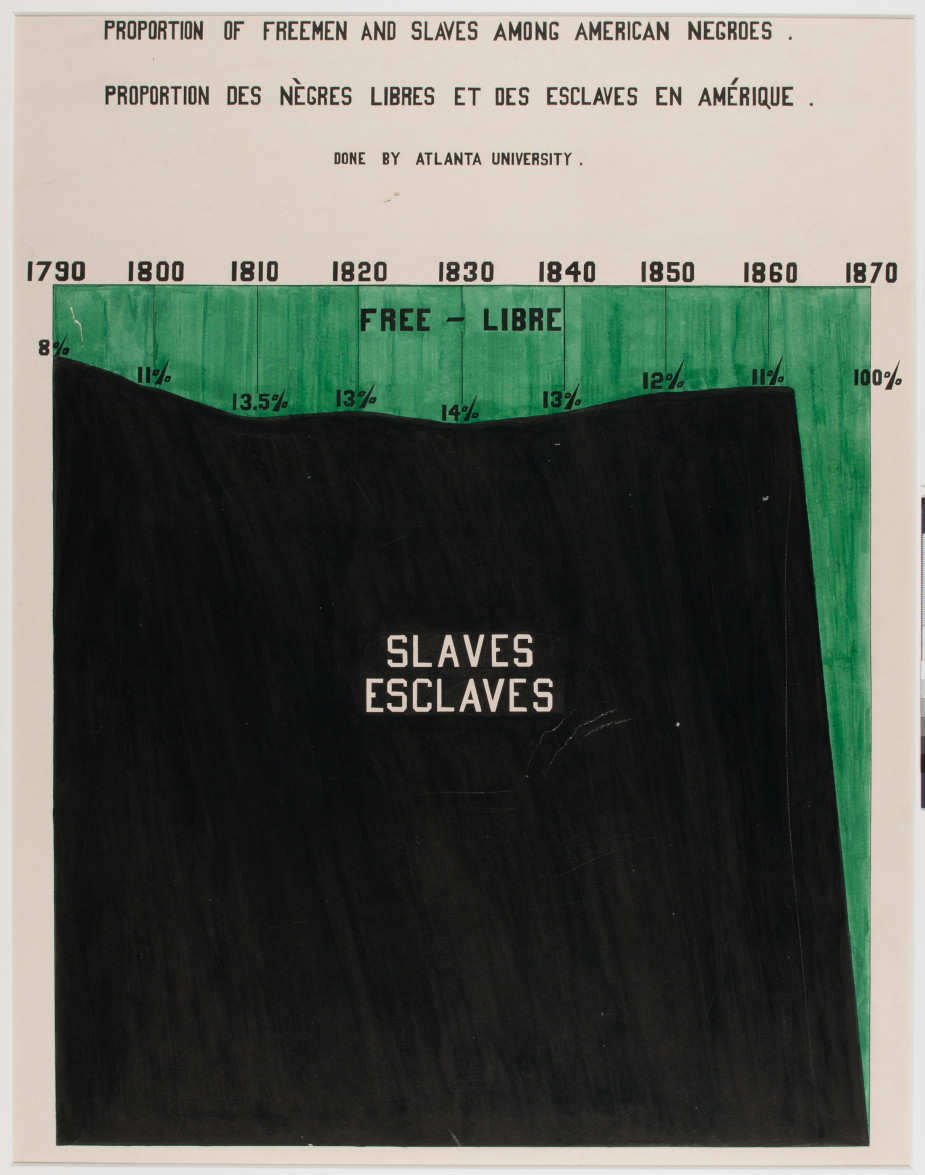
Atlanta University and W. E. B. Du Bois (1868-1963)
“Proportion of Freemen and Slaves among American
Negroes,” and “Proportion of Negroes in the Total Population
of the United States,” from [A Series of Statistical Charts Illustrating the Condition
of the Descendants of former African Slaves Now in
Residence in the United States].
Ca. 1900. Ink and watercolor drawings, 28 x 22
inches. Courtesy of the
Library of Congress Prints and Photographs Division. Reproduction 2019.
For display at the Paris World’s Fair in 1900, renowned sociologist W. E. B. Du Bois, in collaboration with students and alumni of Atlanta University in Georgia, created a series of infographics illustrating the post-Emancipation progress of African Americans in the United States. These were presented with an exhibition of photographs and written profiles of African Americans from all walks of life. At the bottom of one infographic, a map of the transatlantic slave trade, Du Bois wrote what became a famous rallying point for anti-racists in the years to come: “the problem of the 20th century is the problem of the color-line.”
5. Our Legacy
Connected Histories
The history of the United States has often been presented as a heroic frontier, with only a few actors: men conquering mountains, exploring the wilderness, expanding the boundaries of a new nation. Left out of this account are the histories of the people indigenous to this land, the enslaved that were transported here against their will, and immigrants relegated to life as second-class citizens. When communities reclaim the power to tell their own stories, and put themselves and their forebears back into a historical record from which they had been previously erased, they not only gain a voice for themselves but also help all of us to understand the past in more inclusive terms.

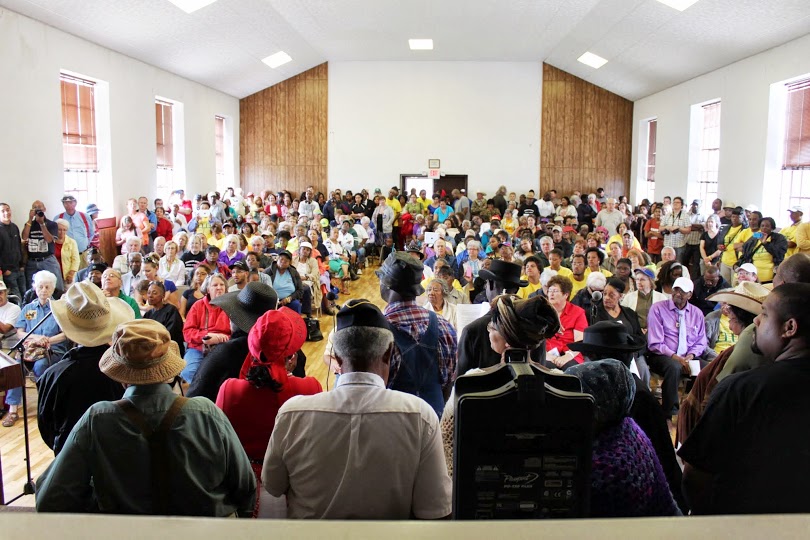
Celebrators at Nicodemus Homecoming Celebration 2018.
Courtesy
Jim Logback/The Hill City Times
Reenactment in Nicodemus Visitor Center
Photo courtesy
Nicodemus Historical Society
When the community of Nicodemus, a town settled by emancipated slaves, celebrates its founding every year, it promotes and celebrates the story of African American independence and uplift. An inclusive history of the United States must encompass all the people that have inhabited this land.
How can we make sure everyone's story is heard?
A More Perfect Union
American history in the 19th century contains many stories of hardship and resilience. We must confront tragedy, loss, oppression, and exclusion if we are to fully understand how we arrived at the present day. Rather than feeling overwhelmed by these injustices, however, it is important to consider the actions that we can take in order to grapple with this sometimes bitter legacy. Today, the descendants of Native people and formerly enslaved African Americans, among others, are leading efforts to right the wrongs of the past.

Actor and civil rights activist Danny Glover appears before
a congressional hearing to testify in favor of studying
reparations for slavery. (photo courtesy Caroline Brehman/CQ
Roll Call)
In 2019 Congress held hearings on reparations for
slavery. Some believe that the nation should compensate
descendants of slaves for hundreds of years of compulsory and
unpaid labor. During the hearing, filmmaker Katrina Browne,
who discovered that her family owned many slaves, stated that
“it is good for the soul of a person, a people, and of a
nation to set things right.”
What I’m arguing for with reparations is really about not just the financial redress, but how do we deal with the longterm political aftermath of racism in our society? How do we educate the public about the centrality of slavery and the racism that made it possible?
Kimberly Teehee, Senior Policy Advisor for Native American Affairs, speaks with President Barack Obama in the Oval Office in April, 2012. (Official White House Photo by Pete Souza)
Also in 2019, the Cherokee Nation elected Kimberly Teehee to the U.S. House of Representatives, fulfilling a provision of an 1835 treaty which stated that the Cherokee “shall be entitled to a delegate in the House of Representatives ... whenever Congress shall make provision for the same.” If approved by Congress, she will become a non-voting member, similar to the representatives of other territories.
Over 184 years ago, our ancestors bargained for a guarantee that we would always have a voice in the Congress ... It is time for the United States to uphold its end of the bargain
As a nation, how should we address the injustices of the past?
Land and Communities
Since Euro-Americans settled in what is now the United States, the land has been dramatically altered. Valuable minerals and fossil fuels have been extracted, waterways dammed, and large-scale agriculture enterprises have created jobs for many and great wealth for a select few. These activities have not only caused ecological destruction, but have also deprived Native peoples of their traditional means of supporting themselves. Confronting environmental challenges in the present, therefore, must also involve a commitment to justice for those who have suffered disproportionately from the environmental damages of the past.
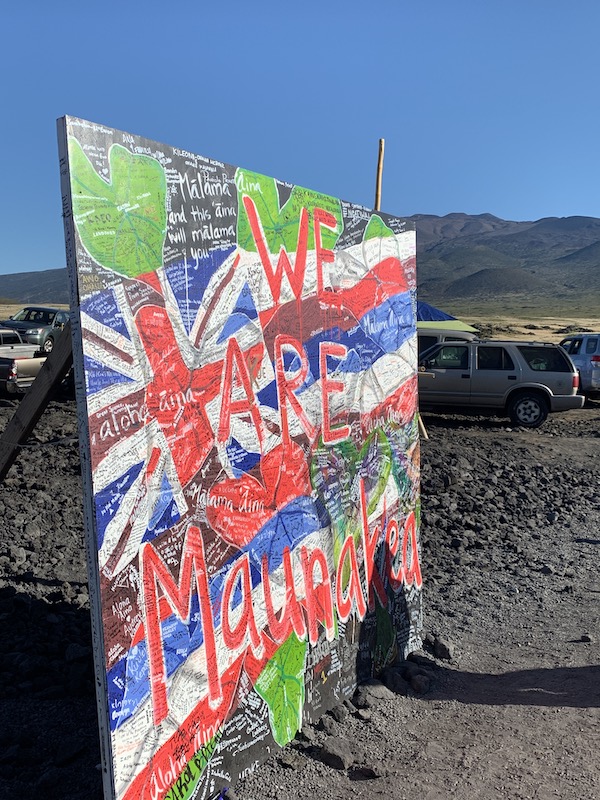
Photo courtesy Angela Dion
Native nations continue to serve as land and water protectors, now joined by new allies and organizations. In the last few years we have witnessed activism directed against the Dakota Access Pipeline, a Rights of Nature statute passed by the Ponca Nation in Oklahoma to oppose fracking and reaffirm their relationship with the land, and opposition to the Thirty Meter Telescope on the sacred mountain of Mauna Kea in Hawaii.

Photo courtesy Anqi Zhang
Climate and land activism continues to build new coalitions. In the fall of 2019 a series of international strikes and protests were led by young people and adults to demand action be taken to address climate change, even as some states have attempted to prohibit the rights of people to demonstrate. The protection of the land is a burden all must share.

Photo courtesy Pax Ahimsa Gethen
Indigenous communities around the world are among those being most quickly and severely affected by climate change. … Our tribe is actively working to move away from fossil fuels and we continue to battle those who disregard our efforts to protect our water and lands.
-Standing Rock Chairman David Archambault
What is our responsibility for protecting the land for future generations?
Gallery Photos
Part 2
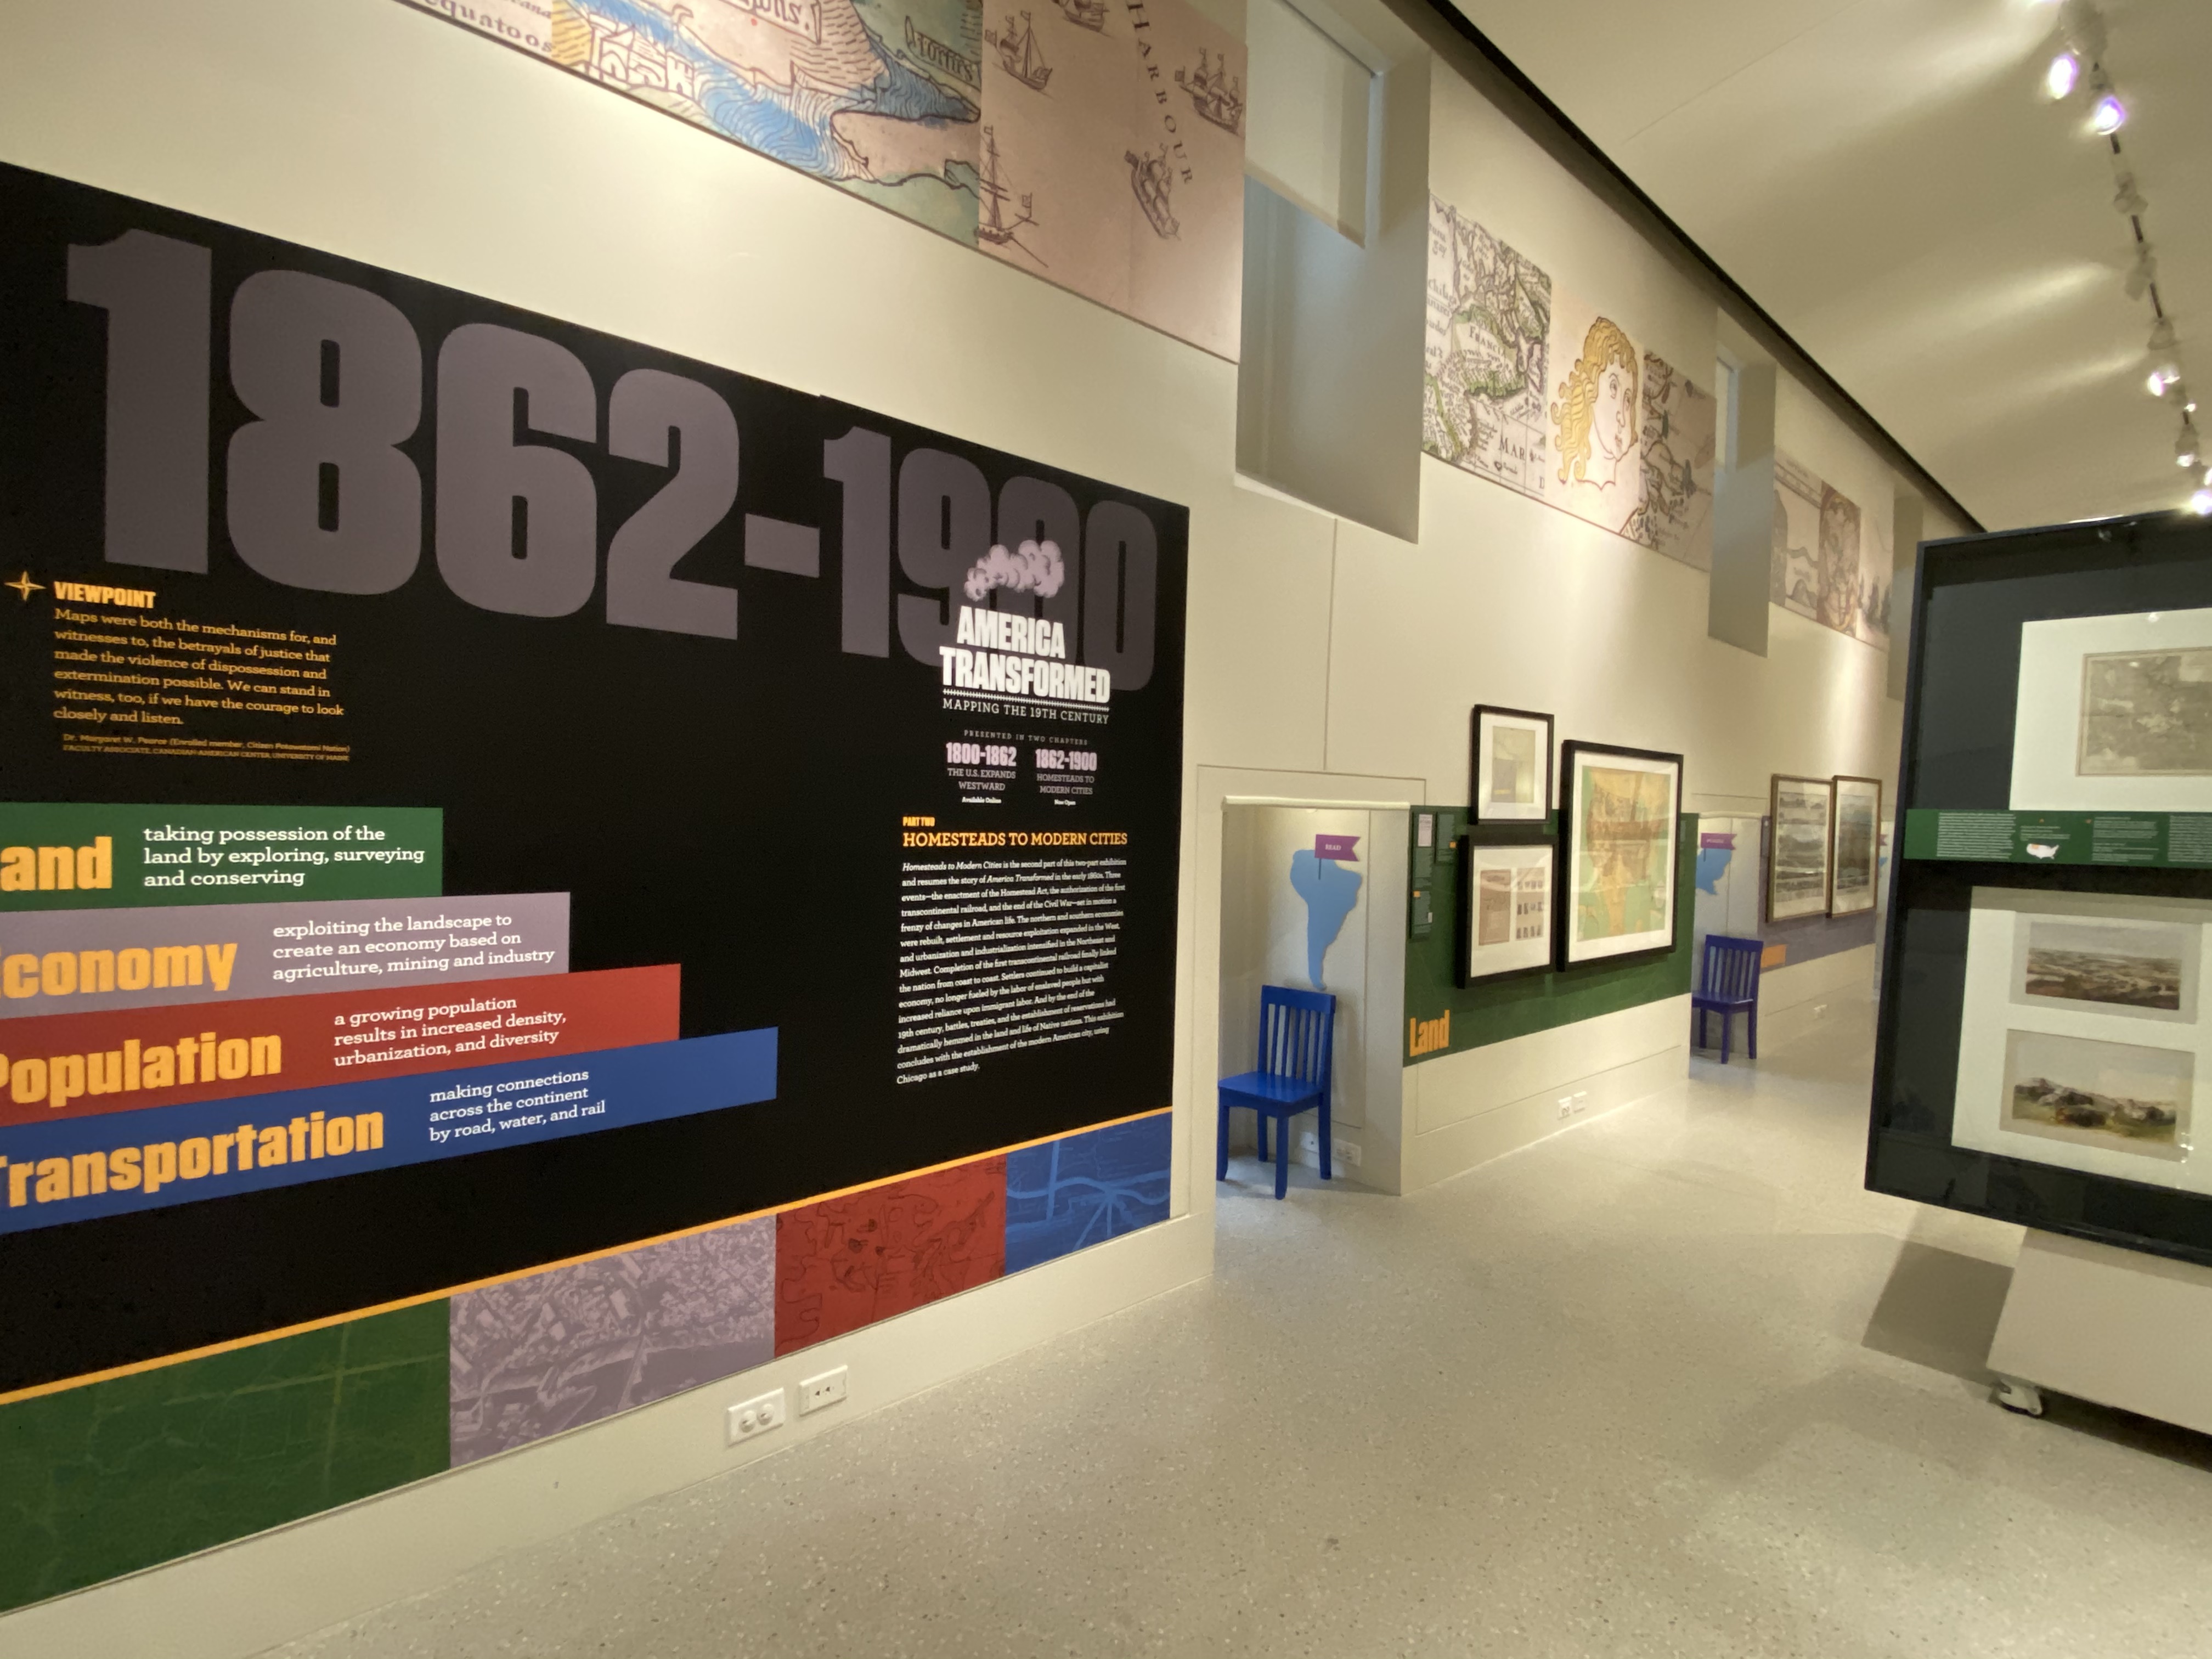
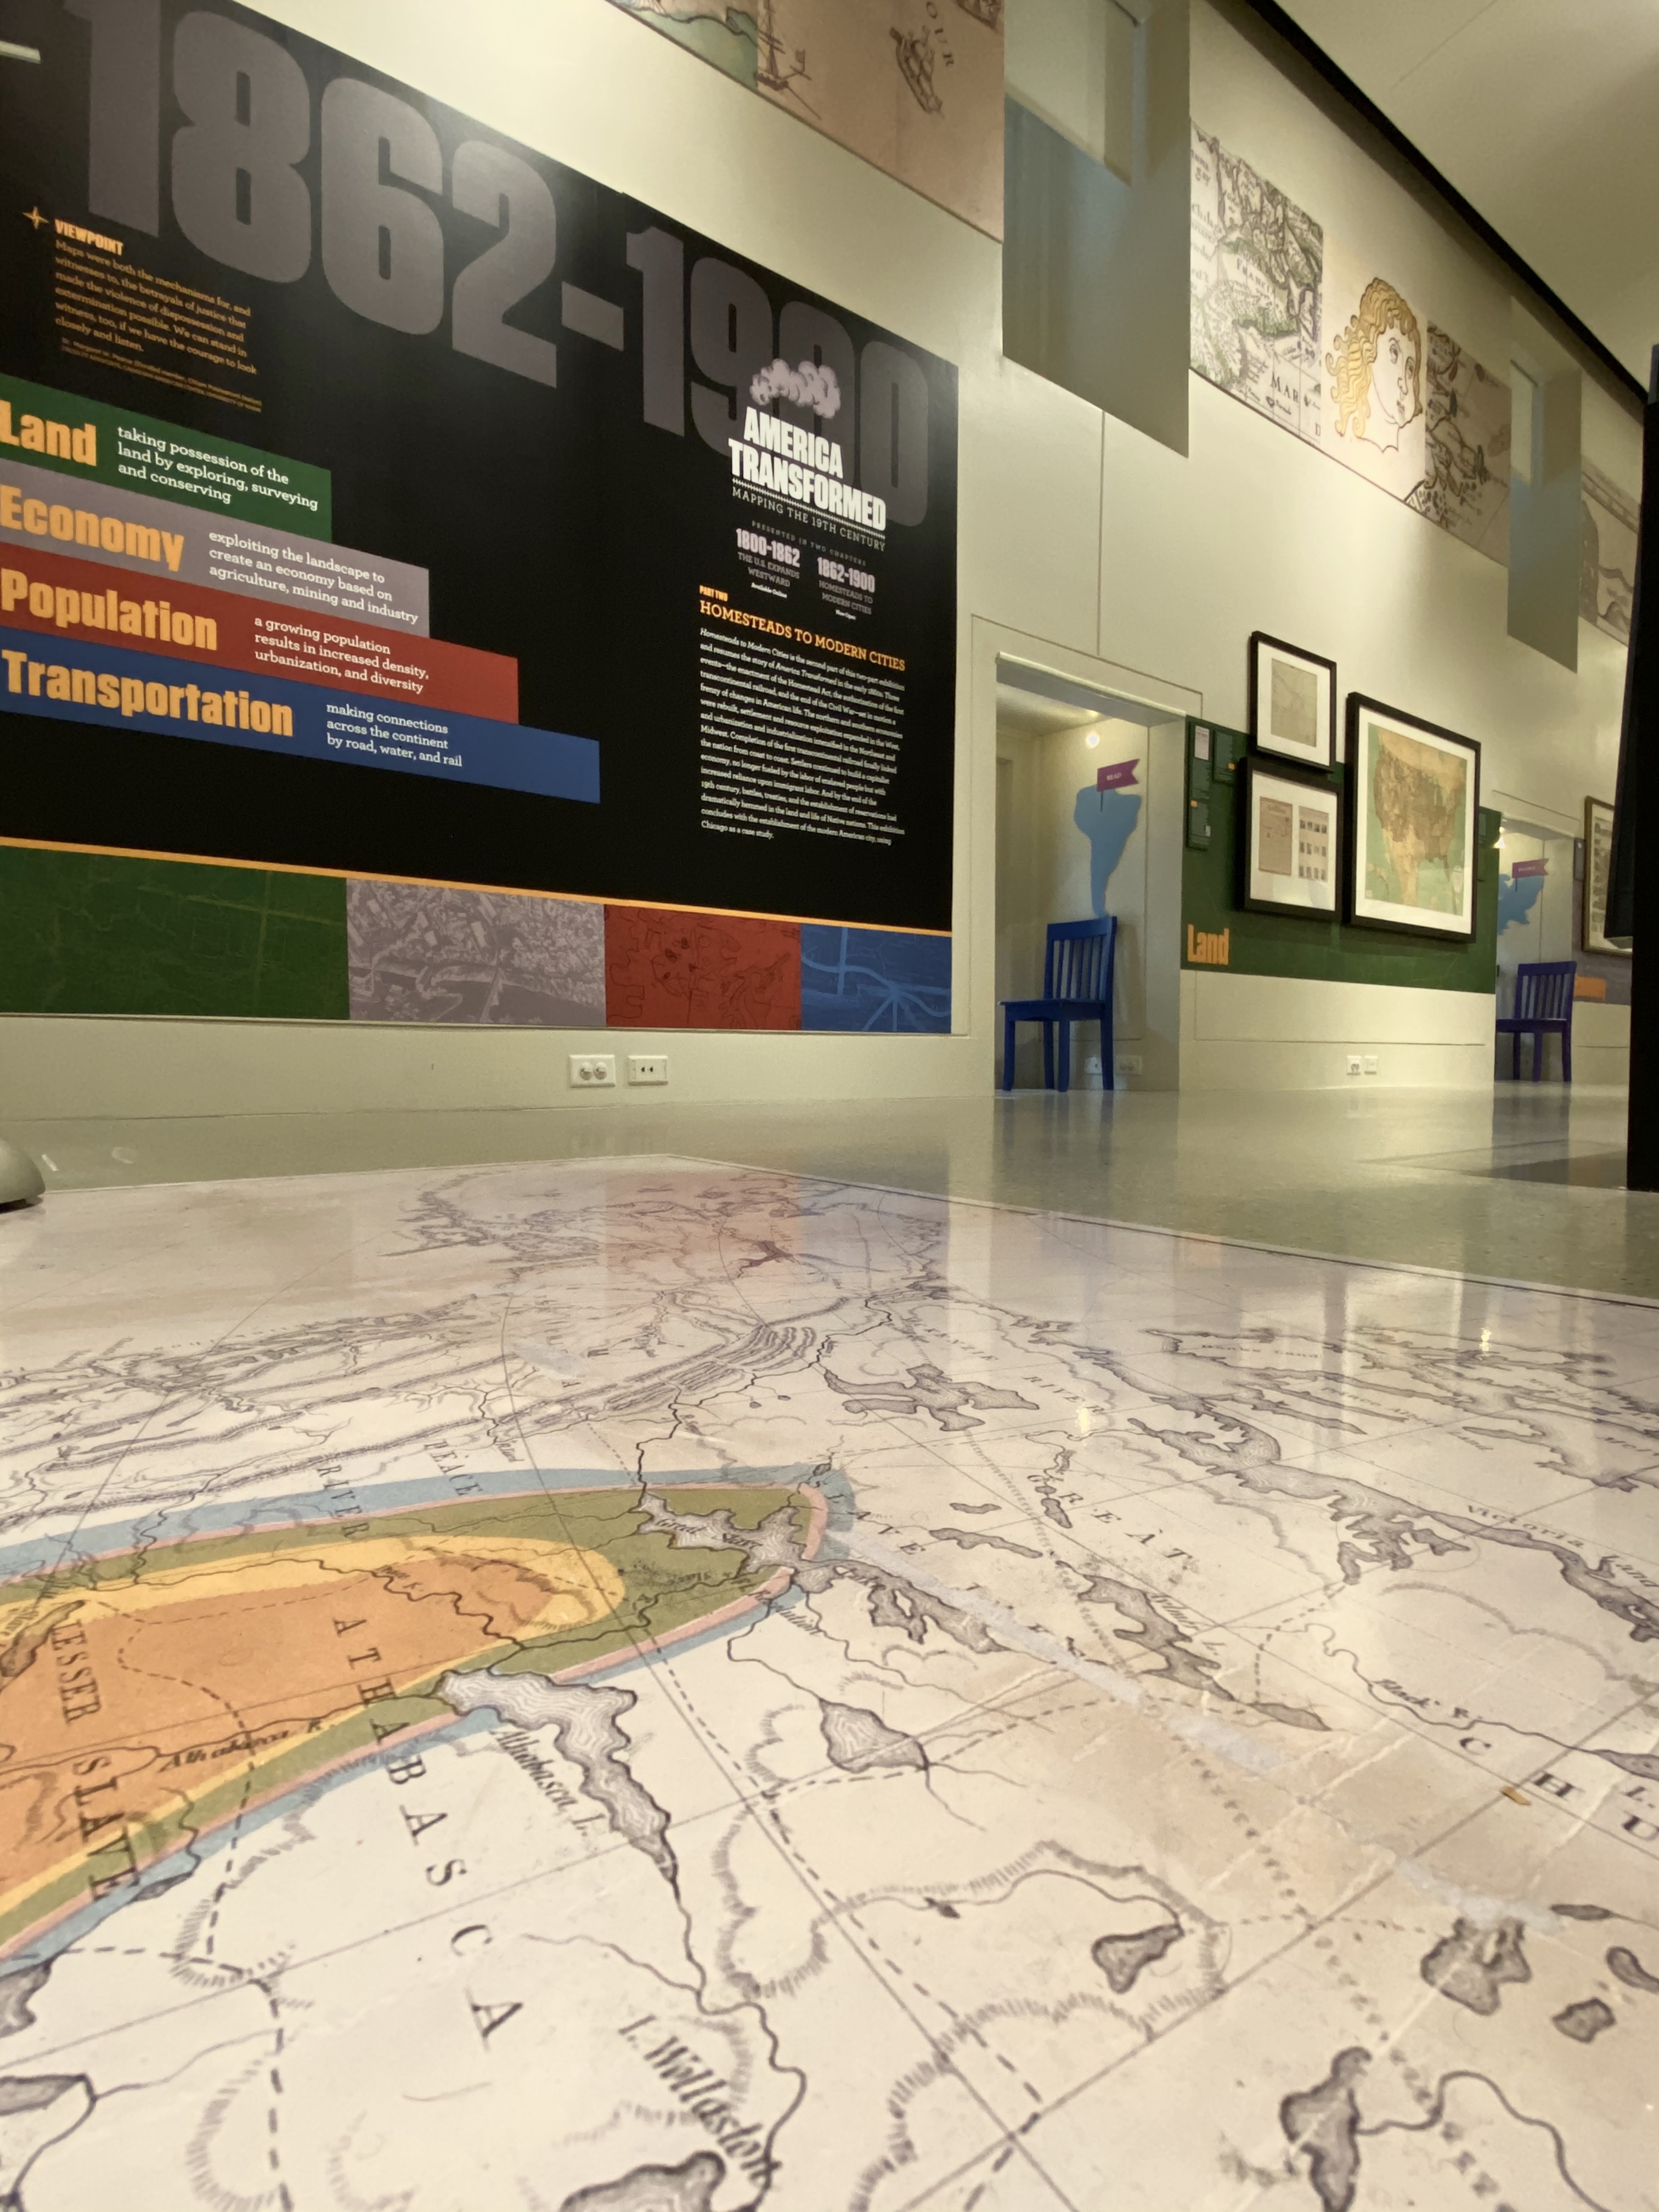
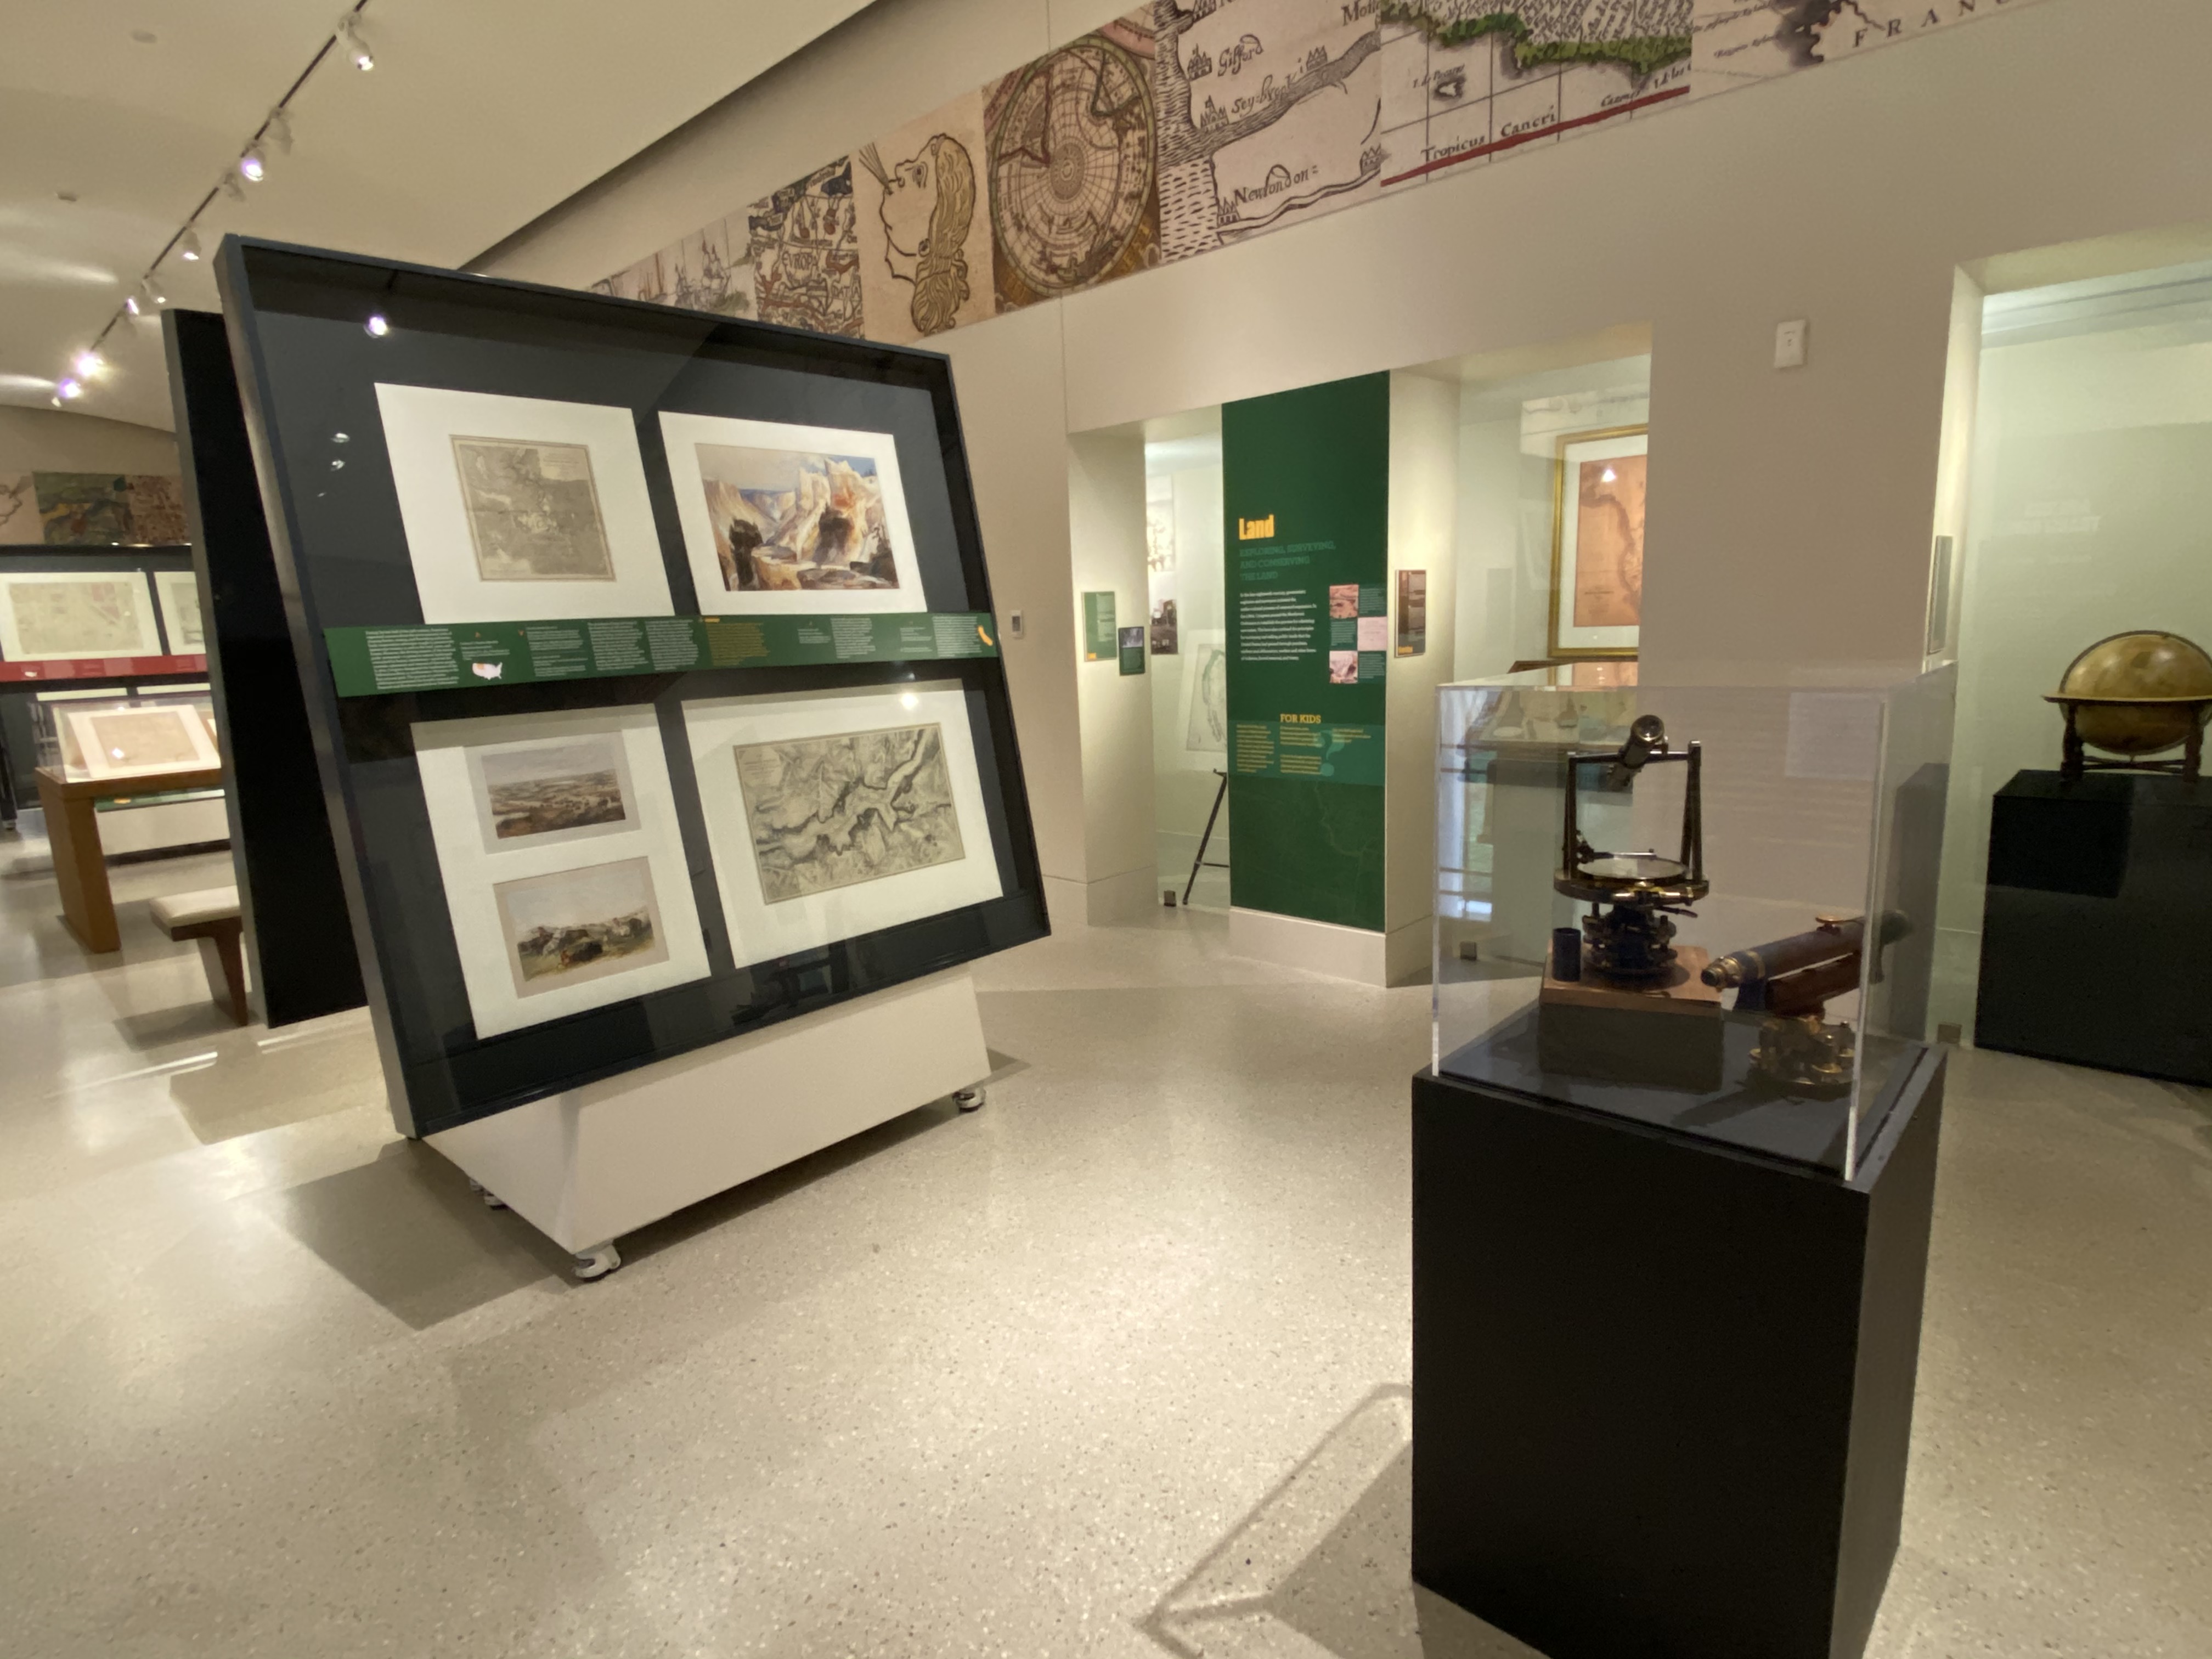
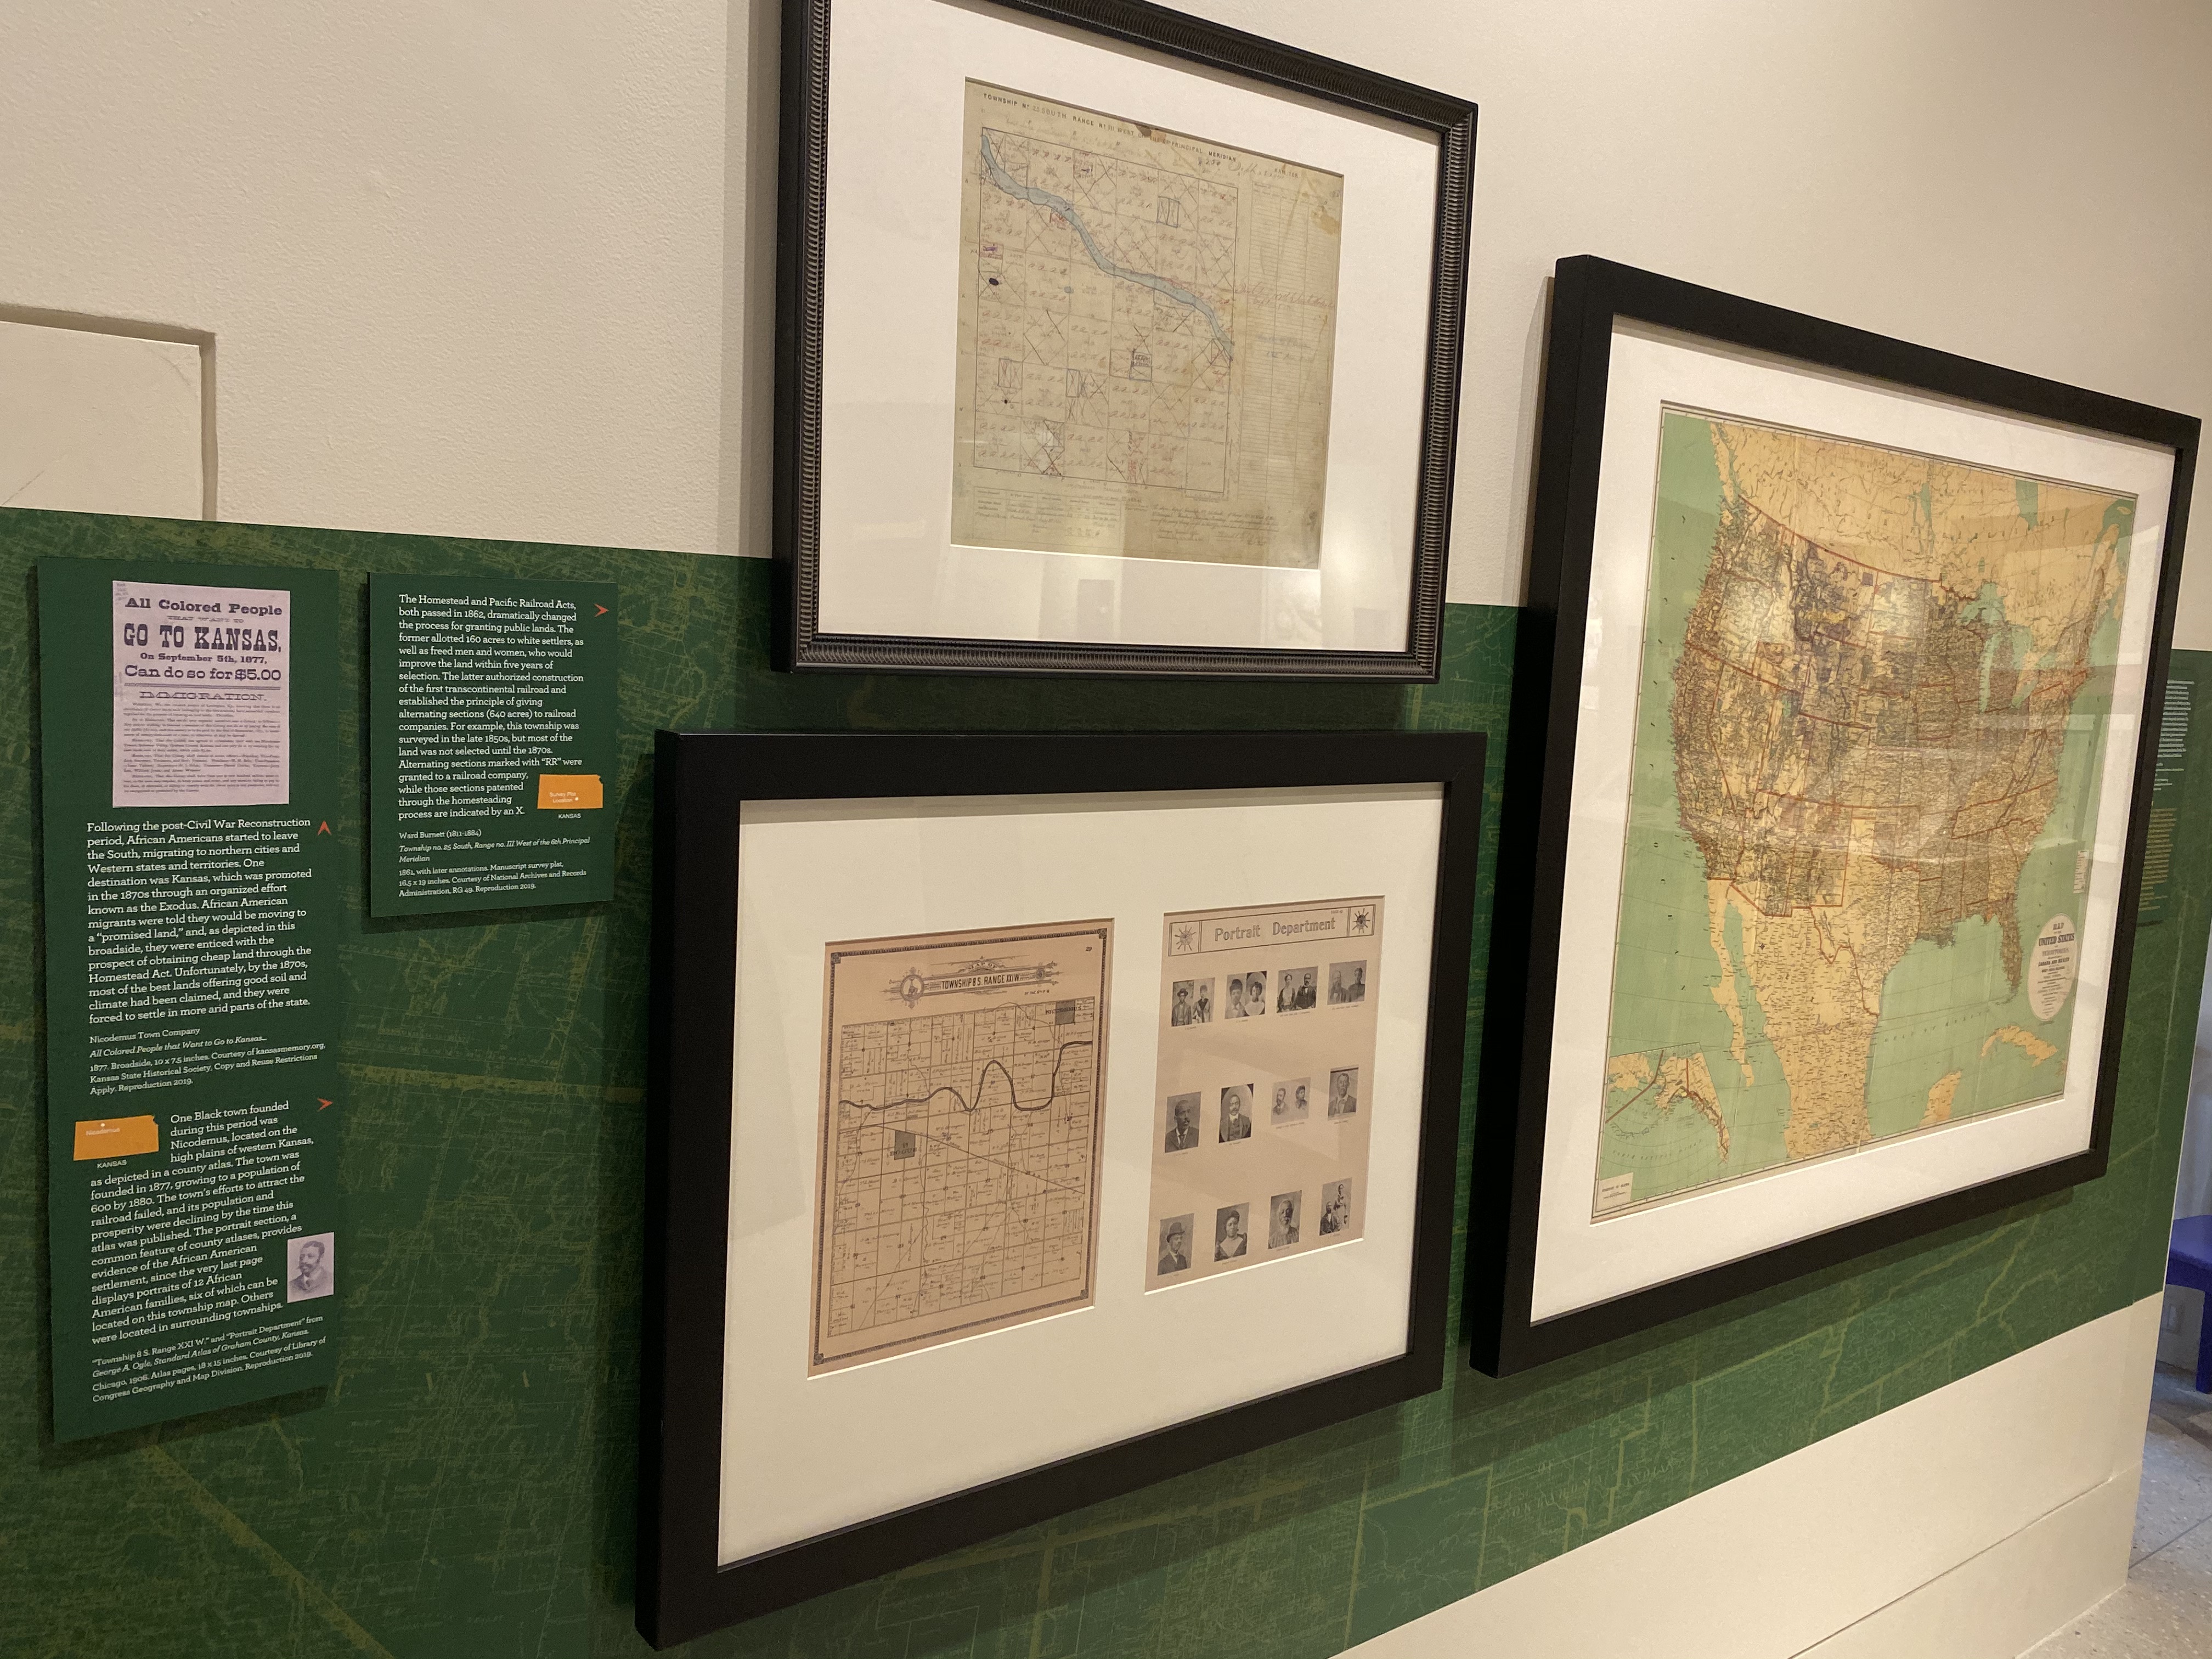
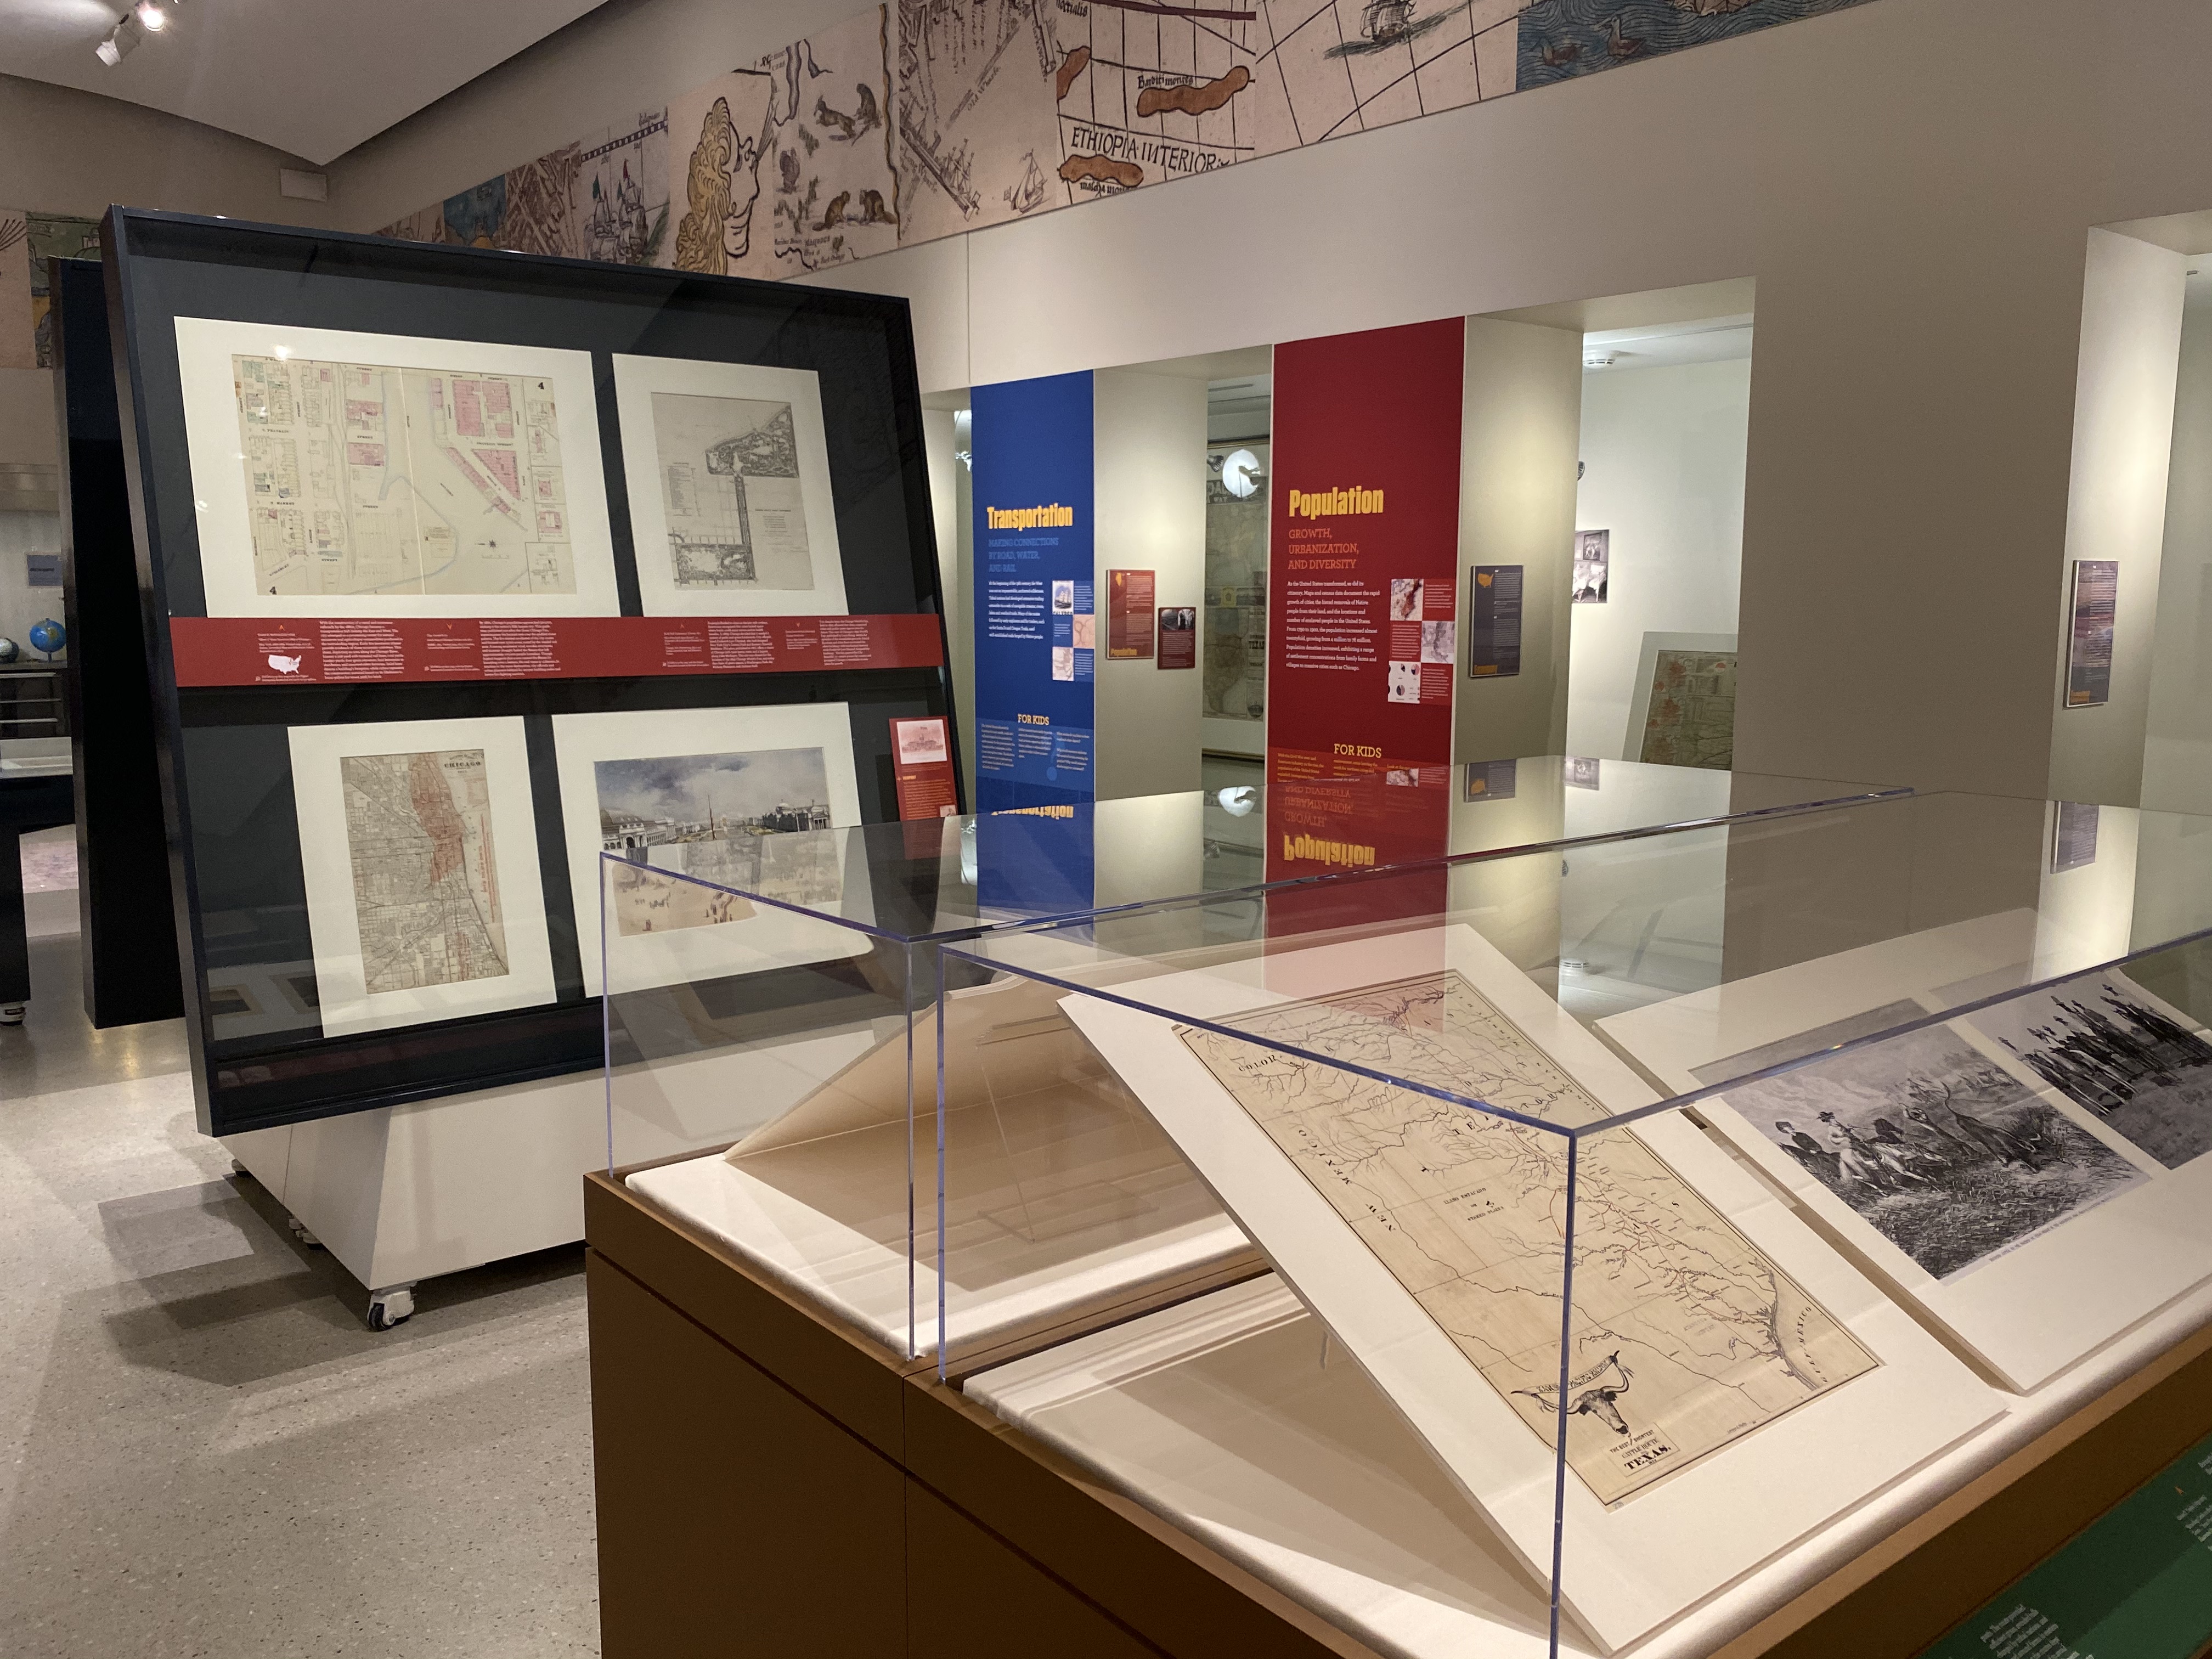
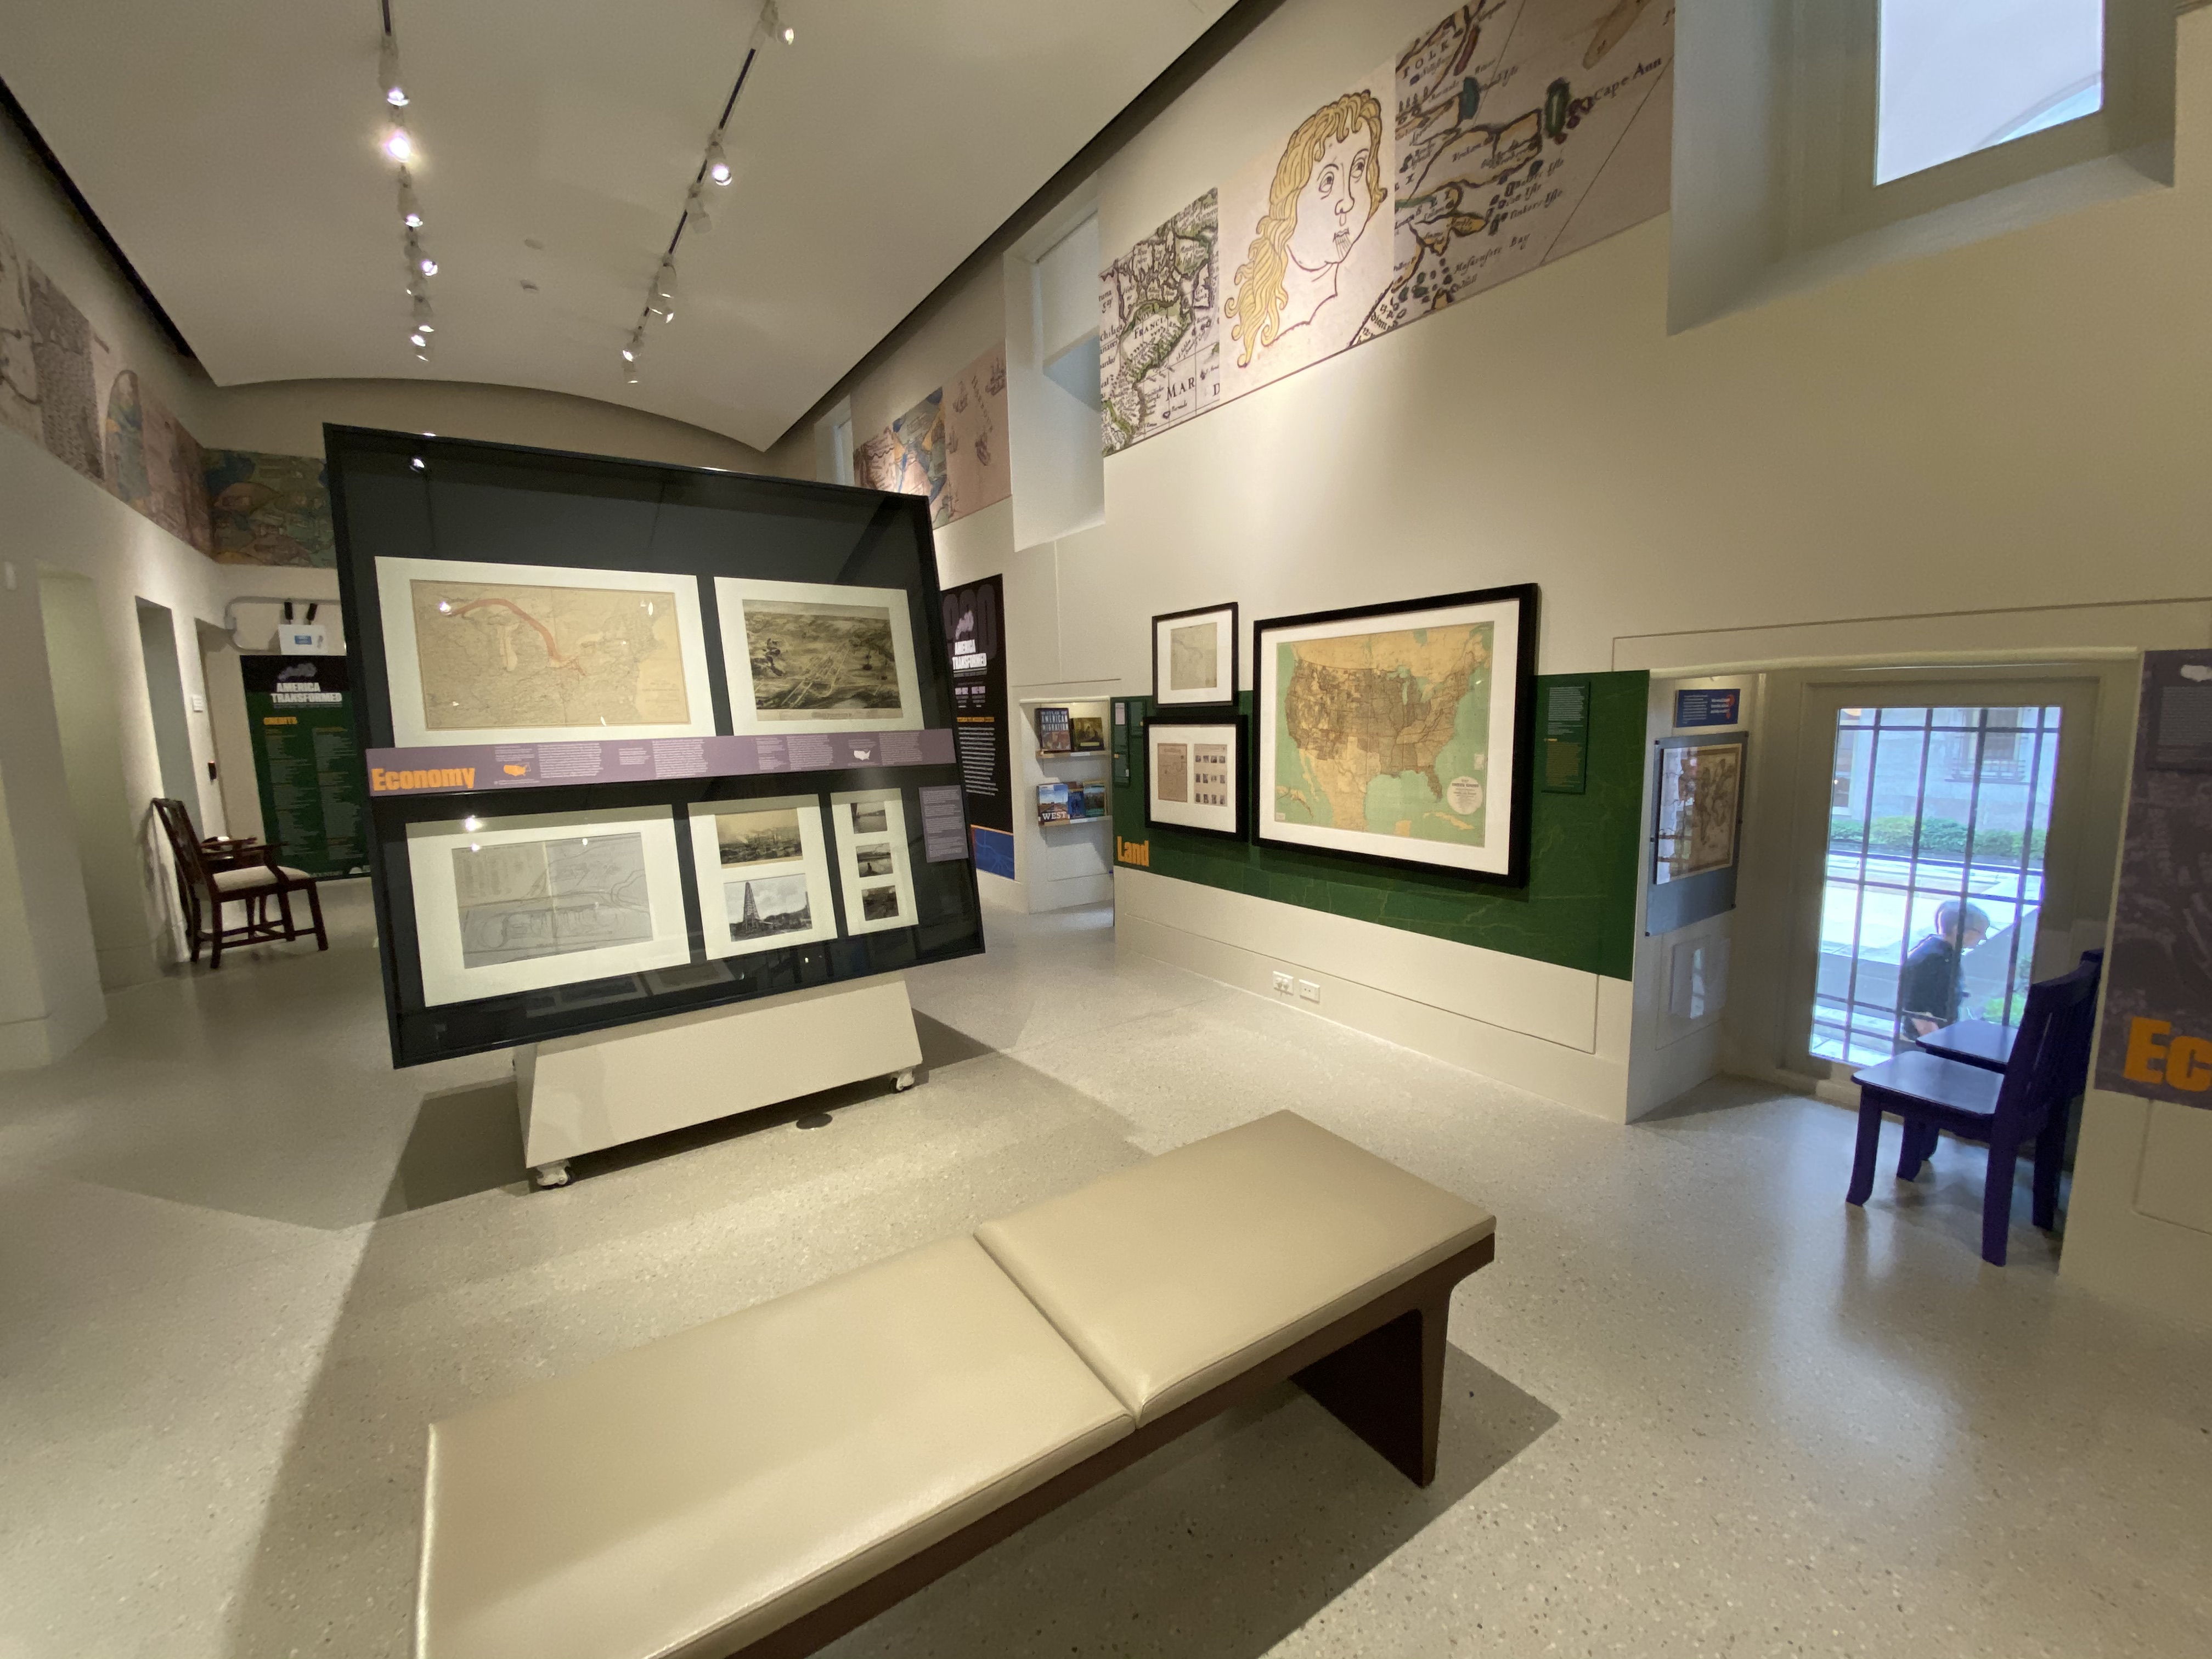
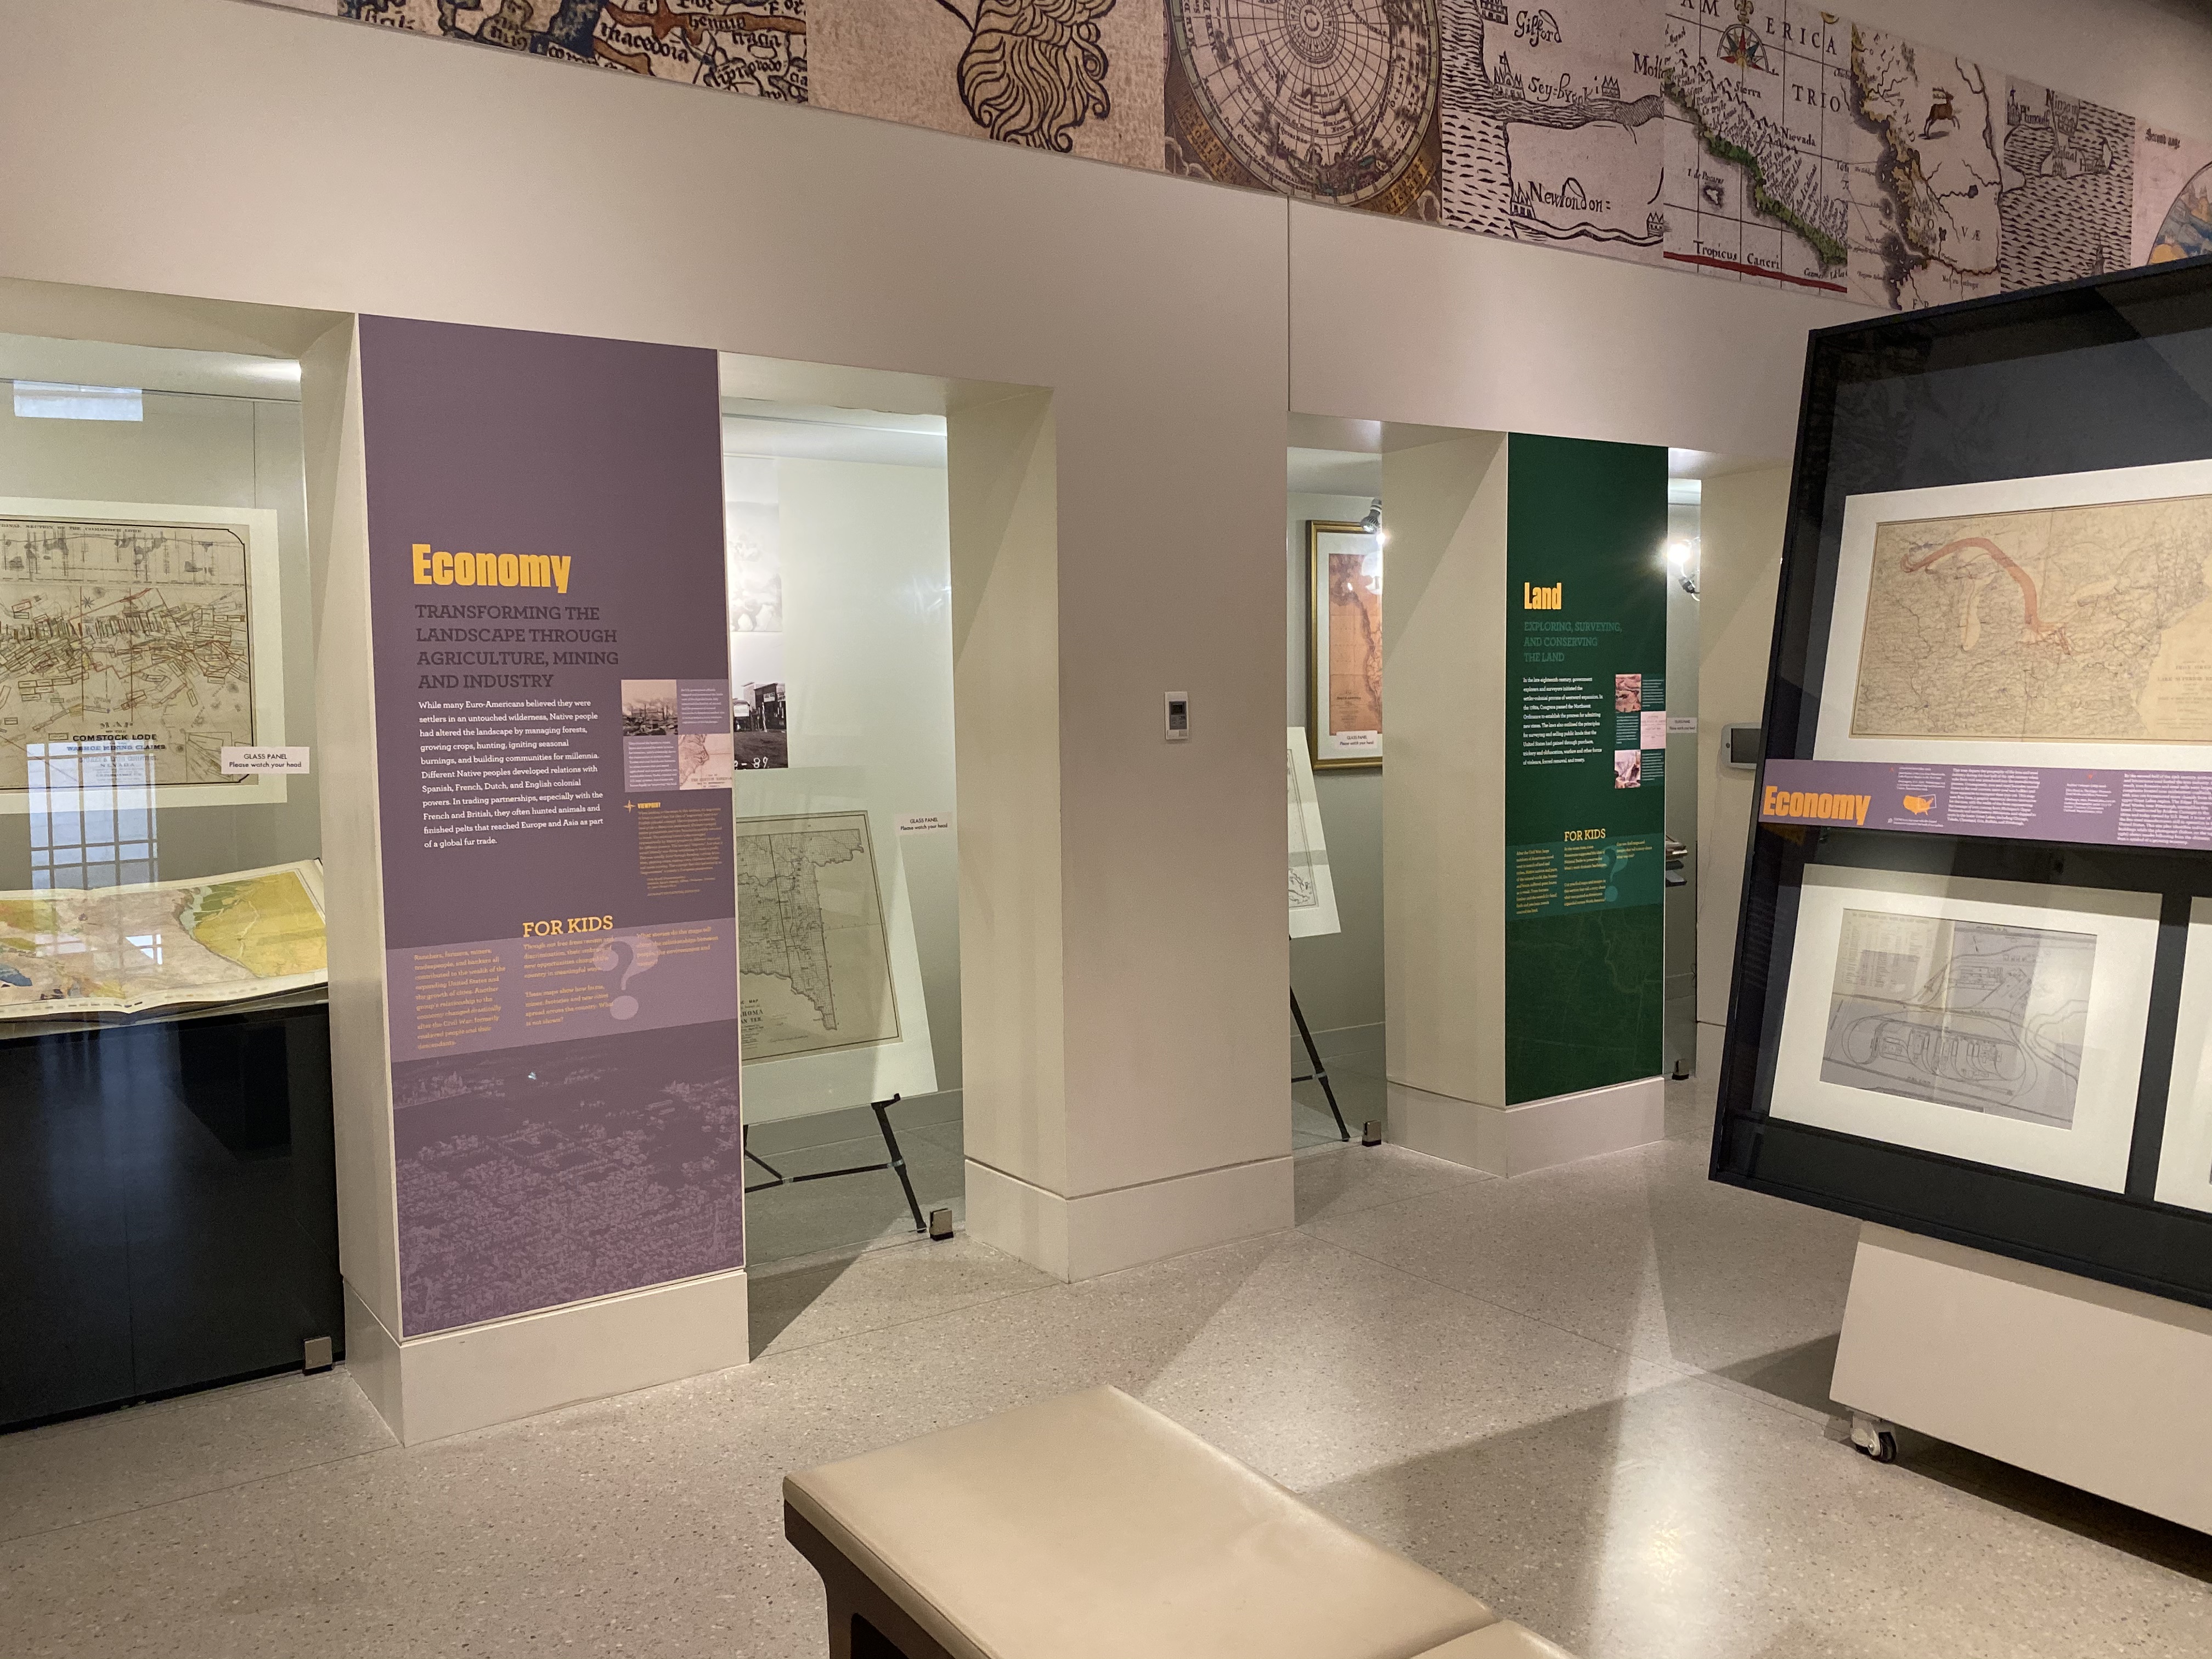
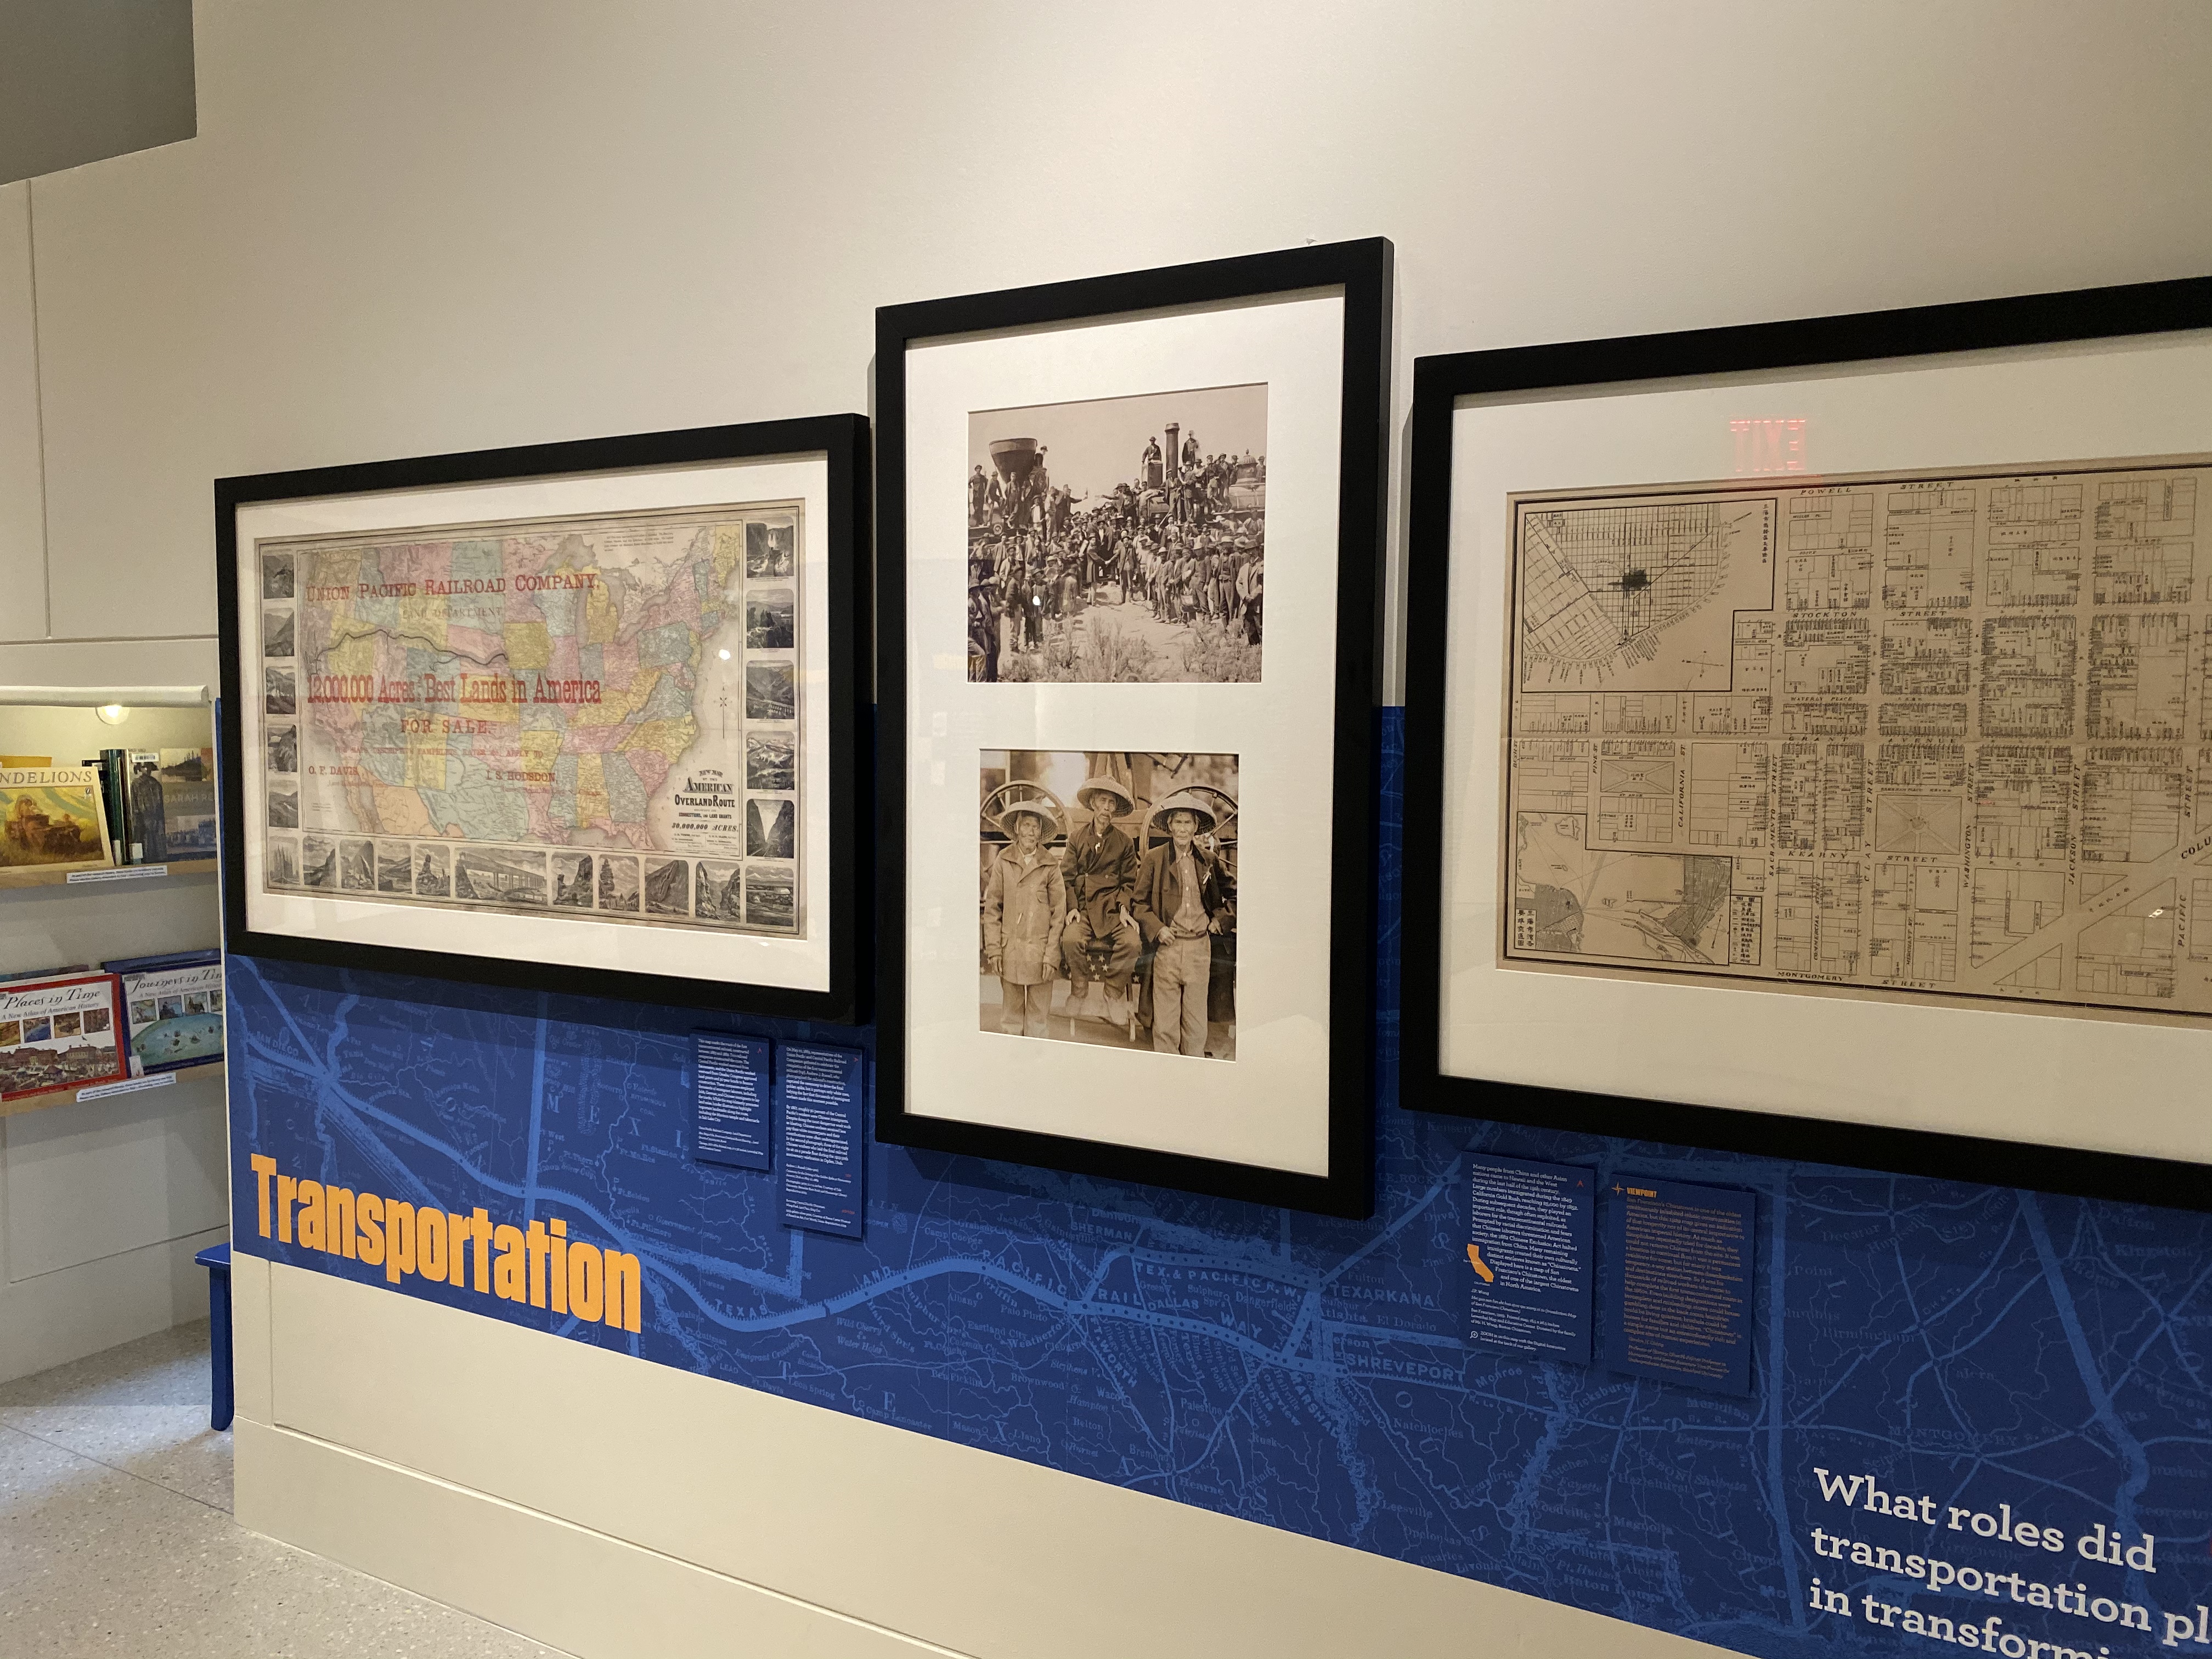
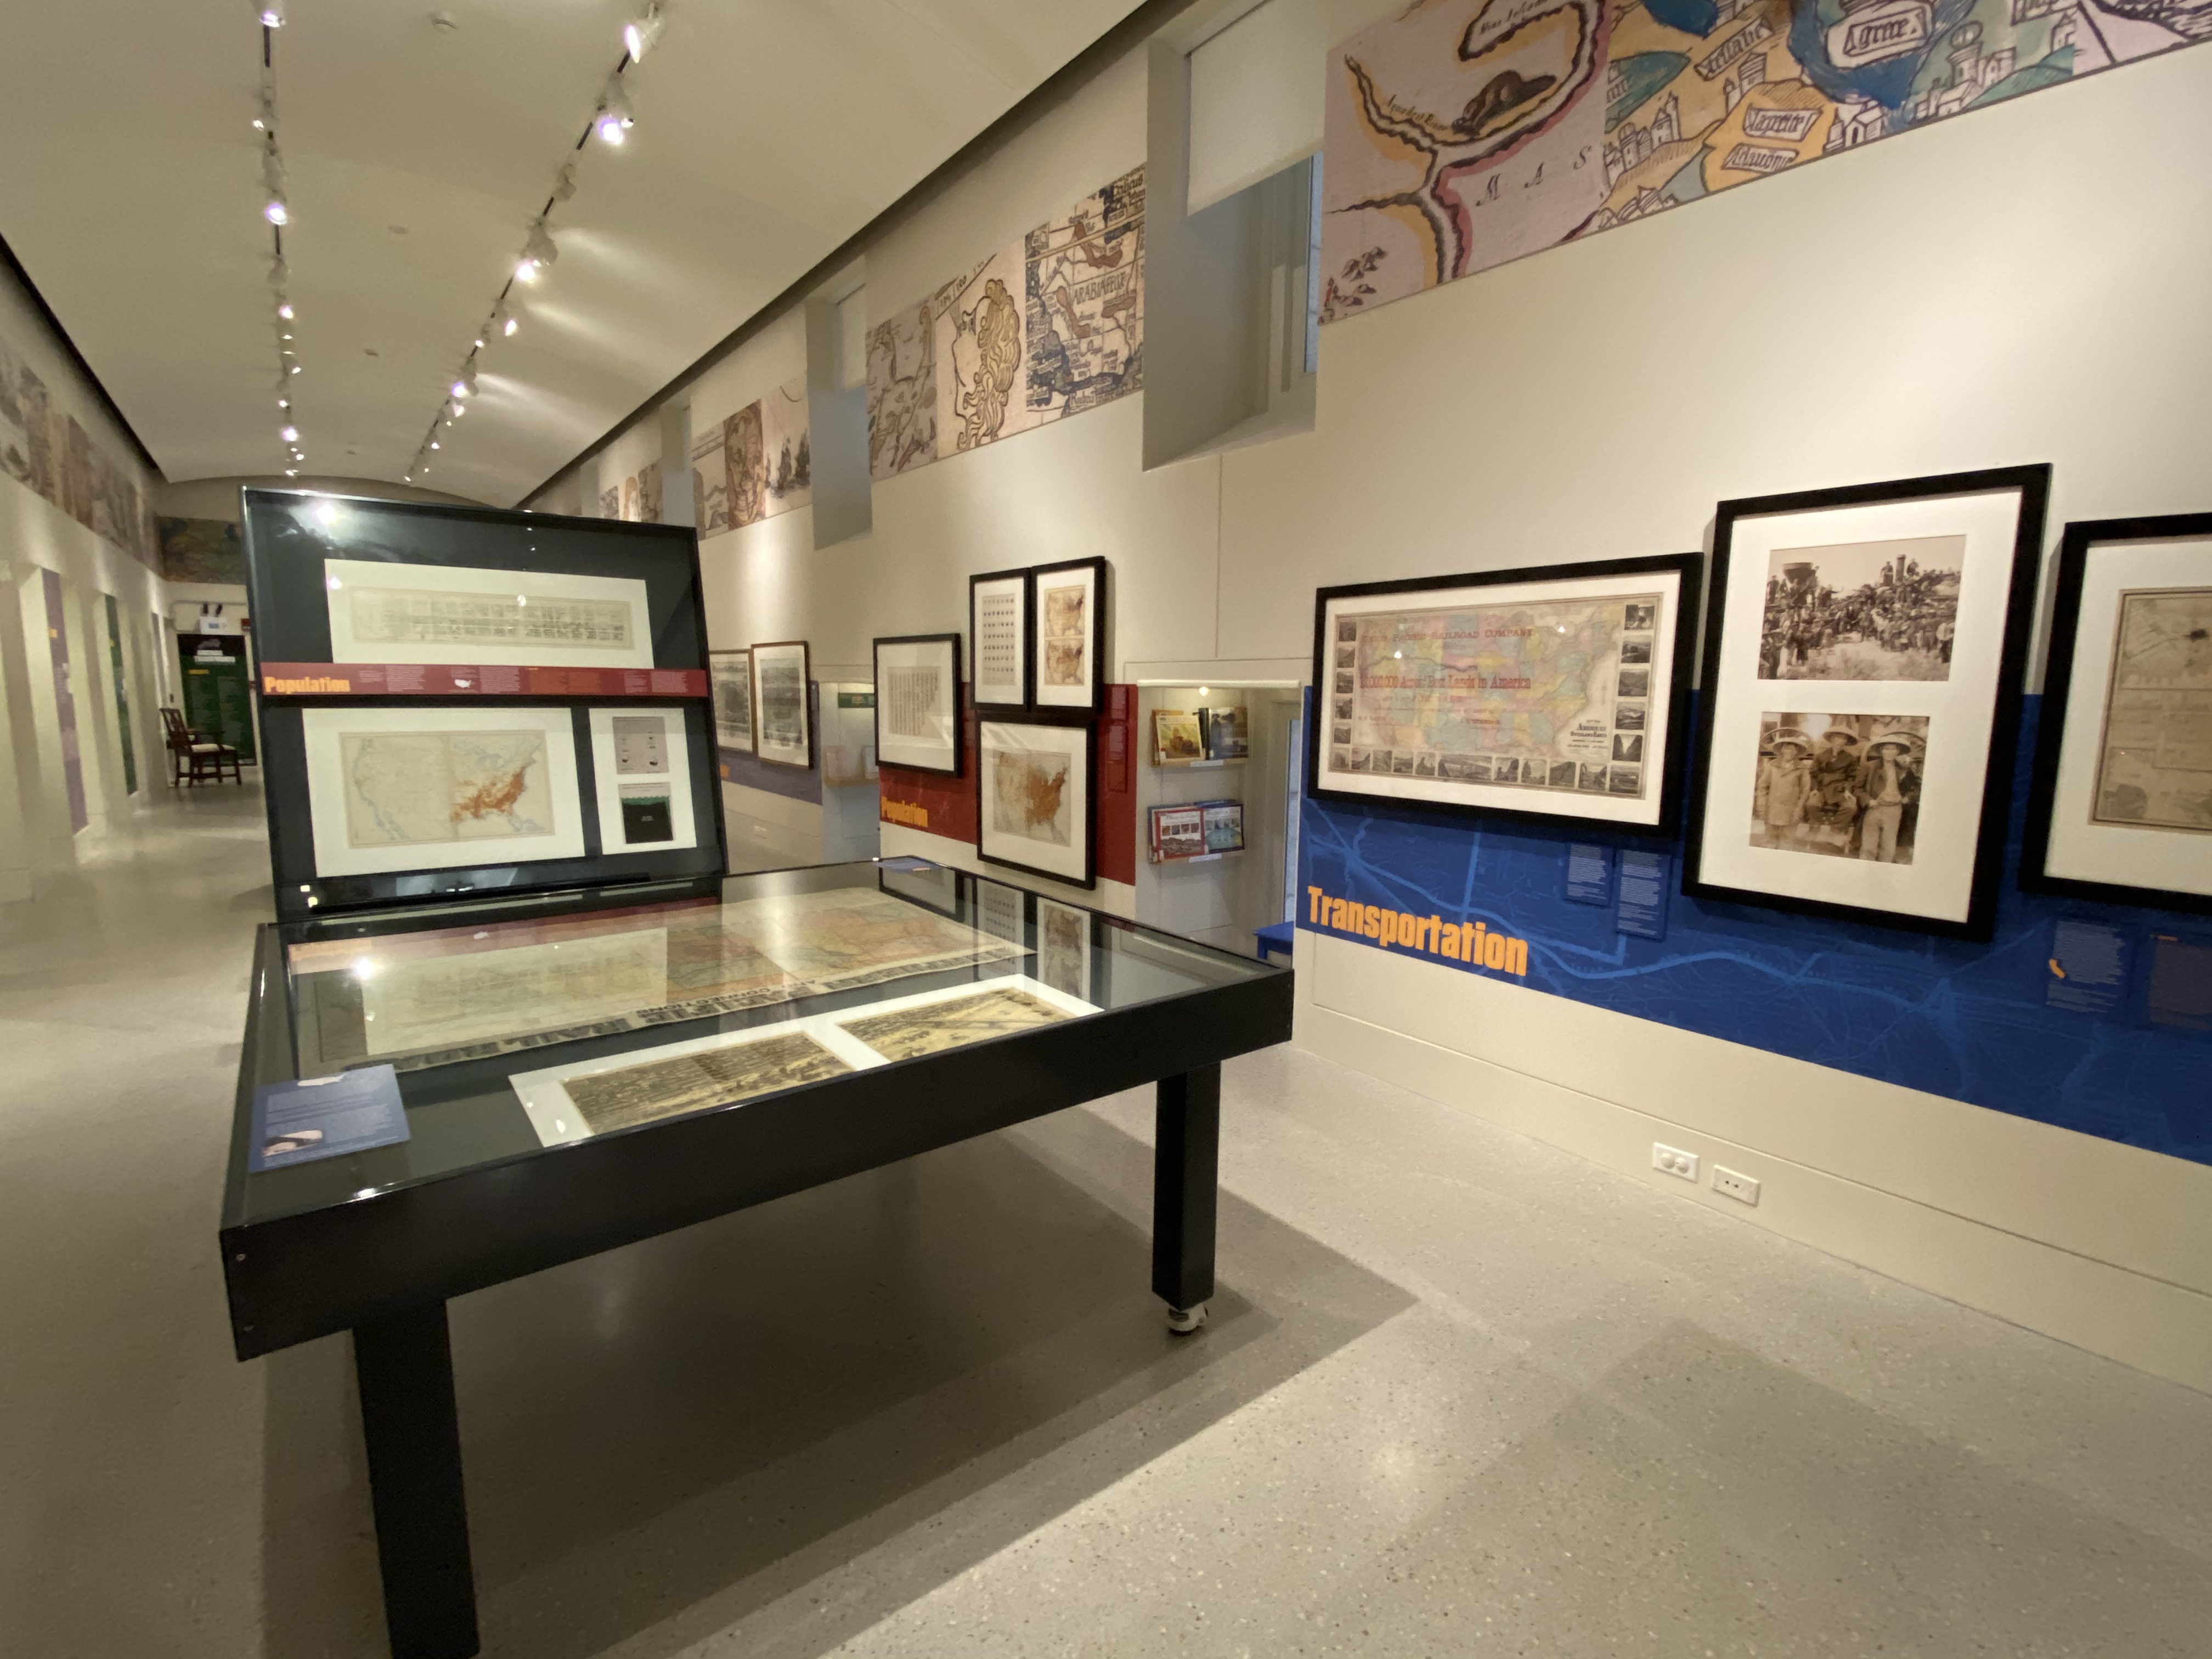
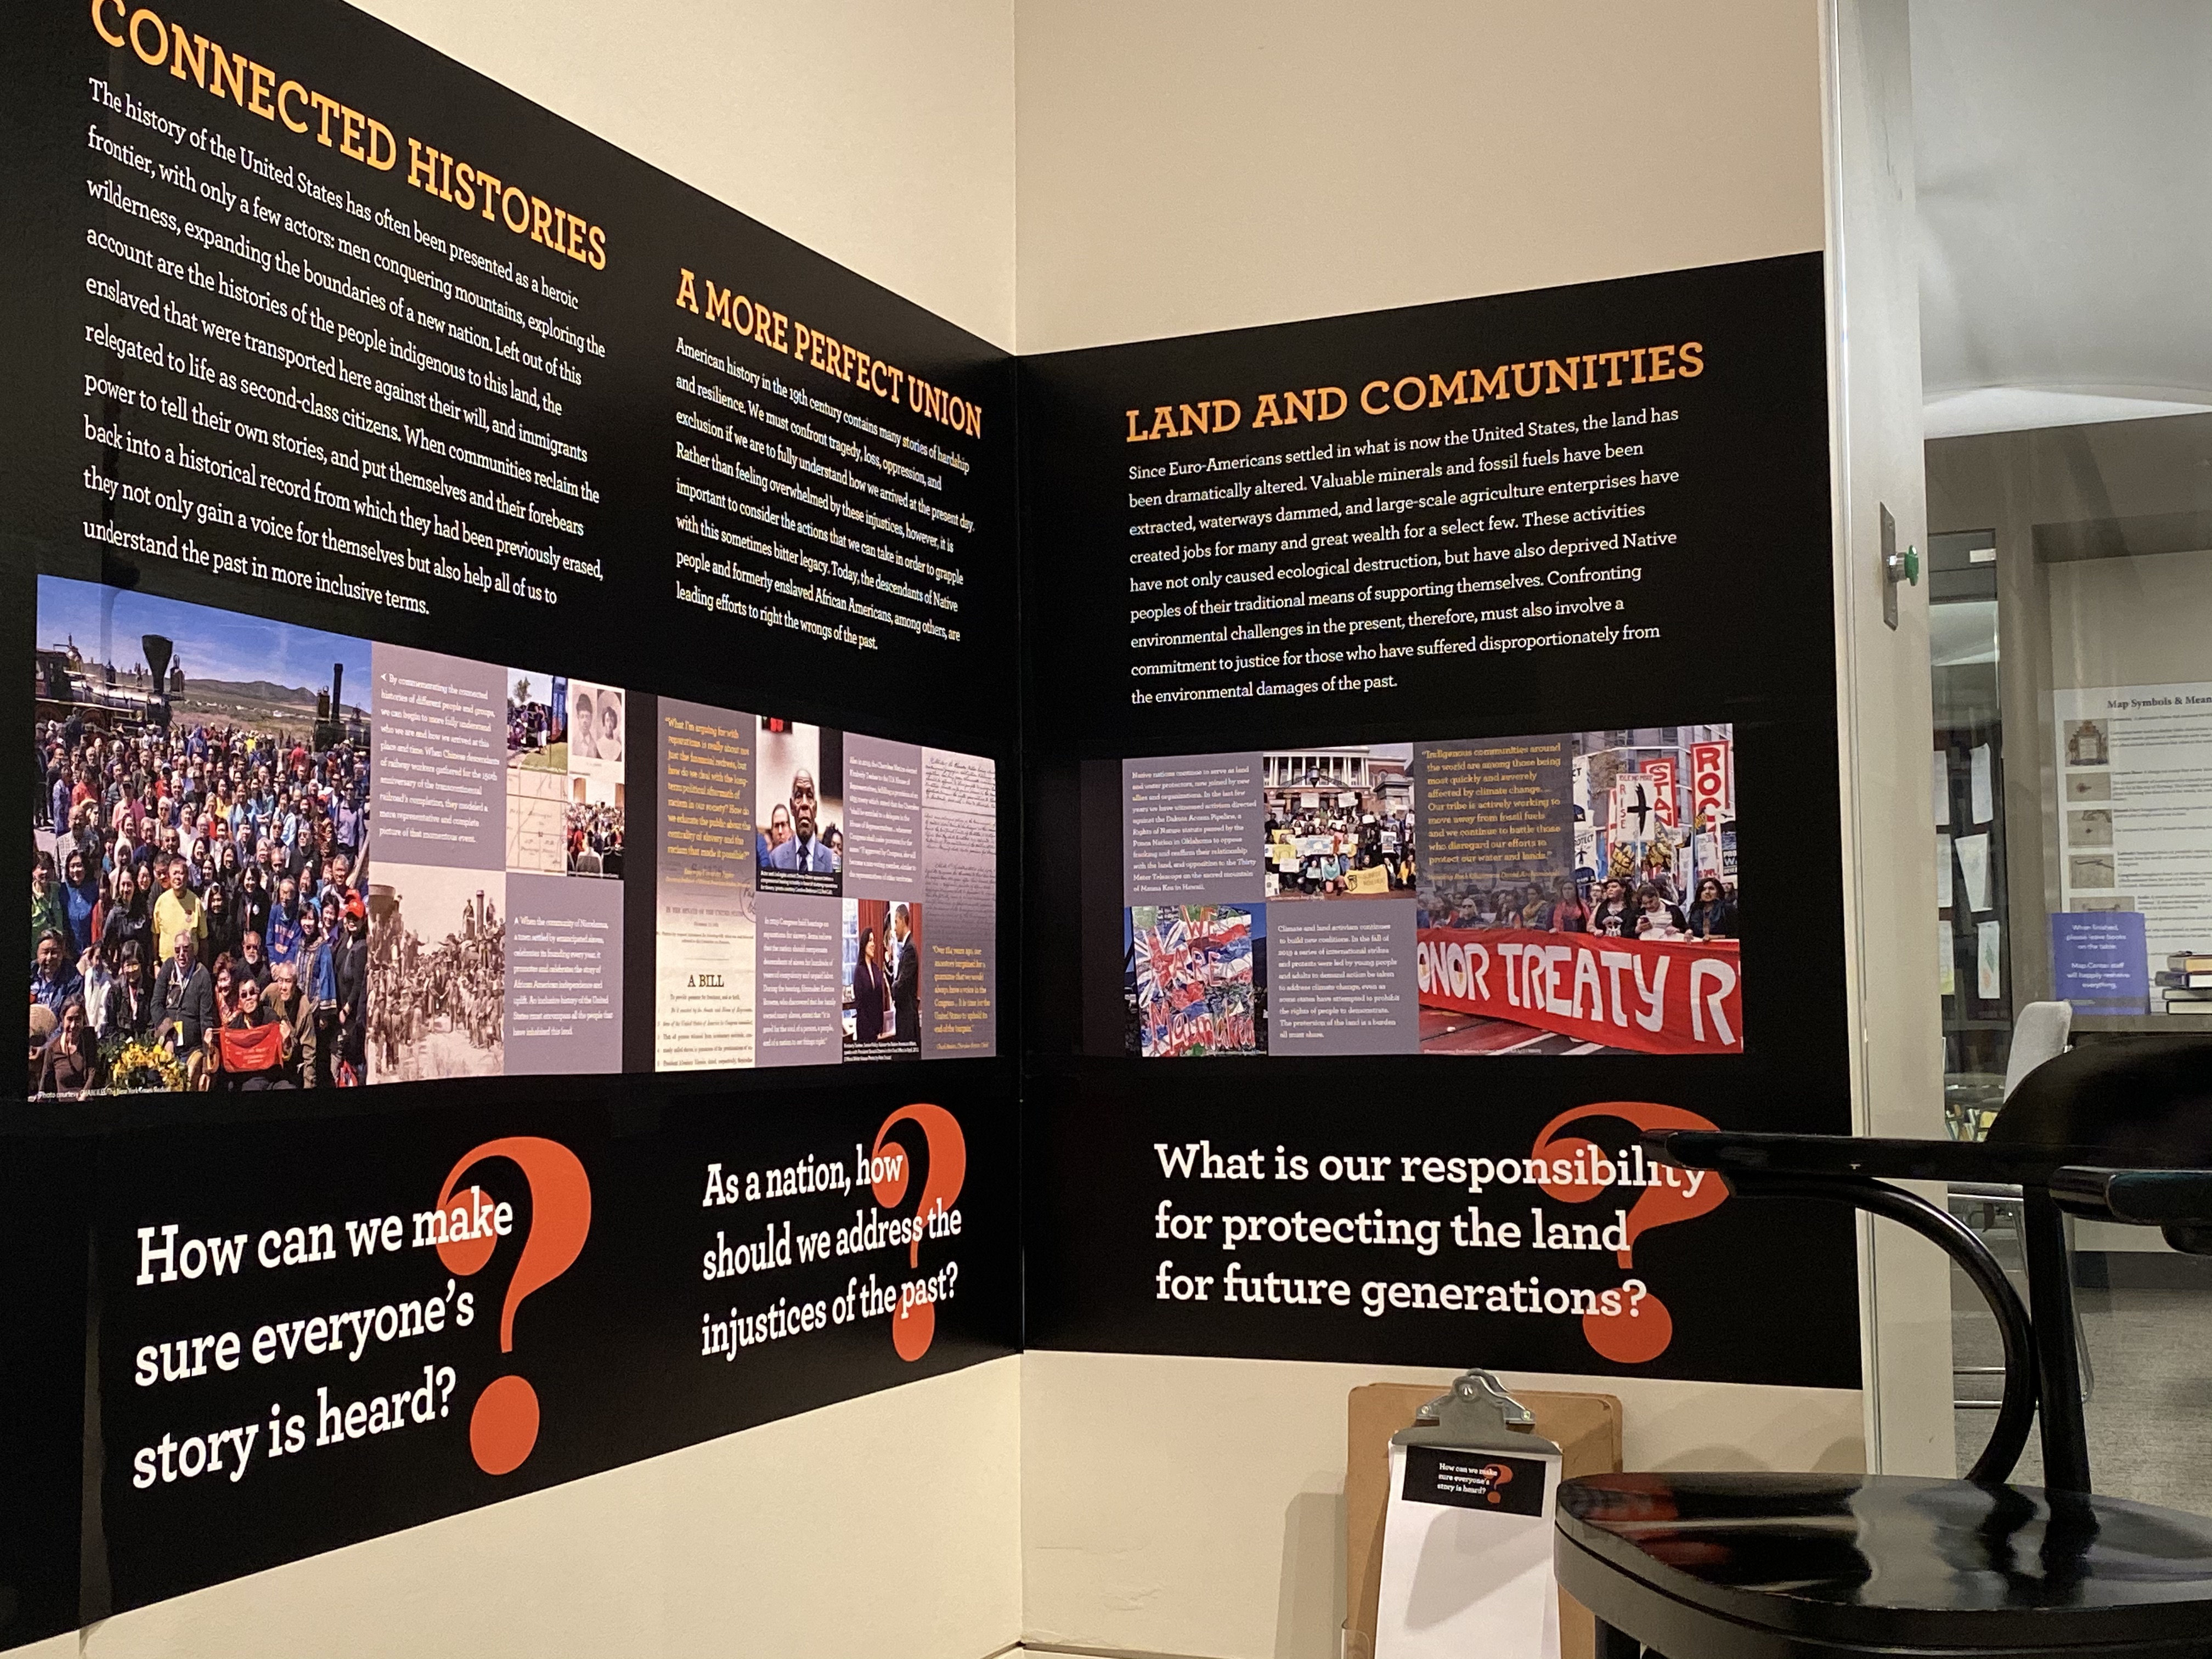
Credits
CURATOR
Ronald E. Grim, Ph.D
EXHIBITION ADVISORY COMMITTEE
Lawrence Caldwell
Colin Calloway, Ph.D
Ralph Ehrenberg
Anne Knowles, Ph.D
Alex Krieger
Allison Lange, Ph.D
J.C. McElveen
Margaret Pearce, Ph.D
Heather Cox Richardson, Ph.D
VIEWPOINTS CONTRIBUTORS
Akomawt Educational Initiative:
Chris Newell, endawnis Spears, Jason Mancini, Ph.D
Natchee Blu Barnd
Mishuana Goeman
Debra Newman Ham, Ph.D
Desiree Martinez
Rebecca Sockbeson, Ph.D
CONSULTANTS
Akomawt Educational Initiative:
Chris Newell, endawnis Spears, Jason Mancini, Ph.D
Stephanie Cyr, Project Manager
Shelley Dickerson, Copy Editor
Green Dragon Bindery, Conservation
Beau Kenyon, Composer
Dory Klein, Map Librarian
Allison Lange, Ph.D, Research & Curatorial
Assistant
Elizabeth Holbrook,
Museum and Collector Resource, Registrar
Benjamin McDonald Schmidt,
Land Grant Data
Visualization
Elisabeth Nevins,
Seed/Ed
Katherine Wroth, Editor
LENDERS
American Antiquarian Society
Boston Athenaeum
Boston Public Library
Rare Books Department
Print Department
Lawrence Caldwell
David Rumsey Map Collection
Library of Congress
Geography and Map Division
Prints and Photographs Division
The MacLean Collection, Richard Pegg & Tom Hall
National Archives and Records Administration
New York Public Library
Oklahoma Historical Society
Provincial Archives of Manitoba,
Hudson’s Bay
Company Archives
Ronald E. Grim
Smithsonian Institution,
National
Anthropological Archives
Yale University,
Beinecke Rare Book and
Manuscript Library
D. G. Yuengling and Son, Inc.
Connie C. Chin, President
Lynn Brown, Education Coordinator
Lauren Chen, Reference & Cataloging Librarian
Luwei Chen, GIS Intern, Gallery Attendant
Alison Cody, Development Manager
Abena Duker, GIS Intern, Gallery Attendant
Lauren Kennedy, Design & Communications Lead
Michelle LeBlanc, Director of Education
Isabelle Lipton, GIS Map Librarian
Rachel Mead, GIS Intern, Social Media, Gallery Attendant
Rachel Sharer, Development Administrative Assistant
Jill Swan, Administrative Intern, Gallery Attendant
Hanaan Yazdi, GIS Intern, Gallery Attendant
DESIGN & PRODUCTION CONSULTANTS
David King, All the King’s Men
Andrew Leonard
Dale Parker, Advanced Imagery
Rena Sokolow, one2tree
BOSTON PUBLIC LIBRARY
David Leonard, President
Communications Department
Digital Services
Facilities Department
IT Department
Rare Books Department
Research Services
Jessica Bitely, Preservation Manager
Tom Blake, Manager of Content Discovery
Sean Casey, Reference Librarian
Eben English, Digital Repository Services Manager
Anna Fahey-Flynn, Central Library Manager
Jay Hamilton, Technology Access Manager
Ben Hires, Director of Strategic Partnerships
Laura Irmscher, Chief of Collections
Christopher Letizia, Chief of Book Conservatory
Melanie Lima, Manager of System Wide Security
Jill Maneikis, Assistant Events Manager
Jay Moschella, Curator of Rare Books
Beth Prindle, Head of Special Collections
Kim Reynolds, Curator of Manuscripts
Aaron Schmidt, Special Library Assisstant
Lauren Schott, Conservation Officer
Eamon Shelton, Director of Operations
Meghan Weeks, Exhibit and Outreach Manager
LEAD SPONSOR
Iron Mountain
SUPPORT & Donors
Boston Cultural Council
Jane and Lawrence Caldwell
The Gladys Krieble Delmas Foundation
MacLean Foundation
Massachusetts Foundation for the Humanities
Katherine Chapman Stemberg & Bill Schnoor
Interactive
Bibliography
Books and Articles
Barr, Juliana and Edward Countryman, eds. Contested Spaces of Early America. Philadelphia: University of Pennsylvania Press, 2014.
Bernstein, David. How the West Was Drawn: Mapping, Indians, and the Construction of the Trans-Mississippi West. Lincoln: University of Nebraska Press, 2018.
Brückner, Martin. The Social Life of Maps in America, 1750-1860. Williamsburg, VA: Omohundro Institute of Early American History and Culture and Chapel Hill, NC: University of North Carolina Press, 2017.
Buisseret, David, ed. From Sea Charts to Satellite Images: Interpreting North American History through Maps. Chicago: The University of Chicago Press, 1990.
Caldwell, Larry. "Selling America: The General Land Office and the Rector-Conway Surveying Dynasty," The Portolan, no. 109 (Winter 2020), 29–49.
Caldwell, Larry and Michael Buehler. “Picturing a Networked Nation: Abraham Bradley’s Landmark U.S Postal Maps,” The Portolan, no. 77 (Spring 2010), 7-24.
Calloway, Colin G. New Worlds for All: Indians, Europeans, and the Remaking of Early America. Baltimore: Johns Hopkins University Press, 2013.
Cohen, Paul E. Mapping the West: America’s Westward Movement, 1524-1890. New York: Rizzoli, 2002.
Cronon, William, George Miles, and Jay Gitlin, eds. Under an Open Sky: Rethinkng America’s Western Past. New York: W.W. Norton, 1992. See especially Cronon, et. al. “Becoming West: Toward a New Meaning of Western History,” pp. 3-27.
Cronon, William. Nature’s Metropolis: Chicago and the Great West. New York: W. W. Norton & Company, 1992.
DeLay, Brian. War of a Thousand Deserts: Indian Raids and the U.S.-Mexican War. New Haven: Yale University Press, 2009.
Denson, Andrew. Demanding the Cherokee Nation: Indian Autonomy and American Culture, 1830-1900. Lincoln: University of Nebraska Press, 2004.
Ehrenberg, Ralph E. and Seymour I. Schwartz. The Mapping of America. New York: Henry Abrams, 1980.
Ehrenberg, Ralph E. Mapping the West with Lewis and Clark. Washington, DC: Library of Congress, 2015.
Frymer, Paul. Building an American Empire: The Era of Territorial and Political Expansion. Princeton: Princeton University Press, 2017.
Grim, Ronald E. “Mapping Kansas and Nebraska: The Role of the General Land Office,” Great Plains Quarterly, 5, no. 3 (Summer 1985), 177-197.
Hamalainen, Pekka. The Comanche Empire. New Haven: Yale University Press, 2009.
Hine, Robert V., John Mack Faragher, and Jon T. Coleman. The American West: A New Interpretive History, Second Edition. New Haven: Yale University Press, 2017.
Hoxie, Frederick E., ed. The Oxford Handbook of American Indian History. New York: Oxford University Press, 2016.
Hyde, Anne F. Empires, Nations, and Families: A New History of the North American West, 1800-1860. New York: Ecco, 2012.
Keene, Jennifer D., Saul Cornell, and Edward T. O’Donnell. Visions of America: A History of the United States. Boston: Prentice Hall, 2010.
Knowles, Anne K. and Chester Harvey. Mastering Iron: The Struggle to Modernize an American Industry, 1800–1868. Chicago: The University of Chicago Press, 2013.
Lane, Christopher W. “The Changing American West: Mapping Nineteenth-Century Political Transformation in the Trans-Mississippi West,” IMCoS Journal, no. 150 (Autumn 2017), 35-43.
Lewis, G. Malcolm, ed. Cartographic Encounters: Perspectives on Native American Mapmaking and Map Use. Chicago: The University of Chicago Press, 1998.
Luebke, Frederick C., Frances W. Kaye, and Gary E. Moulton, eds. Mapping the North American Plains. Norman: University of Oklahoma Press, 1987.
McDermott, Paul D., Ronald E. Grim, and Philip Mobley. Eye of the Explorer: Views of the Northern Pacific Railroad Surveys, 1853-54. Missoula, MT: Mountain Press, 2010.
McIlwraith, Thomas F. and Edward K. Muller, eds. North America: The Historical Geography of a Changing Continent. New York: Rowman & Littlefield Publishers, 2001.
Meinig, Donald W. The Shaping of America: A Geographical Perspective on 500 Years of History, Volume 2: Continental America, 1800–1867, and Volume 3: Transcontinental America, 1850–1915. New Haven: Yale University Press, 1993 -1998.
Milner, Clyde A., Carol A. O’Connor, and Martha A. Sandweiss, eds. The Oxford History of the American West. New York: Oxford University Press, 1994.
Peterson, Jon A. The Birth of City Planning in the United States, 1840-1917. Baltimore: Johns Hopkins University Press, 2003.
Reps, John W. The Making of Urban America: A History of City Planning in the United States. Princeton, New Jersey: Princeton University Press, 1965.
Reps, John W. Town Planning in Frontier America. Princeton, New Jersey: Princeton University Press, 1971.
Richardson, Heather Cox. Wounded Knee: Party Politics and the Road to an American Massacre. New York: Basic Books, 2011.
Ristow, Walter W. American Maps and Mapmakers: Commercial Cartography in the Nineteenth Century. Detroit: Wayne State University Press, 1985.
Sandweiss, Martha A. Print the Legend: Photography and the American West. New Haven: Yale University Press, 2002.
Smithers, Gregory D. The Cherokee Diaspora: An Indigenous History of Migration, Resettlement, and Identity. New Haven: Yale University Press, 2015.
Stremlau, Rose. Sustaining the Cherokee Family: Kinship and the Allotment of an Indigenous Nation. Chapel Hill: University of North Carolina Press, 2011.
Taft, Robert. Artists and Illustrators of the Old West, 1850-1900. New York: Charles Scribner’s Sons, 1953.
Trachtenberg, Alan. Reading American Photographs: Images as History, Mathew Brady to Walker Evans. New York: Hill and Wang, 1990.
Vance, James E. The North American Railroad: Its Origin, Evolution, and Geography. Baltimore: Johns Hopkins University Press, 1995.
Virga, Vincent, Curators of the Library of Congress, and Alan Brinkley. Eyes of the Nation: A Visual History of the United States. New York: Alfred A. Knopf, 1997.
Warhus, Mark. Another America: Native American Maps and the History of Our Land. New York: St. Martin’s Griffin, 1997.
Wheat, Carl I. Mapping the Trans-Mississippi West, 1540-1861. 5 vols. San Francisco: Institute of Historical Cartography, 1957-63.
Exhibition Catalogs and Online Presentations
Conzen, Michael P. and Diane Dillon. Mapping Manifest Destiny: Chicago and the American West. Chicago: The Newberry Library, 2007.
Ehrenberg, Ralph E. “Mapping the North American Plains: A Catalog of the Exhibition,” pp. 173-230, in Frederick C. Luebke, Frances W. Kaye, and Gary E. Moulton, eds. Mapping the North American Plains. Norman: University of Oklahoma Press, 1987.
Ehrenberg, Ralph E. “Taking the Measure of the Land,” Prologue: The Journal of the National Archives 9, no. 3 (Fall 1977), 128-150.
Friis, Herman R. Federal Exploration of the American West before 1880. Washington, DC: National Archives, 1963.
Grim, Ronald E. “Mapping Migration and Settlement,” in James R. Akerman and Peter Nekola, eds. Mapping Movement in American History and Culture. Chicago: Hermon Dunlap Smith Center for the History of Cartography at the Newberry Library, 2016. Online essay and gallery at http://mappingmovement.newberry.org/
Huseman, Ben W. Revisualizing Westward Expansion: A Century of Conflict in Maps, 1800–1900. Arlington, Texas: Special Collections University of Texas at Arlington Library, 2008. http://library.uta.eduhttps://leventhalmap.org/exhibitions/revisualizing-westward-expansion.
Huseman, Ben W. The Price of Manifest Destiny: Maps Relating to Wars in the Southwest Borderlands, 1800–1866. Arlington, Texas: Special Collections University of Texas at Arlington Library, 2014. http://library.uta.eduhttps://leventhalmap.org/exhibitions/price-manifest-destiny-maps-relating-wars-southwest-borderlands-1800-1866.
Library of Congress. Rivers, Edens, Empires: Lewis and Clark and the Revealing of America. Washington: Library of Congress, 2003. Virtual tour online at: http://www.loc.govhttps://leventhalmap.org/exhibitions/lewisandclark/
McElveen, J. C. “Westward the Course of Empire,” Exploring and Settling the American West, 1803-1869: Books and Maps from the Collection of J.C. McElveen, Jr. New York: The Grolier Club, 2018.
Osher Map Library. Maps of Westward Expansion in the United States. Portland, Maine: Osher Map Library Smith Center for Cartographic Education. Virtual tour online at: http://www.oshermaps.org/special-map-exhibits/mapping-westward-expansion
Ristow, Walter W. Maps for an Emerging Nation: Commercial Cartography in Nineteenth-century America. Washington, DC: Library of Congress, 1977.
Thrower, Norman J. W. How the West Was Mapped: The Cartography of the North American Southwest from Waldseemüller to Whitney. Milwaukee: American Geographical Society Collection of the Golda Meir Library, 2001.
Press
At the Boston Public Library, Mapping US History from Sea
to Not-So-Shining Sea
The Boston Globe, November 27, 2019
This Map Exhibit Draws A Darker U.S. History — Of Expansion
Into Native Lands
The ARTery, October 14, 2019
Museum Open House "America Transformed: Mapping the 19th
Century"
NewTV, June 4, 2019
The Leventhal Map Center at the BPL Takes a Trip Out
West
The Boston Globe, May 23, 2019